UNITED STATES DISTRICT COURT NORTHERN DISTRICT OF ...
UNITED STATES DISTRICT COURT NORTHERN DISTRICT OF ...
UNITED STATES DISTRICT COURT NORTHERN DISTRICT OF ...
Create successful ePaper yourself
Turn your PDF publications into a flip-book with our unique Google optimized e-Paper software.
302 CHAPTERS<br />
8.6 The Relation of Master Statuses and Same-Gender Sexuality<br />
Modification of Master Status Variizbles<br />
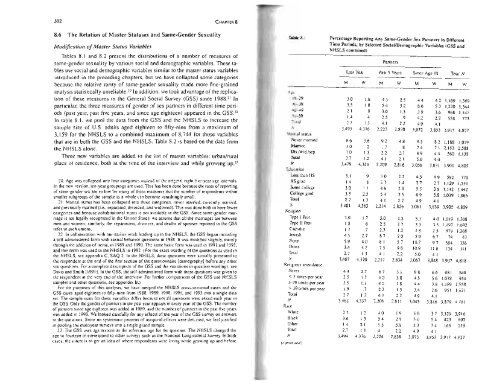
Tables 8. I and 8.2 present the distributions of a number of measures of<br />
same-gender sex uality by various social and demographic variables. These ta-<br />
I 8. 1 Percentage Reporting Any Same-Gender Sex Partners in Different<br />
Time Periods, by Selected SoclaVDemographic Variables (GSS and<br />
NHSLS combined)<br />
Parmers<br />
bles use social and demographic variables similar to the master status variables Last Year Pasl 5 Years Since Age 18 Total N<br />
introduced in the preceding chapters, but we have collapsed some categories<br />
because the relative rarity of same-gender sexuality made more fine-grained M W M W M W M W<br />
analysis statistically unreliable. 20 In addition, we took advantage of the replica- ..,-<br />
tion of these measures in the General Social Survey (GSS) since 1988 21 In I 29 30 1.6 4.3 2.5 4.4 4.2 1. 169 1.369<br />
particular, the three measures of gender of sex partners in different time peri-<br />
~ 39 3.5 1.8 5.4 3.2 6.6 5.3 1.220 1.544<br />
ods (past year. past five years, and since age eighteen) appeared in the Gss n<br />
~~9 2.1 8 3.0 1.3 3.9 3.6 968 1.141<br />
~ 59 1.4 .4 25 .9 4.2 2.2<br />
In table 8.1, we pool the data from the GSS and the NHSLS to increase the<br />
558 773<br />
Toul 2.7 1.3 4. 1 2.2 4.9 4.1<br />
sample size of U.S. adults aged eighteen to fifty-nine from a maximum of ,\' 3,493 4,376 2.223 2.838 3.072 3.853 3.915 4.827<br />
3,159 for the NHSLS to a combined maximum of 8,744 for those variables \Lariw stalus:<br />
that are in both the GSS and the NHSLS. Table 8.2 is based on the data from Ne'er married 6.6 3.6 9.2 4.8 9.5 8.2 1.188 1.079<br />
~t.arried 1.0 .2 1.7 .8 2.4 2.1 2. 153 2.588<br />
Div}wid.lsep. LO 1.3 2.2 2.7 4.9 4.5 560 1. 138<br />
Toul 2.7 1.2 4.1 2. 1 5.0 4.0<br />
the NHSLS alone.<br />
Three new variables are added to the list of master variables: urbanfrural<br />
place of residence, both at the time of the interview and while growing Up,2J N<br />
E..-\lcalion:<br />
3.479 4,354 2.209 2.816 3.058 3.831 3.901 4.805<br />
Less than HS 3. 1 .9 3.0 2.2 4.5 4.9 592 770<br />
20. Age was collapsed inlo fo ur categories instead of the original eight five-year age intervals. HS grad. 1.4 8 2.7 1.4 2.7 2.7 1.129 1,531<br />
In the new version. ten-year groupings are used. This has been done because the rates of reporting SOfTIe cullege 3.0 1 .. 1 4.6 2.0 5.3 3.8 1.142 1.442<br />
of same-gender sex are so low for many of these measures Ihat the number of respondenls within<br />
College grad. 3.5 2.5 5.4<br />
smaller subgroups of the sample as a whole can become vani shingly small.<br />
3.5 6.9 5.8 1,039 1.066<br />
TOIal 2.7<br />
21. Marital status has been collapsed imo tnree calegories: never married. currently married.<br />
1.3 4.1 2.2 4.9 4. 1<br />
...' and previously married (i.e., separated. divorced. and widowed). This was done both to have fewer<br />
3,481 4.363 2.214 2.826 3.061 3.839 3.902 4,809<br />
categories and because cohabitational status is not available in the GSS. Since same-gender mar-<br />
Religion :<br />
riage is not legally recognized in the United States. we assume thaI all the marriages are between Type I Prot. 3.0 1.7 5.0 2.2 5.3 4.0 1.0 19 1,308<br />
men and women; similarly. the separalions. divorces, and deaths of spouses reported in the GSS Type II Prot. 1.8 .6 2.5 17 3.3 3.5 1. 197 1.692<br />
refer to such unions. Catholic 1.7 .7 2.3 1.2 2.8 2.5 979 1.268<br />
22. In collaboration with our earlier work leading up 10 the NHSLS. the GSS began including kwish 4.5 2.7 8.7 2.0 5.0 6.7 74 83<br />
a self-adminislered fonn with sexual behavior queslions in 1988. It was modified slightly. mainly ~one 5.9 4.0 8.1 5.7 10.7<br />
through the addition of items. in 1989 and 1990. The same basic form was used in 1991 and 1993.<br />
9.7 504 356<br />
Other 3.4 4.2 7.5<br />
:md that form was used in the NHSLS in 1992. (For tne exacl wording of the questions as used in<br />
9.8 10.9 11.6 134 III<br />
Total 2.7 1.3 4. 1 2.2 5.0 4.1<br />
the NHSLS. see appendix C, SAQ 2. In the NHSLS, these questions were actually presented to<br />
N<br />
the respondent al the end of the first secli on of the questionnaire [demographyJ before any other<br />
3,487 4.370 2,2 17 2,834 3.067 3.848 3.907 4.818<br />
sex questions. For a complete description of tne GSS and the variations in question wordings, see<br />
Rdigious attendance:<br />
Davis and Smith [199IJ. In the GSS, the self-administered form with these questions was given to Never 4.4 2.7 6.7 3.1 8.8 6.6 681 648<br />
Ihe respondent at the very end of the interview. For further comparisons of the GSS and NHSLS < 3 times per year 2.5 1.7 4.0 3.8 4.5 5.6 1.078 954<br />
samples and other questions. see appendiX B.) }-39 times per year 2.5 1.1 4.2 1.8 4.4 3.8 1. 169 1.558<br />
For the purposes of thi s analysis. we have merged the NHSLS cross-sectional cases and the > 39 ti mes per year 1.9 .7 2.2 1.3 3.4 2.6 951 1.621<br />
GSS cases aged eighteen to fifty -nine from 1988. 1989. 1990. 1991. and 1993 inlo a single data Total 2.7 1.3 4.1 2.2 4.9 4.1<br />
set. The sample sizes for these variables differ because not all questions were asked each year in N 3,462 4.337 2.206<br />
the GSS. Only the gender of partners in the past year appears in every year of the GSS. The number<br />
2.811 3.043 3.816 3.879 4.781<br />
Race:<br />
of partners since age eighteen was added in 1989. and Ihe number of partners in the pasl five years<br />
White<br />
was added in 1990. We looked carefully for any effects of the year of the GSS survey on answers 2.7 1.2 40 1.9 5.0 3.7 3.329 3.916<br />
to the questions. Since no systematic patterns of temporal effects were det~cted. we feel justified<br />
Bl ack 3.6 1.3 5.4 2.9 5.0 5.4 423 692<br />
in pooling the multiyear surveys into a single grand sample. Other 1.4 2.1 1.3 5.9 3.3 7.4 165 219<br />
23 . The GSS uses age sixteen as the reference age for the question. The NHSLS changed the Total 2.7 1.3 41 2.2 4.9 4.1<br />
age to founeen to correspond to other surveys such as the National LongitUdinal Survey. In both N 3.494 4.376 2.224 2.838 3.073 3,853 3.917 4.827<br />
cases. the intent is to get an idea of where respondenls were living while growing up and before<br />
[contillued)


