UNITED STATES DISTRICT COURT NORTHERN DISTRICT OF ...
UNITED STATES DISTRICT COURT NORTHERN DISTRICT OF ...
UNITED STATES DISTRICT COURT NORTHERN DISTRICT OF ...

You also want an ePaper? Increase the reach of your titles
YUMPU automatically turns print PDFs into web optimized ePapers that Google loves.
310 CHAPTER 8<br />
levels of education are associated with greater social and sexual liberalism (see<br />
chapter 14) and with greater sexual experimentation (see Kinsey, Pomeroy, and<br />
Martin 1948; Kinsey et aL 1953; and chapter 3 above). Acceptance of nontraditional<br />
sexual behavior is likely to be higher among the more educated. This<br />
may facilitate higher rates of reporting among the better educated, even if behavioral<br />
differences across education levels are negligible. But it seems likely<br />
that both effects occur.<br />
We have already observed some drop-off in heterosexual partners (and rates<br />
of sexual activity) among the more highly educated women (see chapters 3 and<br />
5). On the one hand, more education for women may represent greater gender<br />
nonconformity. But it may also represent a higher level of personal resources<br />
(human capital) that can translate into more economic and social opportunities,<br />
which would, in turn, increase one's ability to please oneself rather than others.<br />
The fact that younger women (those under forty) report higher levels of samegender<br />
partners in all three time periods but do not so clearly report higher<br />
levels of same-gender desire may be due to historical changes that affect the<br />
opportunities and norms for cohorts differentially. In particular, the expectation<br />
and need for women to work and the lowering of barriers to economic success<br />
have had a greater effect on younger women. A more general pattern of<br />
younger women's sexual experiences becoming somewhat more like men's<br />
seems to be emerging in te:ms of hoth same- and opposite-gender activity.<br />
Both the ideology of women's equality and the structural bases for its realization<br />
have been increasing in the postwar period, but with especially marked<br />
increases since the late 1960s.<br />
The Mixture of Same- and Opposite-Gender Sex Partners<br />
So far we have focused on the existence of any same-gender partners in<br />
given time periods or the expression of sexual interest in people of the same<br />
gender. Many of those who report same-gender sexual experience or interest<br />
also have sexual experiences with and interest in people of the opposite gender<br />
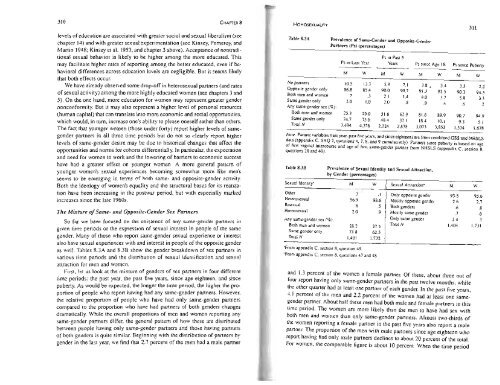
as well. Tables 8.3A and 8.3B show the gender breakdown of sex partners in<br />
various time periods and the distribution of sexual identification and sexual<br />
attraction for men and women.<br />
First, let us look at the mixture of genders of sex partners in four different<br />
time periods: the past year, the past five years, since age eighteen, and since<br />
puberty. As would be expected, the longer the time period, the higher the proportion<br />
of people who report having had any same-gender partners. However,<br />
the relative proportion of people who have had only same-gender partners<br />
compared to the proportion who have had partners of both genders changes<br />
dramaticalIy. While the overall proportions of men and women reporting any<br />
same-gender partners differ, the general pattern of how these are distributed<br />
between people having only same-gender partners and tho~e havmg partners<br />
of both genders is quite similar. Beginning with the distribution of partners by<br />
gender in the last year, we find that 2.7 percent of the men had a male partner<br />
HOMOSEXUALITY<br />
Table 8.3A<br />
Prevalence of Same-Gender and Opposite-Gender<br />
Partners (Ps) (percentages)<br />
311<br />
Ps in Past 5<br />
Ps in Last Year Years Ps since Age 18 Ps since Puberty<br />
M W M W M W M W<br />
No panners 10.5 13.3 5.9 7.1 3.8 l 3.4 3.3 2.2<br />
Opposite gender only 86.8 85.4 90.0 90.7 91.3 925 90.3 94.3<br />
Both men and women .7 .3 2.1 1.4 4.0 3.7 5.8 3.3<br />
Same gender only 2.0 1.0 2.0 .8 .9 .4 .6 .2<br />
Any same-gender sex (%):<br />
Both men and women 25.3 25.0 51.6 62.9 81.6 899 90.7 94.9<br />
Same gender only 74.7 75.0 48.4 37.1 18.4 10.1 9.3 5.1<br />
Total N 3.494 4,376 2,224 2,8 38 3,073 3,853 1,334 1,678<br />
Nore: Partner variables (last year, past five years, and since eight~n) are from combined GSS and NHSLS<br />
data (appendix C, SAQ 2, questions 4, 7, 8, and 9 cumulatively). Partners since puberty is based on age<br />
of first vagmal '"tercourse and age of first same-gender partner from NHSLS (appendix C, section 8,<br />
questIons 20 and 40).<br />
Table 8.3B<br />
Prevalence of Sexual Identity and Sexual Attraction,<br />
by Gender (percentages)<br />
Sexual Identity" M W Sexual Attraction'<br />
Other .3 .1 Only opposite gender<br />
Heterosexual 96.9 98.6 Mostly opposite gender<br />
Bisexual .8 .5 Both genders<br />
Homosexual 2.0 .9 Mostly same gender<br />
Any same-gender sex (%):<br />
Only same gender<br />
Both men and women 28 .2 37.5<br />
TotalN<br />
Same gender only 71.8 62.5<br />
Total N 1,401 1,732<br />
'From appendix C, section 8, question 49.<br />
"From appendix C, section 8. questions 47 and 48 .<br />
M<br />
93.8<br />
2.6<br />
.6<br />
.7<br />
2.4<br />
1.404<br />
and 1.3 percent of the women a female partner. Of these, about three out of<br />
four report having only same-gender partners in the past twelve months, while<br />
the other quarter had at least one partner of each gender. In the past five years,<br />
4. I percent of the men and 2.2 percent of the women had at least one samegender<br />
partner. About half these men had both male and female partners in this<br />
time period. The women are more likely than the men to have had sex with<br />
both men and women than only same-gender partners. Almost two-thirds of<br />
the women reporting a female partner in the past five years also report a male<br />
partner. The proportion of the men with male partners since age eighteen who<br />
report having had only male partners declines to about 20 percent of the total.<br />
For women, the comparable figure is about 10 percent. When the time period<br />
W<br />
95.6<br />
2.7<br />
.8<br />
.6<br />
.3<br />
1.731