UNITED STATES DISTRICT COURT NORTHERN DISTRICT OF ...
UNITED STATES DISTRICT COURT NORTHERN DISTRICT OF ...
UNITED STATES DISTRICT COURT NORTHERN DISTRICT OF ...

You also want an ePaper? Increase the reach of your titles
YUMPU automatically turns print PDFs into web optimized ePapers that Google loves.
314<br />
CHAPTERS<br />
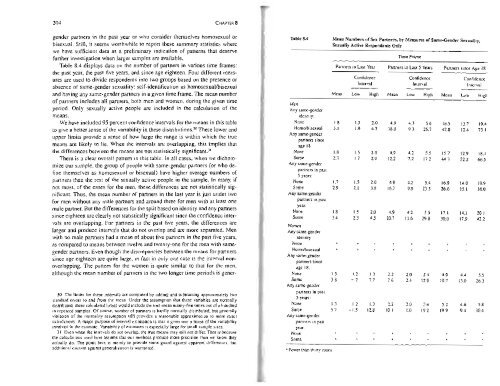
gender partners in the past year or who consider themselves homosexual or Table 8.4 Mean Numbers of Sex Partners, by Measures of Same-Gender Sexuality,<br />
bisexual. Still, it seems worthwhile to report these summary statistics where<br />
Sexually Active Respondents Only<br />
we have sufficient data as a preliminary indication of patterns that deserve<br />
further investigation when larger samples are available.<br />
Time Frame<br />
Table 8.4 displays data on the number of partners in various time frames: Partners in Last Year Partners in Last 5 Years Partners since Age 18<br />
the past year, the past five years, and since age eighteen. Four different meas-<br />
Confidence<br />
Confidence<br />
Confidence<br />
ures are used to divide respondents into two groups based on the presence or<br />
Interval Interval interval<br />
absence of same-gender sexuality: self-identification as homosexuallbisexual<br />
and having any same-gender partners in a given time frame. The mean number<br />
Mean Low High Mean Low High Mean Low High<br />
of partners includes all partners, both men and women, during the given time<br />
Men<br />
period. Only sexually active people are included in the calculation of the<br />
Any same· gender<br />
means.<br />
identity:<br />
We have included 95 percent confidence intervals for the means in this table<br />
None 1.8 1.5 2.0 4.9 4.3 56 16.5 13.7 19.4<br />
to give a better sense of the variability in these distributions. 30 Homo/bisexual 3. 1 1.9 4.2 18.0 9.3 26.7 42.8 12.4 73.1<br />
These lower and<br />
Any same· gender<br />
upper limits provide a sense of how large the range is within which the true<br />
partners since<br />
means are likely to lie. When the intervals are overlapping, this implies that age 18:<br />
the differences between the means are not statistically significant. J1 None 1.8 1.5 2.0 4.9 4.2 5.5 15.7 12.9 18.4<br />
There is a clear overall pattern in this table. In all cases, when we dichoto-<br />
Some 2.3 J.7 2.9 12.2 7.2 17.2 44.3 22.2 66.5<br />
Any same· gender<br />
mize our sample, the group of people with same-gender partners (or who departners<br />
in past<br />
fine themselves as homosexual or bisexual) have higher average numbers of<br />
5 years:<br />
par1i1eiS than the rest of the sexually active people in the sample. In many, if None 1.7 1.5 2.0 4.8 4.2 5.4 16.9 14.0 19.9<br />
not most, of the cases for the men, these differences are not statistically sig- Some 2.9 2.1 3.8 16.7 9.9 23 .5 26.6 15.1 38.0<br />
nificant. Thus, the mean number of partners in the last year is just under two<br />
Any same-gender<br />
partners in past<br />
for men without any male partners and around three for men with at least one<br />
year:<br />
male partner. But the differences for the split based on identity and any partners<br />
None 1.8 1.5 2.0 4.9 4.2 5.5 17.1 14.1 201<br />
since eighteen are clearly not statistically significant since the confidence inter- Some 3.4 2.3 4.5 20.7 11.6 29.8 30.0 17.9 42.2<br />
vals are overlapping. For partners in the past five years, the differences are<br />
Women<br />
larger and produce intervals that do not overlap and are more separated. Men<br />
Any same-gender<br />
with no male partners had a mean of about five partners in the past five years,<br />
identity:<br />
None<br />
as compared to means between twelve and twenty-one for the men with same-<br />
Homo/bisexual<br />
gender partners. Even though the discrepancies between the means for partners<br />
Any same-gender<br />
since age eighteen are quite large, in fact in only one case is the interval non-<br />
partners since<br />
overlapping. The pattern for the women is quite similar to that for the men, age 18:<br />
although the mean number of partners in the two longer time periods is gener- None I.3 1.2 1.3 2.2 2.0 2.4 49 4.4 5.5<br />
Some 3.8 - .2 7.7 7.6 2.4 12.9 19.7 13.0 26.3<br />
Any same-gender<br />
partners in past<br />
30. The limits for these intervals are computed by adding and subtracting approximately two<br />
5 years:<br />
standard errors to and from the mean. Under the assumption that these variables are normally<br />
None 1.3 1.2 1.3 2.2 2.0 2.4 5.2 4.6 5.8<br />
disuibuted, these calculated limits would include the true mean ninety-five times out of a hundred<br />
Some 5.7 -1.5 12.8 101 1.0 19.2 19.9 9.4 30.4<br />
in repeated samples. Of course, number of partners is hardly normally distributed. but generally<br />
violation of the normality assumption still provides a reasonable approximation to more exact<br />
Any same-gender<br />
calculations. A major purpose of interval estimation is that it gives one a sense of the variability<br />
partners in past<br />
involved in the estimate. Variability of estimates is especially large for small sample sizes.<br />
year:<br />
31. Even when the intervals do not overlap, the true means may still not differ. That is because None<br />
the calculations used here assume that our methods produce more precision than we know they<br />
Some<br />
actually do. The point here is mainly to provide some guard against apparent differences, but<br />
additional caution against generalizati on is warranted.<br />
• Fewer than thiny cases.