View Annual Review - IAESTE
View Annual Review - IAESTE
View Annual Review - IAESTE

You also want an ePaper? Increase the reach of your titles
YUMPU automatically turns print PDFs into web optimized ePapers that Google loves.
I A E S T E — A N N U A L R E V I E W 2 0 0 6<br />
In 2005, 25 Members and Co-operating<br />
Institutions received more students than<br />
they sent abroad and this benefi ted the rest.<br />
In total, 554 work experience places were<br />
involved or 11.5% of the total exchange.<br />
It is traditional within <strong>IAESTE</strong> for Members<br />
with a higher Gross National Income per<br />
capita (GNI) to receive more trainees<br />
than they send. Strict reciprocity is not<br />
implemented with new Members in the<br />
early years which allow those in developing<br />
countries and those from smaller countries to<br />
gather support within their country in order<br />
to develop the exchange. Countries with a<br />
GNI per capita >12,000 US$ provided 57%<br />
of these places in 2005, a traumatic decline<br />
from 2004.<br />
2005<br />
2004<br />
2003<br />
2002<br />
2001<br />
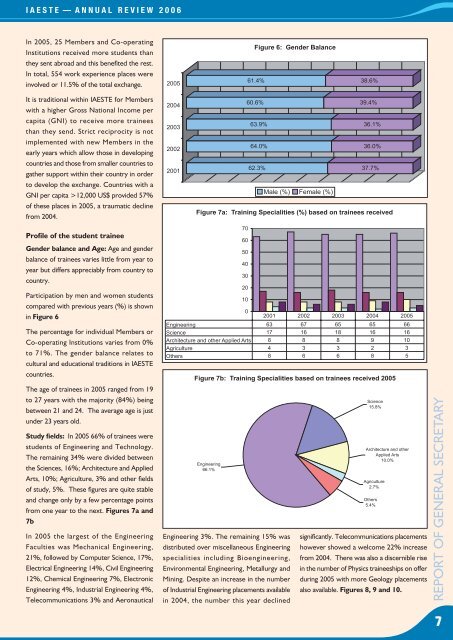
Figure 6: Gender Balance<br />
61.4% 38.6%<br />
60.6% 39.4%<br />
63.9% 36.1%<br />
64.0% 36.0%<br />
62.3% 37.7%<br />
Male (%) Female (%)<br />
Figure 7a: Training Specialities (%) based on trainees received<br />
Profile of the student trainee<br />
Gender balance and Age: Age and gender<br />
balance of trainees varies little from year to<br />
year but differs appreciably from country to<br />
country.<br />
Participation by men and women students<br />
compared with previous years (%) is shown<br />
in Figure 6<br />
The percentage for individual Members or<br />
Co-operating Institutions varies from 0%<br />
to 71%. The gender balance relates to<br />
cultural and educational traditions in <strong>IAESTE</strong><br />
countries.<br />
The age of trainees in 2005 ranged from 19<br />
to 27 years with the majority (84%) being<br />
between 21 and 24. The average age is just<br />
under 23 years old.<br />
Study fields: In 2005 66% of trainees were<br />
students of Engineering and Technology.<br />
The remaining 34% were divided between<br />
the Sciences, 16%; Architecture and Applied<br />
Arts, 10%; Agriculture, 3% and other fi elds<br />
of study, 5%. These fi gures are quite stable<br />
and change only by a few percentage points<br />
from one year to the next. Figures 7a and<br />
7b<br />
In 2005 the largest of the Engineering<br />
Faculties was Mechanical Engineering,<br />
21%, followed by Computer Science, 17%,<br />
Electrical Engineering 14%, Civil Engineering<br />
12%, Chemical Engineering 7%, Electronic<br />
Engineering 4%, Industrial Engineering 4%,<br />
Telecommunications 3% and Aeronautical<br />
70<br />
60<br />
50<br />
40<br />
30<br />
20<br />
10<br />
0<br />
2001 2002 2003 2004 2005<br />
Engineering 63 67 65 65 66<br />
Science 17 16 18 16 16<br />
Architecture and other Applied Arts 8 8 8 9 10<br />
Agriculture 4 3 3 2 3<br />
Others 8 6 6 8 5<br />
Figure 7b: Training Specialities based on trainees received 2005<br />
Engineering<br />
66.1%<br />
Engineering 3%. The remaining 15% was<br />
distributed over miscellaneous Engineering<br />
specialities including Bioengineering,<br />
Environmental Engineering, Metallurgy and<br />
Mining. Despite an increase in the number<br />
of Industrial Engineering placements available<br />
in 2004, the number this year declined<br />
Science<br />
15.8%<br />
Architecture and other<br />
Applied Arts<br />
10.0%<br />
Agriculture<br />
2.7%<br />
Others<br />
5.4%<br />
signifi cantly. Telecommunications placements<br />
however showed a welcome 22% increase<br />
from 2004. There was also a discernible rise<br />
in the number of Physics traineeships on offer<br />
during 2005 with more Geology placements<br />
also available. Figures 8, 9 and 10.<br />
REPORT OF GENERAL SECRETARY<br />
7