View presentation (PDF) - Department of Supply Chain Management
View presentation (PDF) - Department of Supply Chain Management
View presentation (PDF) - Department of Supply Chain Management

You also want an ePaper? Increase the reach of your titles
YUMPU automatically turns print PDFs into web optimized ePapers that Google loves.
Risk<br />
Zone<br />
Supplier Risk Example<br />
Prent<br />
Vendors Spend (K) Part#<br />
Risk Reason Mitigation<br />
Alcoa<br />
2382.01 85<br />
1156.22 36<br />
1) Low BSC business/Prent<br />
revenue 2) High SRIM%<br />
1) Low BSC business/Alcoa<br />
revenue 2) Slow response to<br />
technical problem 3) High<br />
employee and senior staff<br />
turnover rate 4) Low market<br />
bargain power 5) Sole sourced<br />
material 6) Poor quality<br />
1) Allocate more resources such<br />
as inventory<br />
2) Contigency plan for backup<br />
Move to Prent, Alga, and<br />
Computer Design.<br />
Risk Report<br />
(Supplier <strong>View</strong>)<br />
Rev Impact (MM)<br />
Risk Factor Change<br />
Risk Probability Index RPI Risk Index RI<br />
Prev Cur Change Prev Cur Change Prev Cur Change Prev Cur Prev Change<br />
367.71 367.71 0 14.32 14.32 0.00 1.9 1.9 0 100.02 100.02 16.77% 0.00%<br />
170.29 0 -170.29 20.31 0 -20.31 3.0 0.0 -3 103.75 0.00 17.39% 100.00%<br />
SRIM<br />
SRIM% Change<br />
Perfecseal<br />
Alga<br />
TEK<br />
AIP<br />
460.34 6<br />
200.61 9<br />
165.47 9<br />
78.99 1<br />
No survey response Get survey response 109.13 109.13 0 38.00 38.00 0.00 4.3 4.3 0 178.32 178.32 29.90% 0.00%<br />
1) Low BSC business & pr<strong>of</strong>it<br />
margin/Alga revenue 2) No<br />
regular information sharing with<br />
tier II suppliers 3) High MRR<br />
1) Consolidate other therm<strong>of</strong>orm<br />
business to Alga 2) Help<br />
develop regular information<br />
sharing system with tier II<br />
suppliers 3) Quality audit<br />
44.98 130.00 85.02 17.76 17.76 0.00 2.5 2.5 0 19.98 57.73 3.35% -189.02%<br />
1) Low BSC busines/TEK 1) Consolidate other therm<strong>of</strong>orm<br />
revenue 2) Cost structure is not business to Alga 2) Negotiate 18.59 77.10 58.51 16.89 16.89 0.00 2.4 2.4 0 7.54 31.25 1.26% -314.74%<br />
shared<br />
for cost structure<br />
1) Overall interest alignment is<br />
low 2) Slow response to<br />
technical problem 3) Low<br />
engineer support 4) Small<br />
employee size 5) No regular<br />
Consolidated to other vendors 23.25 50.00 26.75 22.07 22.07 0.00 3.0 3.0 0 15.40 33.11 2.58% -115.05%<br />
information sharing with tier II<br />
suppliers 6) Low market<br />
bargain power<br />
1029.72 1029.71 23.48 21.79 3.0 2.8 -0.25<br />
596.48 571.92 4.12%<br />
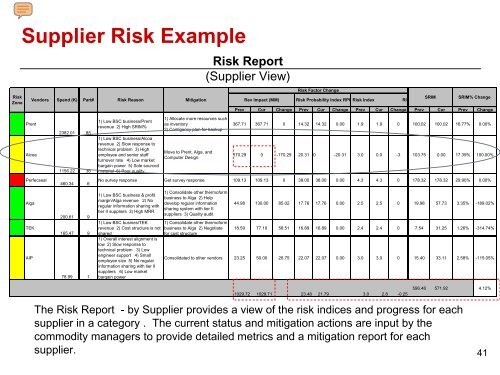
The Risk Report - by Supplier provides a view <strong>of</strong> the risk indices and progress for each<br />
supplier in a category . The current status and mitigation actions are input by the<br />
commodity managers to provide detailed metrics and a mitigation report for each<br />
supplier.<br />
41