View presentation (PDF) - Department of Supply Chain Management
View presentation (PDF) - Department of Supply Chain Management
View presentation (PDF) - Department of Supply Chain Management

Create successful ePaper yourself
Turn your PDF publications into a flip-book with our unique Google optimized e-Paper software.
The Value <strong>of</strong> <strong>Supply</strong> Strategy
Fact: Vertical & Horizontal Disconnection <strong>of</strong> SCM<br />
Organizations<br />
Customer<br />
Disconnection <strong>of</strong><br />
External Market<br />
Intelligence<br />
Manufacturing<br />
SCM Organization<br />
Marketing & Sales<br />
Disconnection <strong>of</strong><br />
Internal Business<br />
Intelligence<br />
Supplier<br />
Loss <strong>of</strong> Innovation and Efficiency Improvement Possibilities<br />
-> Connection <strong>of</strong> Market Intelligence has to be a <strong>Supply</strong> <strong>Chain</strong> <strong>Management</strong><br />
Driven Approach: CUSTOMER AND SUPPLIER FACING<br />
2
Traditional Focus is Here<br />
Company’s Environment<br />
Suppliers’ Environment<br />
Customers’ Environment<br />
Suppliers<br />
Supplier and<br />
Market Intelligence<br />
PBUs<br />
Customer and<br />
Market Intelligence<br />
Customers<br />
A GUESSING GAME<br />
Business Intelligence<br />
<strong>Supply</strong> <strong>Chain</strong> Intelligence is the convergence <strong>of</strong> four activities (information gathering,<br />
analysis, dissemination and response) both upstream and downstream in the supply chain.<br />
3
SCM Enablers - Data, Information, Knowledge<br />
SCM Processes<br />
<strong>Supply</strong> <strong>Chain</strong> Design, Supplier Rel. Mgmt, Perf. Mgmt,<br />
Supplier Quality Mgmt, Risk Mgmt, Cont. Improvement<br />
KNOWLEDGE<br />
BI/MI Enabling SCM Processes<br />
Gather, Analyze, & Synthesize<br />
Data & Information<br />
INFORMATION<br />
Business Intelligence<br />
Spend<br />
Demand<br />
Performance<br />
Finance<br />
Quality<br />
Market Intelligence<br />
Markets<br />
Industries<br />
Goods & Commodities<br />
Finance<br />
Suppliers<br />
Competitors<br />
Technologies<br />
DATA<br />
4
Business Intelligence Impact<br />
Supplier<br />
Relationship<br />
<strong>Management</strong><br />
Total Cost <strong>of</strong><br />
Ownership<br />
Competitive<br />
Analysis<br />
Risk<br />
<strong>Management</strong><br />
<strong>Supply</strong><br />
Continuity<br />
Market Drivers<br />
Enhanced<br />
Negotiations<br />
Internal<br />
Drivers<br />
Value <strong>Chain</strong><br />
News Analysis<br />
5
Strategic Sourcing Process<br />
Phase I Phase II Phase III Phase IV Phase V Phase VI Phase VII<br />
Business<br />
Plan<br />
Process<br />
Plan<br />
Data<br />
Acquisition<br />
Evaluation<br />
Supplier<br />
Selection &<br />
Development<br />
Implement<br />
Performance<br />
Measurement<br />
& Continuous<br />
Improvement<br />
• Business Case<br />
• Spend / Gap<br />
• Team<br />
• Charter<br />
• Key stakeholder<br />
• Communication<br />
• Baseline<br />
• Segmentation<br />
• Work Plan<br />
• Update Charter<br />
• Communication<br />
• Current state<br />
• Hypothesis<br />
• Vision<br />
• Industry<br />
• Competition<br />
• Potential supplier<br />
• Benchmark<br />
• Narrow supplier<br />
• Begin strategy<br />
formulation<br />
• Benefits<br />
• Cost model<br />
• Barriers<br />
• RFP<br />
• Negotiation<br />
strategy<br />
• Selection<br />
• Corrective<br />
action/<br />
development<br />
• Update strategy<br />
• Implementation<br />
• Identify team<br />
• Coordination<br />
• Integrate<br />
suppliers<br />
• Performance<br />
measurement<br />
• Corrective<br />
actions<br />
• Manage<br />
relationship<br />
& performance<br />
• Communicate<br />
• Cont.<br />
Improvement<br />
• Follow-up<br />
• Approved Charter<br />
• Project Progress Report<br />
• Timeline<br />
• Hypothesis<br />
• Strategy Pr<strong>of</strong>ile<br />
• Updated Pr<strong>of</strong>ile<br />
• TAC Benefits/Cost models<br />
• Supplier(s) Selected<br />
• Development /<br />
Implementation Plans<br />
• Implementation status<br />
• Progress Report<br />
• Manage supplier<br />
relationship<br />
• Communicate<br />
performance to supplier<br />
Improvement plans
Strategic Sourcing follows a rigorous 7-step process;<br />
activities in each step are tailored to the nature <strong>of</strong> the<br />
commodity and the supply market<br />
Pr<strong>of</strong>ile<br />
Sourcing<br />
Group<br />
Develop<br />
Sourcing<br />
Strategy<br />
Generate<br />
Supplier<br />
Portfolio<br />
Select<br />
Implementation<br />
Path<br />
Select<br />
Competitive<br />
Suppliers<br />
Operationally<br />
Integrate<br />
Suppliers<br />
1 2 3 4 5 6 7<br />
Continuous<br />
Benchmark<br />
<strong>Supply</strong> Market<br />
Understand<br />
internal spend and<br />
external market<br />
Create ‘Go to<br />
Market’ approach<br />
Identify potential<br />
suppliers<br />
Determine<br />
execution strategy<br />
Conduct<br />
negotiations &<br />
select suppliers<br />
Operationalize<br />
supplier<br />
agreements<br />
Operationalize<br />
supplier<br />
agreements<br />
Activities<br />
• Identify & • Assess current<br />
understand current<br />
spend/buy<br />
• Conduct industry<br />
analysis<br />
Example<br />
Deliverables<br />
sourcing practices<br />
• Analyze potential<br />
sourcing strategies<br />
• Review savings<br />
estimates<br />
• Identify new<br />
suppliers<br />
• Generate potential<br />
supplier list<br />
• Create and issue<br />
RFI<br />
• Finalize project plan• Develop<br />
qualification<br />
criteria<br />
• Screen suppliers<br />
• Select competitive<br />
selection or supplier<br />
development<br />
• Determine<br />
negotiation<br />
approaches<br />
• Develop RFP<br />
execution strategy<br />
• Develop RFP<br />
evaluation criteria<br />
• Issue RFP<br />
• Analyze RPF<br />
responses<br />
• Develop<br />
negotiation<br />
strategy<br />
• Conduct<br />
negotiations<br />
• Recommend<br />
suppliers<br />
• Finalize contracts • Develop process to<br />
• Determine<br />
benchmark supply base<br />
implementation • Develop process to<br />
implications monitor Industry<br />
• Create<br />
conditions<br />
implementation plan<br />
• Executive<br />
implementation plan<br />
• Internal spend<br />
analysis<br />
• Category<br />
positioning matrix<br />
• Industry overview • Sourcing strategy<br />
& market summary<br />
dynamics<br />
• RFI template<br />
• Qualification<br />
criteria<br />
• List <strong>of</strong> suppliers<br />
• Short list <strong>of</strong> RFP<br />
• RFP Template<br />
• RFP plan<br />
• Auction plan<br />
• RFP analysis<br />
model<br />
• Negotiation<br />
strategy template<br />
• Auction strategy<br />
• Sourcing<br />
recommendation<br />
• Implementation<br />
plan<br />
• Ongoing category<br />
review process<br />
• Supplier report card
Operating Model<br />
Operating Model is being changed to strike the right balance between<br />
Centrally led and Product led<br />
Mission<br />
Key Activities<br />
<br />
Category Planning<br />
Centrally-Led<br />
<br />
Provide governance, lead developing <strong>of</strong><br />
people, drive category planning, manage the<br />
supply base and ensure link and leverage<br />
<br />
<br />
<br />
Cost <strong>Management</strong><br />
Supplier Quality and Development (Strategy)<br />
Process and Support<br />
<br />
Indirect Material and M&E Purchasing<br />
<br />
Logistics<br />
<br />
People Development<br />
Product Led<br />
<br />
Execute category plans, conduct<br />
sourcing transactions, work closely with<br />
suppliers to ensure progress against<br />
development plan, drive supplier quality,<br />
and coordinate / ensure delivery <strong>of</strong><br />
purchased materials on-time, at the right<br />
cost and quality<br />
<br />
<br />
<br />
<br />
Business and Product Line Support (TDP, ADP,<br />
PDP)<br />
Production Support<br />
Supplier Quality (Execution)<br />
Category Planning (Product-led)
Global Enterprise Category Team Operational<br />
Concept<br />
The Commercial and Engineering<br />
team is responsible for finding<br />
Innovation in the supply base that<br />
the Company can leverage:<br />
Competitive advantage on current<br />
business<br />
Fill technology gaps in current<br />
technology portfolio<br />
Provide Innovative Solutions for<br />
future customer needs<br />
Concise Commercial and Technical<br />
Strategy for each Category
Strategy and Execution are Related<br />
“Strategy without tactics is the slowest route to victory.<br />
Tactics without strategy is the noise before defeat.”<br />
- Sun Tzu<br />
Goals Strategies Plans Objectives Tactics<br />
• Corporate<br />
financial<br />
targets and<br />
• President’s<br />
directives<br />
Company<br />
strategies<br />
Category plans<br />
Sub-Category<br />
plans<br />
Supplier plans<br />
PBU-Level<br />
Category plans<br />
Supplier<br />
classification<br />
Targeted<br />
achievement<br />
plans<br />
(Example: 60%<br />
best cost in<br />
region; 70%<br />
reduction in<br />
number <strong>of</strong><br />
suppliers, etc.)<br />
Sourcing<br />
strategies<br />
Sourcing<br />
decisions<br />
Category team<br />
and PBU-level<br />
agreed upon<br />
actions and<br />
timing<br />
Supplier<br />
management
Category Plan Development Future State Map<br />
1.0 Compile/ Document Data 2.0 Develop Strategies 3.0 Approve Strategies<br />
1.1 Compile<br />
Industry /<br />
Market Info<br />
Reports/shows<br />
journals/internet<br />
/interviews/<br />
consultants / etc<br />
1.6 Create /<br />
Refine /<br />
Publish<br />
Industry<br />
Category<br />
Overview<br />
Category Strategies<br />
Home Repository<br />
Company Stakeholders<br />
PBUs (buyer)<br />
New<br />
Information<br />
Changing<br />
Conditions<br />
Scheduled<br />
Review<br />
1.2 Compile<br />
Category<br />
Technical<br />
Information (Eye<br />
Of the Needle<br />
Process)<br />
1.3 Compile the<br />
Total Cost &<br />
Cost<br />
<strong>Management</strong><br />
Information<br />
1.4 Compile<br />
Supplier Data<br />
Business info / FTS / quality /<br />
technology / Category, MCA &<br />
Commercial Assessments /<br />
Customer Specific<br />
Requirements<br />
1.5 Compile<br />
Current<br />
Company APV<br />
Data<br />
APV data from<br />
Portfolios<br />
QVC gates<br />
needed?<br />
1.7Create /<br />
Refine /<br />
Publish<br />
Company<br />
Category<br />
Overview<br />
1.8 Gather<br />
Key Product<br />
Line Business<br />
& Technical<br />
Information<br />
via meeting or<br />
discussion<br />
Priority matrix<br />
determines<br />
ECT/PBU/PL<br />
engagement level<br />
Formalize input<br />
Action items / PL info<br />
SharePoint Document Library<br />
(documents & Action Items)<br />
2.3 Create /<br />
Refine<br />
2.3 Create<br />
/<br />
/<br />
Document<br />
Refine<br />
2.3 Create<br />
/<br />
/<br />
Supplier<br />
Document<br />
Refine /<br />
Strategies<br />
Supplier<br />
Document<br />
Strategies<br />
Supplier<br />
Strategies<br />
2.1/2.2 Create / Refine<br />
/ Document<br />
2.1/2.2 Create<br />
Product<br />
/ Refine<br />
Line/PBU<br />
/ Document<br />
2.1/2.2 Create<br />
Strategies<br />
Product<br />
/ Refine<br />
/<br />
Material<br />
Line/PBU<br />
/ Document<br />
Group<br />
Strategies<br />
Product<br />
Code /<br />
/<br />
Sub-category<br />
Material<br />
Line/PBU<br />
Group<br />
/ Material<br />
Code /<br />
Sub-category<br />
Group Code / Subcategory<br />
Strategies<br />
Q<br />
1. Leverage considered?<br />
2. All inputs (ECT & PL),<br />
including action<br />
items, available?<br />
2.1-2..3 are completed based on specific need or request<br />
Pipeline<br />
2.4 Create /<br />
Refine/<br />
Correlate<br />
Specific<br />
Sourcing<br />
Strategies<br />
Strategic leverage<br />
Assess (1) strategy<br />
alignment across PL<br />
& Categories; (2)<br />
total cost impact;<br />
and (3) leverage<br />
opportunities<br />
3.1 PBU /ECT<br />
Documented<br />
Approval <strong>of</strong><br />
Sourcing<br />
Strategies<br />
How to<br />
document<br />
approval in<br />
system?<br />
Metrics – How to measure<br />
leverage to ensure the<br />
behavior occurs?<br />
Q<br />
11
Each Process is Integral to the Next<br />
Process<br />
Inputs<br />
Outputs<br />
Category Market Analysis<br />
• Suppliers Capability<br />
• Demand and <strong>Supply</strong><br />
trends<br />
• Individual Supplier Analysis<br />
• Market Analysis<br />
• Priorities for Strategic Costing<br />
Strategic Cost Modeling<br />
• Mapping <strong>of</strong> <strong>Supply</strong> <strong>Chain</strong><br />
• Raw Material/conversion<br />
costs<br />
• Commodity “Should Cost”<br />
• Relevant Price benchmarks<br />
Commodity Price Analysis<br />
• Market Prices<br />
• Internal Costs<br />
• Performance Analysis<br />
• Benchmarks for Planning<br />
• Risk Analysis for category<br />
Market Index Planning and<br />
Reports<br />
• Market Trends<br />
• Cost Escalations for category<br />
• Executive Summary<br />
12
The main outputs drive category strategies …<br />
Cost Models<br />
Market Analysis<br />
• Labor Cost Models:<br />
• Industry cost models-any occupation &<br />
location<br />
• Supplier specific cost models<br />
• Product Cost Models<br />
• High level product cost models<br />
• Deep dive product cost models<br />
• Market Analysis can include:<br />
• External Market Conditions/Trends<br />
• Supplier Deep Dives<br />
• Supplier Financial Health Analysis<br />
• Market Prices/Trends<br />
• Recommendations on suppliers based on our<br />
analyses<br />
13
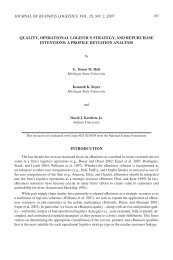
Michigan State U. Benchmarking Study: Impact <strong>of</strong><br />
Strategic Category <strong>Management</strong><br />
• Cost savings<br />
• 5 to 15% price/cost savings<br />
• More uniform prices between regions<br />
– One company reported 20% to 30% price<br />
differences between locations<br />
– Another company reported a reduction in the gap <strong>of</strong><br />
10%<br />
14
Michigan State U. Benchmarking Study: Impact <strong>of</strong><br />
Strategic Category <strong>Management</strong><br />
• Other savings<br />
• Reduction <strong>of</strong> logistics cost from 3% to 2% <strong>of</strong> cost <strong>of</strong> sales.<br />
• Lower operating costs <strong>of</strong> up to 15%<br />
• Improved quality – typically from 10 to 20% <strong>of</strong> yield<br />
• Inventory reduction from 15% to 30%<br />
• Improved on time delivery to 20%<br />
• Reduced lead times by 20%<br />
• Improved productivity – 4 to 20%<br />
• Improved communication between functions<br />
• Enhanced strategic role <strong>of</strong> procurement<br />
• Development <strong>of</strong> a learning organization<br />
15
Gathering Data
There are many sources <strong>of</strong> market and supplier<br />
information<br />
Trade Journals &<br />
Periodicals<br />
Company Annual<br />
Reports & 10-Ks<br />
Internet<br />
PBU leaders,<br />
PLPMs,<br />
colleagues<br />
Consultants and<br />
Research<br />
Providers<br />
Industry<br />
Associations<br />
Headlines<br />
Suppliers<br />
17
1.0 Compile/Document Data<br />
• Typical Data<br />
• Industry Category Overview<br />
• Description <strong>of</strong> the Category<br />
• Total Market Value<br />
• Major Applications<br />
• Product Segmentation<br />
• Cost <strong>Management</strong> Practices<br />
• Industry Efforts and Initiatives<br />
• Breakdown by Major Supplier/Product<br />
• Industry Structure and Global Reach<br />
18
Choosing Analysis Tools
Theorists Approach – Linear<br />
Collect<br />
Data<br />
Conduct<br />
Analysis<br />
Create<br />
Strategy<br />
20
Best Practices Approach<br />
Gather<br />
Data<br />
Develop<br />
Hypotheses<br />
Test Hypothesis<br />
Engage Resources<br />
Develop and<br />
Refine Strategy<br />
Test Hypothesis<br />
Conduct Analysis<br />
21
Sample Hypotheses<br />
• Resin costs should drop as the cost <strong>of</strong> oil<br />
drops.<br />
• Our business case for harness providers is<br />
not sustainable.
Market Analysis Tools<br />
• Converting Data into Insight<br />
– Supplier Analysis<br />
– SWOT (Strength, Weakness, Opportunity, Threat)<br />
– Value <strong>Chain</strong><br />
– Risk Analysis<br />
– Porter’s Five Forces<br />
23
Supplier Analysis<br />
• Data needed to make the tool work<br />
• Company APV<br />
• Current relationships<br />
• Knowledge <strong>of</strong> industry players<br />
• Supplier customer base<br />
• Annual revenue <strong>of</strong> suppliers<br />
• Competitors and competitive position<br />
• Where do you get the data<br />
• Suppliers<br />
• Internal Company<br />
• PBU partners<br />
• Internet<br />
• Industry associations<br />
• Trade publications<br />
• Consultants & research providers<br />
24
Supplier Analysis<br />
• What the tool provides<br />
• Cost structure<br />
• Financial status<br />
• Customer satisfaction levels<br />
• Support Capabilities<br />
• Relative strengths and weakness<br />
• How Company fits in their business<br />
• How Company is viewed<br />
• Core capabilities<br />
• Strategy/future direction<br />
• Culture<br />
• …The list goes on as the journey proceeds<br />
• When do you use it<br />
• Continuous, on-going process<br />
25
SWOT Analysis<br />
• Data needed to make the tool work<br />
• Can provide insight even with limited data (Often a good way to figure out what data<br />
you have and where there are gaps.)<br />
• Where do you get the data from<br />
• Any <strong>of</strong> the sources mentioned so far<br />
• Often a good tool for a dialogue<br />
• What the tool provides<br />
• A quick sketch <strong>of</strong> where you stand<br />
• A preliminary call to action<br />
• Quick picture <strong>of</strong> circumstances<br />
• When to apply<br />
• Analysis <strong>of</strong> individual divisions<br />
• Analysis <strong>of</strong> individual suppliers<br />
• Market situation<br />
26
SWOT Analysis<br />
• Broad customer base<br />
• Established product<br />
range<br />
• Established<br />
distribution<br />
channels<br />
Strengths<br />
Internal<br />
Factors<br />
Weaknesses<br />
• Low product<br />
innovation<br />
• Traditional, unionised<br />
business processes<br />
• Low patent protection<br />
• Emergence <strong>of</strong> other<br />
uses and markets<br />
for products<br />
• Emerging overseas<br />
markets<br />
• High barriers to<br />
entry<br />
Opportunities<br />
External<br />
Factors<br />
Threats<br />
• Emerging overseas<br />
suppliers<br />
• New product<br />
development<br />
costs are high<br />
• Environmental<br />
regulations<br />
27
Value <strong>Chain</strong> Analysis<br />
• Data needed to make the tool work<br />
• Steps in the process <strong>of</strong> creating a product<br />
• Steps in product sales and/or distribution<br />
• Technology involved<br />
• “Dirt to the suppliers door”<br />
• Where do you get the data<br />
• Associations<br />
• Internet<br />
• Industry research<br />
• Engineering books<br />
• What the tool provides<br />
• Understanding <strong>of</strong> supplier cost structure<br />
• Understanding <strong>of</strong> how suppliers add value<br />
• Idea <strong>of</strong> where you want to participate<br />
• Benchmarks for value<br />
• Ability to better predict pricing<br />
• Bottle-necks that can constrain availability<br />
• When to apply<br />
• When you think there are steps that can be cut<br />
• Generally works best when everyone in your supply base has a similar value chain (e.g.<br />
commodities)<br />
28
Sample Value <strong>Chain</strong> Analysis<br />
Material<br />
Sourcing<br />
Resin<br />
Production<br />
Film<br />
Extrusion<br />
Conversion<br />
Raw<br />
Materials<br />
Natural Gas<br />
Petroleum<br />
Coal<br />
Refining<br />
Basic<br />
compounds<br />
extracted and<br />
converted to<br />
feed stocks<br />
Feedstocks<br />
Monomers<br />
(small<br />
molecules)<br />
Polymerization<br />
Small molecules<br />
linked together<br />
Polymers<br />
Resins<br />
(giant<br />
molecules)<br />
Manufacturing<br />
(film production)<br />
Finished<br />
Product<br />
Distributor<br />
End-User<br />
Source: The Society <strong>of</strong> the Plastics Industry, Inc. and <strong>Management</strong> Horizons, A Consulting Division <strong>of</strong> PricewaterhouseCoopers LLP.<br />
29
Suppliers’ Cost Elements<br />
• Looking further into the value chain and analyzing the market, we can<br />
understand the high level cost structure and cost drivers<br />
Raw<br />
materials<br />
Suppliers<br />
manufacture<br />
components<br />
Supplier<br />
sources<br />
components<br />
Assembly<br />
Storage &<br />
distribution<br />
Sales<br />
10% 20% 15% 10% 15% 30%<br />
100%<br />
COST<br />
• Typical cost drivers are:<br />
• Raw material availability and costs<br />
• Degree <strong>of</strong> product customization<br />
• Research and Development<br />
• Yield<br />
• Supplier high pr<strong>of</strong>it margins<br />
• Complex distribution network<br />
• Scale<br />
30
Our Challenge – Defining Categories<br />
• Categories Definitions Drive<br />
• Priorities<br />
• Availability <strong>of</strong> data<br />
• Supplier communications<br />
• PBU expectations<br />
• Validity <strong>of</strong> analyses<br />
• <strong>View</strong> <strong>of</strong> current state<br />
• <strong>View</strong> <strong>of</strong> future possibilities<br />
31
Inputs<br />
• Supplier analyses<br />
• Value chain analysis<br />
• Industry definitions<br />
• Material group codes<br />
• Stakeholder expectations/standards<br />
• PBU<br />
• Eye <strong>of</strong> the Needle<br />
• Cost<br />
32
Look for Patterns<br />
Characteristics <strong>of</strong> Suppliers that<br />
“Fit” within a Market Segment<br />
• Similar<br />
production<br />
process<br />
• Similar<br />
Technology<br />
Key Question:<br />
At what level do we define<br />
the market?<br />
Where does<br />
the team have<br />
maximum<br />
bargaining<br />
power?<br />
• Similar supplier<br />
sources<br />
• Similar<br />
<strong>Supply</strong> chain<br />
Office<br />
Supplies<br />
• Similar material<br />
content/<br />
complexity<br />
• Similar product<br />
specifications<br />
• Similar<br />
Internal<br />
value chain<br />
• Similar<br />
Customers<br />
and markets<br />
Copy<br />
Paper<br />
Paper<br />
Legal<br />
Pads<br />
Pens<br />
Writing<br />
Utensils<br />
Pencils<br />
Increasing<br />
Bargaining<br />
Power<br />
33
Risk Analysis<br />
• Data needed to make the tool work<br />
• The impact <strong>of</strong> certain products on Company<br />
• Major suppliers in the industry<br />
• Typical failure points<br />
• Where do you get the data<br />
• PBU<br />
• Cost<br />
• Eye <strong>of</strong> the needle team<br />
• Buyers<br />
• What the tool provides<br />
• Cost/benefit <strong>of</strong> risk mitigation strategies<br />
• Call to action to change the status quo<br />
• When to apply<br />
• You suspect there are hidden risks<br />
• Stakeholders do not recognize risk<br />
34
Common Areas <strong>of</strong> Risk<br />
• Product quality/service<br />
• <strong>Supply</strong> continuity<br />
• Technology dependency<br />
• Supplier dependency<br />
• Currency exchange fluctuation<br />
• Business cycle<br />
• Political<br />
• Geographic<br />
Business Risks<br />
• Intellectual Property<br />
• Plant downtime<br />
• Yield<br />
Operational Risks<br />
• Regulatory compliance<br />
• Health & safety<br />
• Environmental<br />
35
Operational Risk Assessment Example<br />
36
Supplier Risk Example<br />
The following slides will show<br />
how the mitigation process<br />
works. Specifically:<br />
Risk Distribution Matrix – by Supplier<br />
• Supplier Identification<br />
• Effects <strong>of</strong> Mitigation<br />
• Reduction in Risk<br />
In the example case, there<br />
are several suppliers in the<br />
yellow and red zones.<br />
The example will follow<br />
“Alcoa” – currently in the<br />
yellow zone, with medium<br />
RPI and medium revenue<br />
impact.<br />
Revenue Impact<br />
Risk Probability Index (RPI)<br />
37
Supplier Risk Example<br />
The Bar Chart report<br />
shows the supplier risk<br />
index rankings within<br />
the group. The color<br />
coded zones help<br />
direct the priorities for<br />
mitigation activities..<br />
Alcoa is in the yellow<br />
zone indicating<br />
medium or long term<br />
mitigation action.<br />
38
Risk Reduction by Shifting <strong>Supply</strong><br />
from High to Lower Risk Suppliers<br />
Action:<br />
Shift supply from Alcoa to Alga, Tek, and<br />
AIP Therm<strong>of</strong>orm<br />
Result:<br />
Significantly reducing the disruption risk <strong>of</strong><br />
$170 million in revenue impact from an RPI<br />
<strong>of</strong> 20.3 to 18.9 (-1.4%).<br />
40
Risk<br />
Zone<br />
Supplier Risk Example<br />
Prent<br />
Vendors Spend (K) Part#<br />
Risk Reason Mitigation<br />
Alcoa<br />
2382.01 85<br />
1156.22 36<br />
1) Low BSC business/Prent<br />
revenue 2) High SRIM%<br />
1) Low BSC business/Alcoa<br />
revenue 2) Slow response to<br />
technical problem 3) High<br />
employee and senior staff<br />
turnover rate 4) Low market<br />
bargain power 5) Sole sourced<br />
material 6) Poor quality<br />
1) Allocate more resources such<br />
as inventory<br />
2) Contigency plan for backup<br />
Move to Prent, Alga, and<br />
Computer Design.<br />
Risk Report<br />
(Supplier <strong>View</strong>)<br />
Rev Impact (MM)<br />
Risk Factor Change<br />
Risk Probability Index RPI Risk Index RI<br />
Prev Cur Change Prev Cur Change Prev Cur Change Prev Cur Prev Change<br />
367.71 367.71 0 14.32 14.32 0.00 1.9 1.9 0 100.02 100.02 16.77% 0.00%<br />
170.29 0 -170.29 20.31 0 -20.31 3.0 0.0 -3 103.75 0.00 17.39% 100.00%<br />
SRIM<br />
SRIM% Change<br />
Perfecseal<br />
Alga<br />
TEK<br />
AIP<br />
460.34 6<br />
200.61 9<br />
165.47 9<br />
78.99 1<br />
No survey response Get survey response 109.13 109.13 0 38.00 38.00 0.00 4.3 4.3 0 178.32 178.32 29.90% 0.00%<br />
1) Low BSC business & pr<strong>of</strong>it<br />
margin/Alga revenue 2) No<br />
regular information sharing with<br />
tier II suppliers 3) High MRR<br />
1) Consolidate other therm<strong>of</strong>orm<br />
business to Alga 2) Help<br />
develop regular information<br />
sharing system with tier II<br />
suppliers 3) Quality audit<br />
44.98 130.00 85.02 17.76 17.76 0.00 2.5 2.5 0 19.98 57.73 3.35% -189.02%<br />
1) Low BSC busines/TEK 1) Consolidate other therm<strong>of</strong>orm<br />
revenue 2) Cost structure is not business to Alga 2) Negotiate 18.59 77.10 58.51 16.89 16.89 0.00 2.4 2.4 0 7.54 31.25 1.26% -314.74%<br />
shared<br />
for cost structure<br />
1) Overall interest alignment is<br />
low 2) Slow response to<br />
technical problem 3) Low<br />
engineer support 4) Small<br />
employee size 5) No regular<br />
Consolidated to other vendors 23.25 50.00 26.75 22.07 22.07 0.00 3.0 3.0 0 15.40 33.11 2.58% -115.05%<br />
information sharing with tier II<br />
suppliers 6) Low market<br />
bargain power<br />
1029.72 1029.71 23.48 21.79 3.0 2.8 -0.25<br />
596.48 571.92 4.12%<br />
The Risk Report - by Supplier provides a view <strong>of</strong> the risk indices and progress for each<br />
supplier in a category . The current status and mitigation actions are input by the<br />
commodity managers to provide detailed metrics and a mitigation report for each<br />
supplier.<br />
41
Porter’s Five Forces Model<br />
• Data needed to make the tool work<br />
• Major players in the industry<br />
• Financial conditions <strong>of</strong> the players<br />
• Threats to the industry<br />
• Where do you get the data<br />
• Publicly available financial data<br />
• i<strong>Supply</strong> iAlert<br />
• Industry overviews<br />
• Investor industry analysis reports<br />
• What the tool provides<br />
• long-term picture <strong>of</strong> the industry<br />
• Broad perspective<br />
• Competition for demand<br />
• Where do we have leverage<br />
• When do you use it<br />
• Stakeholders are overly focused on short-term<br />
• Stakeholders have unrealistic expectations about supplier behavior<br />
• Predict degree <strong>of</strong> supplier flexibility<br />
• Understand competitive threats they face and where you can add value<br />
42
Porter’s Five Forces Analysis<br />
Threat <strong>of</strong> New<br />
Entrants<br />
Supplier<br />
Bargaining<br />
Power<br />
Market<br />
Internal<br />
Competition<br />
Buyer Bargaining<br />
Power<br />
Pressure from<br />
Substitutes<br />
Source: Competitive Strategy, Michael E.<br />
Porter, 1980<br />
As a variation <strong>of</strong> the Porter’s framework, additional forces are sometimes examined.<br />
These are “globalization,” “digitization,” and “de-regulation.”<br />
43
Porter’s Five Forces –<br />
Supplier Bargaining Power<br />
Factors Influencing Suppliers’<br />
Bargaining Power<br />
• Prices <strong>of</strong> major inputs<br />
• Ability to pass on price increases<br />
• Availability <strong>of</strong> key technologies or other resources<br />
• Threat <strong>of</strong> forward or backward integration<br />
• Industry capacity utilization<br />
• Supplier concentration<br />
• Importance <strong>of</strong> volume to supplier<br />
Implications: Suppliers may not <strong>of</strong>fer better pricing if they<br />
are captive to their suppliers or are squeezed by their<br />
position in the value chain and there may be an<br />
opportunity to buy at a different point in the value chain.<br />
44
Criticality to Buyers<br />
• The concentration <strong>of</strong> purchase volumes in a<br />
market defines the relative strength and<br />
negotiating power <strong>of</strong> the buyers.<br />
• The buyers’ ability to influence the market demand<br />
is directly proportional to their ability to influence<br />
suppliers behaviors.<br />
• The more critical the item being purchased, the<br />
lower the buyer’s negotiating power<br />
45
Criticality to Buyers<br />
Factors Influencing the Buyers’<br />
Bargaining Power<br />
• Buyer concentration<br />
• Buyer volume<br />
• Buyer switching costs<br />
• Price sensitivity<br />
• Product differences<br />
• Brand identity<br />
• Impact on quality or performance<br />
• Buyer pr<strong>of</strong>its<br />
• Availability <strong>of</strong> substitutes<br />
$<br />
$<br />
Strong<br />
A few buyers purchase<br />
most <strong>of</strong> suppliers’ output.<br />
Weak<br />
Suppliers have many<br />
buyers to choose from.<br />
Characteristics <strong>of</strong> Critical Items<br />
Characteristics <strong>of</strong> Non-Critical Items<br />
Product is in short supply<br />
Client’s purchasing volume is small<br />
relative to most other customers<br />
Product is a large portion <strong>of</strong> the<br />
overall cost<br />
Product is purchased in large volume<br />
compared to other customers<br />
Product is undifferentiated<br />
Backward integration is possible<br />
46
Porter’s Five Forces –<br />
Threat <strong>of</strong> New Entrants<br />
Factors Influencing the Threat<br />
<strong>of</strong> New Entrants<br />
• Capital markets<br />
• Availability <strong>of</strong> skilled workers<br />
• Access to critical technologies, inputs or distribution<br />
• Product life cycles<br />
• Brand equity/customer loyalty<br />
• Government deregulation<br />
• Risk <strong>of</strong> switching<br />
• Economies <strong>of</strong> scale<br />
Implications: Suppliers may be eager to <strong>of</strong>fer improved terms<br />
to keep new companies from entering the market and new<br />
market entrants may <strong>of</strong>fer improved terms to gain a foothold.<br />
47
Porter’s Five Forces –<br />
Threat <strong>of</strong> Substitutes<br />
• The threat or availability <strong>of</strong> alternate products in a<br />
market also affects the relative strength and<br />
influence the buyer can exert.<br />
• Possibility <strong>of</strong> a switch to a substitute increases<br />
options and leverage<br />
48
Porter’s Five Forces –<br />
Threat <strong>of</strong> Substitutes<br />
EXAMPLE<br />
Original<br />
Product/Service<br />
• Paper grocery sacks<br />
• Airline travel<br />
• Printed forms<br />
• Steel pipe<br />
• Electricity<br />
• Grocery stores<br />
Substitute<br />
Product/Service<br />
• Plastic grocery sacks<br />
• Video conferencing<br />
• Electronic forms<br />
• PVC pipe<br />
• Co-generated power<br />
• Internet<br />
Factors Influencing the Threat<br />
<strong>of</strong> Substitutes<br />
• relative performance <strong>of</strong> substitutes<br />
• relative price <strong>of</strong> substitutes<br />
• switching costs<br />
• buyer propensity to substitute<br />
49
Internal Competition<br />
• Higher levels <strong>of</strong> internal competition increase<br />
buyer options and supplier flexibility.<br />
Factors Influencing the Market<br />
Internal Competition<br />
• Speed <strong>of</strong> industry growth<br />
• Capacity utilization<br />
• Exit barriers<br />
• Product differences<br />
• Switching costs<br />
• Diversity <strong>of</strong> competitors<br />
50
Internal Competition<br />
Numerous<br />
Competitors<br />
Excess Capacity<br />
High Fixed Costs<br />
High Exit<br />
Barriers<br />
Perishable<br />
Products<br />
Negotiating<br />
Strength<br />
Suppliers may be eager to <strong>of</strong>fer<br />
improved terms not to lose their<br />
volume and revenue to their<br />
competition<br />
51
Balance <strong>of</strong> Power as Input to <strong>Supply</strong> Strategy<br />
Sourcing Implication<br />
Suppliers Hold the<br />
Balance <strong>of</strong> Power<br />
H<br />
L<br />
Entry Barriers<br />
L<br />
Threat <strong>of</strong> Substitutes<br />
Impact <strong>of</strong> Inputs<br />
H<br />
H<br />
L<br />
Criticality to Customers<br />
H<br />
L<br />
Market Competition<br />
L<br />
H<br />
Buyers Hold the<br />
Balance <strong>of</strong> Power<br />
Source: Competitive Strategy, Michael E. Porter, 1980<br />
52
Summarizing the Market Analysis<br />
Risk Analysis<br />
Supplier<br />
Analysis<br />
Value<br />
<strong>Chain</strong><br />
SWOT<br />
S W<br />
O<br />
T<br />
Porter’s<br />
Five-Forces<br />
A Compelling Story—Basis for Strategy<br />
53
Preparing Documentation
Company Templates<br />
• Value <strong>of</strong> documentation<br />
• Establish base lines<br />
• Easy reference<br />
• Basis for dialogues<br />
• Value <strong>of</strong> standardization<br />
• Ease <strong>of</strong> interpretation<br />
• Ease <strong>of</strong> consolidation and trend spotting<br />
• Dangers <strong>of</strong> standardization<br />
• Becomes rote<br />
• May not tell the story you need told<br />
55
Category Name Overview<br />
Owner: Global Enterprise Category Team Manager Name<br />
Approved and<br />
Agreed By<br />
Date <strong>of</strong>...<br />
Approval:<br />
Next review:<br />
CD<br />
08/2006<br />
08/2007<br />
Industry Background<br />
Industry Breakdown<br />
Category Description:<br />
Describe this category and the important characteristics.<br />
Supplier<br />
E, $70 ,<br />
13%<br />
Others,<br />
$20 , 4%<br />
Supplier<br />
A, $254 ,<br />
48%<br />
Seg 5,<br />
$70 , 13%<br />
Others,<br />
$20 , 4%<br />
Seg 1,<br />
$254 ,<br />
48%<br />
Total Market Value:<br />
Supplier<br />
D, $43 ,<br />
8%<br />
Seg 4,<br />
$43 , 8%<br />
Estimate what is the total market value <strong>of</strong> this category globally.<br />
Supplier<br />
C, $26 ,<br />
5%<br />
Seg 3,<br />
$26 , 5%<br />
Major Applications:<br />
Identify the major applications in/<strong>of</strong> this category.<br />
Supplier<br />
B, $118 ,<br />
22%<br />
Seg 2,<br />
$118 ,<br />
22%<br />
Product Segmentation:<br />
What is the product segmenting within this category ? (i.e. Commodity,<br />
Niche, Near Core, Core)<br />
Breakdown by Market Segment<br />
For graphs above: Identify and size the major market segments in this category (e.g., Automotive,<br />
Medical, Consumer, Electrical, Industrial etc.). Identify and describe the major suppliers in this category<br />
and their share <strong>of</strong> the market.<br />
Additional Comments Relative To Major Market Segments / Suppliers<br />
Cost management practices:<br />
Indicate if there is a common cost management practice or methodology<br />
used in the industry.<br />
56
Industry Structure and Global Reach<br />
Barriers to Entry<br />
Supplier Power<br />
Buyer Power<br />
Competitive<br />
Rivalry / Intensity<br />
<strong>of</strong> Competition<br />
Threat <strong>of</strong><br />
Substitution<br />
• Are there economies <strong>of</strong><br />
scale?<br />
• Are the costs high or<br />
low <strong>of</strong> entry?<br />
• What is the ease <strong>of</strong><br />
access to distribution<br />
channels?<br />
• How easy it is for suppliers<br />
to drive up prices?<br />
• How many supplier choices<br />
do you have? The fewer the<br />
supplier<br />
• How easy it is for buyers to<br />
drive prices down?<br />
• How important is each<br />
individual buyer to your<br />
business? How expensive is it<br />
for them to switch from your<br />
products and services to<br />
those <strong>of</strong> someone else?<br />
• What is important here is the<br />
number and capability <strong>of</strong> your<br />
competitors ?<br />
• Will your suppliers and<br />
buyers go elsewhere if they<br />
don’t get a good deal from<br />
you?<br />
• How easy is it to substitute<br />
what you provide?<br />
• Are there cost<br />
advantages not related<br />
to the size <strong>of</strong> the<br />
company<br />
• Are buyers <strong>of</strong>ten able to<br />
dictate terms to you?<br />
• Will competitors<br />
retaliate?<br />
• What can be the<br />
impact <strong>of</strong> government<br />
action (effect <strong>of</strong><br />
legislation)?<br />
• How important is<br />
differentiation?<br />
57
Market, Technology, and Competitive Trends<br />
Market Trends (consumer,<br />
supplier, regulatory)<br />
Technology Trends and Road<br />
Map<br />
Global Factors<br />
Manufacturing<br />
List the manufacturing trends – in terms <strong>of</strong> global<br />
sourcing and BCC sourcing<br />
Globalization/Footprint<br />
Note the global trends and how they may affect<br />
BCC sourcing<br />
New Technologies<br />
List any new technologies that are impacting this<br />
category.<br />
Substitutions<br />
List the technologies that will be phased out in the<br />
near term and what are the new technologies that<br />
will replace these existing products.<br />
Significant Global Factors:<br />
Identify and list the major global factors (for<br />
example political, geographical, technological,<br />
meteorological and any other factors) that affect<br />
the category and note how they impact this<br />
category.<br />
Legislation<br />
Provide details around any specific legislation in<br />
any part <strong>of</strong> the world impacting the buy and how<br />
does it impact the category in general.<br />
Cost Drivers<br />
Ascertain how costs <strong>of</strong> related commodities (input)<br />
affect the category. What are the cost drivers?<br />
Other<br />
58
Category Team Leader Comments<br />
• Provide comments / suggestions.<br />
• List major issues or directions<br />
59