NWT 2011-2015 - NWT Species at Risk
NWT 2011-2015 - NWT Species at Risk
NWT 2011-2015 - NWT Species at Risk

Create successful ePaper yourself
Turn your PDF publications into a flip-book with our unique Google optimized e-Paper software.
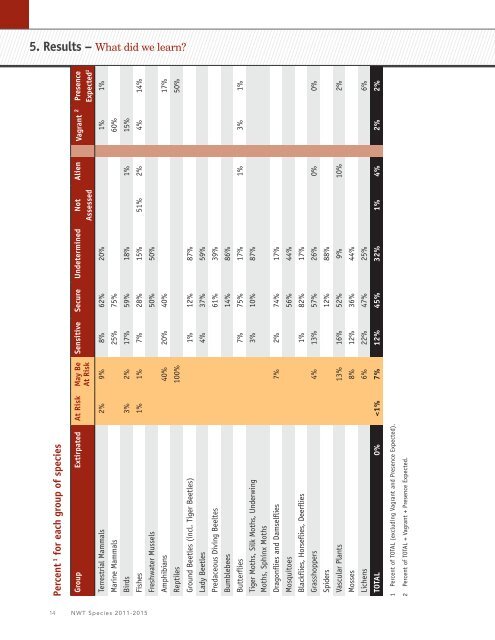
5. Results – Wh<strong>at</strong> did we learn?<br />
Percent 1 for each group of species<br />
Group Extirp<strong>at</strong>ed At <strong>Risk</strong> May Be<br />
At <strong>Risk</strong><br />
Sensitive Secure Undetermined Not<br />
Assessed<br />
Alien Vagrant 2 Presence<br />
Expected 2<br />
Terrestrial Mammals 2% 9% 8% 62% 20% 1% 1%<br />
Marine Mammals 25% 75% 60%<br />
Birds 3% 2% 17% 59% 18% 1% 15%<br />
Fishes 1% 1% 7% 28% 15% 51% 2% 4% 14%<br />
Freshw<strong>at</strong>er Mussels 50% 50%<br />
Amphibians 40% 20% 40% 17%<br />
Reptiles 100% 50%<br />
Ground Beetles (incl. Tiger Beetles) 1% 12% 87%<br />
Lady Beetles 4% 37% 59%<br />
Predaceous Diving Beeltes 61% 39%<br />
Bumblebees 14% 86%<br />
Butterflies 7% 75% 17% 1% 3% 1%<br />
Tiger Moths, Silk Moths, Underwing<br />
3% 10% 87%<br />
Moths, Sphinx Moths<br />
Dragonflies and Damselflies 7% 2% 74% 17%<br />
Mosquitoes 56% 44%<br />
Blackflies, Horseflies, Deerflies 1% 82% 17%<br />
Grasshoppers 4% 13% 57% 26% 0% 0%<br />
Spiders 12% 88%<br />
Vascular Plants 13% 16% 52% 9% 10% 2%<br />
Mosses 8% 12% 36% 44%<br />
Lichens 6% 22% 47% 25% 6%<br />
TOTAL 0%