understanding vulnerability of afghans with disability - Handicap ...
understanding vulnerability of afghans with disability - Handicap ...
understanding vulnerability of afghans with disability - Handicap ...

You also want an ePaper? Increase the reach of your titles
YUMPU automatically turns print PDFs into web optimized ePapers that Google loves.
Islamic Republic <strong>of</strong> Afghanistan<br />
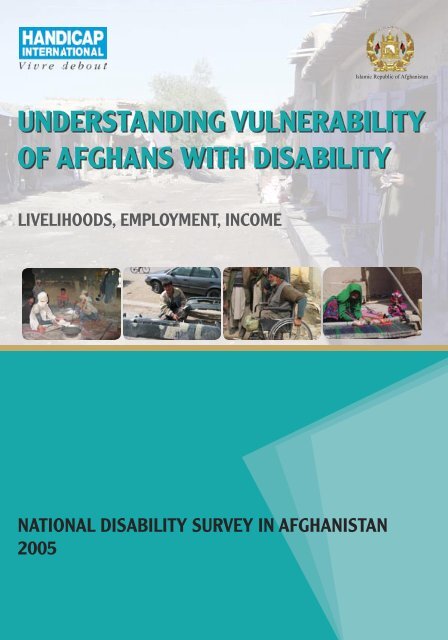
UNDERSTANDING VULNERABILITY<br />
OF AFGHANS WITH DISABILITY<br />
LIVELIHOODS, EMPLOYMENT, INCOME<br />
NATIONAL DISABILITY SURVEY IN AFGHANISTAN<br />
2005
UNDERSTANDING VULNERABILITY<br />
OF AFGHANS WITH DISABILITY<br />
LIVELIHOODS, EMPLOYMENT, INCOME<br />
NATIONAL DISABILITY SURVEY IN AFGHANISTAN<br />
2005<br />
Definition and Context<br />
i
© <strong>Handicap</strong> International 2006<br />
ISBN : 978-2-909064-78-9<br />
Authors<br />
Parul Bakhshi, parulbakhshi@yahoo.com<br />
Jean-François Trani, jftrani@yahoo.fr<br />
Contributions from Jean-Luc Dubois jldubois@aol.com<br />
Editing, design and printing<br />
New Concept Information Systems Pvt. Ltd.<br />
New Delhi, India<br />
Published by<br />
<strong>Handicap</strong> International<br />
14, Avenue Berthelot<br />
69361 Lyon Cedex 07, France<br />
Tel +33 (0) 4 78 69 79 79<br />
Fax +33 (0) 4 78 69 79 94<br />
email: contact@handicap-international.org<br />
www.handicap-international.org<br />
Photographs<br />
<strong>Handicap</strong> International Afghanistan Programme<br />
House No. 133<br />
Qala-e-Fatullah, 5th street,<br />
Kabul, Afghanistan
Contents<br />
Acknowledgements<br />
Abbreviations<br />
Preface<br />
Executive Summary<br />
Introduction<br />
x<br />
xi<br />
xii<br />
xiii<br />
xiv<br />
Definition and Context<br />
A Few Definitions 1<br />
What is Poverty? 1<br />
From Vulnerability to Poverty: Facing Risk and Enduring Shocks 1<br />
Livelihood, Poverty and Disability from a Global Perspective 3<br />
Poverty and Disability in Afghanistan 3<br />
Poverty from a Gender Perspective 3<br />
Gathering Data for Poverty Analysis <strong>of</strong> a Small Population<br />
Group: a Major Challenge 4<br />
Poverty <strong>of</strong> Living Conditions: Identifying Benchmarks<br />
Inequality in the Access to Basic Goods 5<br />
Diffi cult Access to Drinking Water 5<br />
Sources <strong>of</strong> Light: Paucity <strong>of</strong> Resources 7<br />
Energy for Cooking: the Massive Use <strong>of</strong> Firewood a Cause for Concern? 9<br />
Access to Modern Toilet Facilities: a Benchmark for Wealth? 10<br />
Standards <strong>of</strong> Living: Main Features 10<br />
Size <strong>of</strong> Houses and Size <strong>of</strong> Households: Over Crowded Living Spaces 10<br />
Supply and Access to Food: Insuffi cient Quantity, Lack <strong>of</strong> Diversity 14<br />
Activity and Income: Struggling for Survival 17<br />
Activity and Unemployment in an Economy under Reconstruction 17<br />
Major Characteristics <strong>of</strong> the Labour Force and Market 18<br />
Activity and Disability 24<br />
Less Child Labour in Afghanistan? 26<br />
High Inequality <strong>of</strong> Income in Afghanistan 29<br />
Comparing Income <strong>of</strong> Persons <strong>with</strong> Disability and Non-Disabled 32<br />
Concluding Remarks 33<br />
Fewer Assets for Persons <strong>with</strong> Disability: a Vulnerability<br />
Issue<br />
Durable Goods: Relative Indicators <strong>of</strong> Well-Being 35<br />
Equipment <strong>of</strong> the House and Common Goods: Benchmarks for Wealth 35
Widespread Ownership <strong>of</strong> Livestock 38<br />
Land Ownership: Do Households <strong>of</strong> Persons <strong>with</strong> Disability have Smaller Land Holdings? 42<br />
Concluding on Durable Goods: Fighting Poverty in a Comprehensive Manner 44<br />
Debt and Donation: Assets or Factors <strong>of</strong> Vulnerability? 45<br />
Resort to Loan and Level <strong>of</strong> Debt: Higher for Persons <strong>with</strong> Disability 45<br />
Concluding on Borrowing Practices: Risk Factor or Capability Asset? 56<br />
Income through the Social Network: the Social Income 56<br />
Concluding on Social Income 58<br />
General Conclusions<br />
Disability: a Dormant Factor? 59<br />
Urban or Rural Settings: an Expected Difference 59<br />
Female-headed Households: the most Vulnerable<br />
and the Poorest 59<br />
Access to the Labour Market: a Matter <strong>of</strong> Perception 60<br />
The Way Forward: Mainstreaming, Empowerment,<br />
Participation <strong>of</strong> Persons <strong>with</strong> Disability 60<br />
Bibliography 61<br />
Annexure 63<br />
Tables Related to Water Supply 63<br />
Tables Related to Light Supply 65<br />
Tables Related to Cooking Energy Supply 67<br />
Tables Related to Toilet Facilities 68<br />
Tables Related to Housing 69<br />
Tables Related to Food Supply 71<br />
Tables Related to Activity and Employment 73<br />
Tables Related to Income 82<br />
Tables Related to Durable Goods 83<br />
Tables Related to Livestock Ownership 86<br />
Tables Related to Land Ownership 92<br />
Tables Related to Debt 95<br />
Tables Related to Social Income 103<br />
iv<br />
Understanding Vulnerability <strong>of</strong> Afghans <strong>with</strong> Disability
Lst <strong>of</strong> Tables<br />
Table 1. Distribution <strong>of</strong> Households according to Location and Gender <strong>of</strong> the<br />
Head <strong>of</strong> the Household 4<br />
Table 2. Distribution <strong>of</strong> Households <strong>of</strong> Persons <strong>with</strong> Disability and the Non-Disabled<br />
according to the Gender <strong>of</strong> the Head <strong>of</strong> the Household 4<br />
Table 3. Average Ratio <strong>of</strong> Number <strong>of</strong> Members by Room and Number <strong>of</strong> Household<br />
Members according to the Number <strong>of</strong> Rooms in the House 12<br />
Table 4. Distribution <strong>of</strong> Active People by Main Pr<strong>of</strong>essions 22<br />
Table 5. Distribution <strong>of</strong> Active People by Sectors <strong>of</strong> Activity 23<br />
Table 6. Activities <strong>of</strong> Children Aged 6 to 14 28<br />
Table 7. Gini Coeffi cient for Income from Activity 30<br />
Table 8. Poverty and Inequality in the South Asia Region 30<br />
Table 9. Ownership <strong>of</strong> Livestock: Comparing NRVA 2003 and NDSA 2005 41<br />
Table 10. Gini Coeffi cient <strong>of</strong> Land Ownership 44<br />
Table 11. Average Amount <strong>of</strong> Loan for Urban and Rural Households 49<br />
Table 12. Distribution <strong>of</strong> Households according to the Location <strong>of</strong> Drinking Water 63<br />
Table 13. Distribution <strong>of</strong> Households according to the Time Needed to Fetch Drinking Water 63<br />
Table 14. Distribution <strong>of</strong> Households according to Types <strong>of</strong> Water Supply Available 64<br />
Table 15. Distribution <strong>of</strong> Households according to Location <strong>of</strong> Drinking Water in<br />
Urban and Rural Areas 64<br />
Table 16. Distribution <strong>of</strong> Households according to Location <strong>of</strong> Drinking Water Available in<br />
Urban and Rural Areas and Gender <strong>of</strong> the Head <strong>of</strong> Household. 65<br />
Table 17. Distribution <strong>of</strong> Households according to Sources <strong>of</strong> Light Supply Available 65<br />
Table 18. Distribution <strong>of</strong> Households according to Sources <strong>of</strong> Light Supply Available<br />
in Urban and Rural Areas 66<br />
Table 19. Distribution <strong>of</strong> Households according to Gender <strong>of</strong> the Head <strong>of</strong> the Household and<br />
Sources <strong>of</strong> Light Supply Available 66<br />
Table 20. Distribution <strong>of</strong> Households according to Sources <strong>of</strong> Energy for Cooking 67<br />
Table 21. Distribution <strong>of</strong> Households according to Sources <strong>of</strong> Energy for Cooking in<br />
Urban and Rural Settings 67<br />
Table 22. Distribution <strong>of</strong> Households according to Access to Types <strong>of</strong> Toilet Facilities 68<br />
Table 23. Distribution <strong>of</strong> Households according to Access to Types <strong>of</strong> Toilet Facilities in<br />
Urban and Rural Settings 68<br />
Table 24. Distribution <strong>of</strong> Households by Number <strong>of</strong> Rooms in the House 69<br />
Table 25. Distribution <strong>of</strong> Number <strong>of</strong> Household Members and Number <strong>of</strong><br />
Rooms in the House 69<br />
Table 26. Distribution <strong>of</strong> People according to Number <strong>of</strong> Rooms in the House by<br />
Urban and Rural Settings 70<br />
Table 27. Distribution <strong>of</strong> Households according to Gender <strong>of</strong> the Head <strong>of</strong> the Household<br />
by Number <strong>of</strong> Rooms in the House 70<br />
Table 28. Distribution <strong>of</strong> Households according to Sources for Supply <strong>of</strong> Food 71<br />
Table 29. Distribution <strong>of</strong> Households in Urban and Rural Areas according to<br />
Sources <strong>of</strong> Supply <strong>of</strong> Food 71<br />
Table 30. Distribution <strong>of</strong> Households according to Suffi ciency <strong>of</strong> Food 72<br />
Table 31. Distribution <strong>of</strong> Households in Urban or Rural Settings according to<br />
Suffi ciency <strong>of</strong> Food 72<br />
Table 32. Distribution <strong>of</strong> Households according to Gender <strong>of</strong> the Head <strong>of</strong> the Household<br />
and Suffi ciency <strong>of</strong> Food 73<br />
Table 33. Distribution <strong>of</strong> Persons <strong>with</strong> Disability and Non-disabled Aged 15-64<br />
according to the Employment Situation 73<br />
Table 34. Distribution <strong>of</strong> Household according to the Ratio <strong>of</strong> Employed Members 74<br />
Contents<br />
v
Table 35. Distribution <strong>of</strong> Persons <strong>with</strong> Disability and Non-Disabled Aged 15-64<br />
according to Employment Situation and Gender 74<br />
Table 36. Distribution <strong>of</strong> Persons <strong>with</strong> Disability and Non-Disabled Between<br />
14 and 65 according to Employment Situation and Gender<br />
(analysis on series <strong>of</strong> questions) 75<br />
Table 37. Distribution <strong>of</strong> People Above 14 according to Employment Situation<br />
Gender and the Situation in the Household 75<br />
Table 38. Distribution <strong>of</strong> People according to Pr<strong>of</strong>ession 76<br />
Table 39. Distribution <strong>of</strong> Persons <strong>with</strong> Disability and Non-Disabled Above 14<br />
according to Activity Status 77<br />
Table 40. Distribution <strong>of</strong> Persons <strong>with</strong> Disability and Non-Disabled Above 14<br />
according to Farmer Status 78<br />
Table 41. Distribution <strong>of</strong> Persons <strong>with</strong> Disability and Non-Disabled<br />
Age 15-64 according to Diffi culties Faced in the Workplace 78<br />
Table 42. Distribution <strong>of</strong> Children <strong>with</strong> Disability and Non-Disabled Children<br />
Aged 7 to 15 according to Activity and Gender 79<br />
Table 43. Distribution <strong>of</strong> Children <strong>with</strong> Disability and Non-Disabled Children<br />
Aged 7 to 15 according to Time Spent in Household Tasks and Gender 79<br />
Table 44. Distribution <strong>of</strong> Children <strong>with</strong> Disability and Non-Disabled Children<br />
Aged 7 to 15 according to Types <strong>of</strong> Household Tasks and Gender 80<br />
Table 45. Distribution <strong>of</strong> Boys <strong>with</strong> Disability and Non-Disabled Boys<br />
Aged 7 to 15 according to Types <strong>of</strong> Field Work 81<br />
Table 46. Distribution <strong>of</strong> Boys <strong>with</strong> Disability and Non-Disabled Boys<br />
Aged 7 to 15 according to Types <strong>of</strong> Jobs 81<br />
Table 47. Monthly Activity Income <strong>of</strong> Active People 82<br />
Table 48. Distribution <strong>of</strong> Active Persons Aged 15-64 <strong>with</strong> Disability and<br />
Non-Disabled according to Monthly Pr<strong>of</strong>essional Income 82<br />
Table 49. Distribution <strong>of</strong> Active Males Aged 15-64 <strong>with</strong> Disability and Non-Disabled<br />
according to Monthly Pr<strong>of</strong>essional Income 83<br />
Table 50. Distribution <strong>of</strong> Persons <strong>with</strong> Disability and Non-Disabled Living in<br />
Households Possessing the Following Goods 83<br />
Table 51. Distribution <strong>of</strong> Households Possessing the Following Goods and Equipments 84<br />
Table 52. Distribution <strong>of</strong> Households according to the Ownership <strong>of</strong> Goods<br />
and Equipments by Urban and Rural Settings 85<br />
Table 53. Distribution <strong>of</strong> Households according to Gender <strong>of</strong> the Head <strong>of</strong> the Household and<br />
Ownership <strong>of</strong> Goods and Equipments 86<br />
Table 54. Distribution <strong>of</strong> Persons <strong>with</strong> Disability and Non-Disabled Living in<br />
Households Possessing Livestock 86<br />
Table 55. Distribution <strong>of</strong> Households according to Ownership <strong>of</strong> Livestock 87<br />
Table 56. Distribution <strong>of</strong> People in Urban and Rural Areas Living in Households<br />
Possessing Livestock 87<br />
Table 57. Distribution <strong>of</strong> People according to Gender <strong>of</strong> the Head <strong>of</strong> the Household<br />
and Possession <strong>of</strong> Livestock 87<br />
Table 58. Distribution <strong>of</strong> Households <strong>of</strong> Persons <strong>with</strong> Disability and Non-Disabled<br />
according to Ownership <strong>of</strong> Livestock by Type <strong>of</strong> Animals 87<br />
Table 59. Distribution <strong>of</strong> Households according to Ownership <strong>of</strong> Different Types <strong>of</strong> Animals 89<br />
Table 60. Distribution <strong>of</strong> People according to Gender <strong>of</strong> the Head <strong>of</strong> the Household and<br />
Ownership <strong>of</strong> Animals by Types <strong>of</strong> Animals 91<br />
Table 61. Distribution <strong>of</strong> Households according to Ownership <strong>of</strong> Land 92<br />
Table 62. Distribution <strong>of</strong> Persons <strong>with</strong> Disability and Non-reporting Ownership <strong>of</strong> Land 92<br />
Table 63. Distribution <strong>of</strong> Household according to Ownership <strong>of</strong> Land by Urban<br />
and Rural Areas 93<br />
vi<br />
Understanding Vulnerability <strong>of</strong> Afghans <strong>with</strong> Disability
Table 64. Distribution <strong>of</strong> Households according to Gender <strong>of</strong> the Head <strong>of</strong> the Household<br />
and Ownership <strong>of</strong> Land 93<br />
Table 65. Distribution <strong>of</strong> Households according to Gender <strong>of</strong> the Head <strong>of</strong> the Household<br />
and Personal Ownership <strong>of</strong> Land 93<br />
Table 66. Distribution <strong>of</strong> Households according to the Size <strong>of</strong> the Land 93<br />
Table 67. Distribution <strong>of</strong> Households according to the Size <strong>of</strong> the Land which is Cultivable 94<br />
Table 68. Distribution <strong>of</strong> Households according to Gender <strong>of</strong> the Head <strong>of</strong> the Household and the<br />
Size <strong>of</strong> the Land <strong>of</strong> the Family 94<br />
Table 69. Distribution <strong>of</strong> Households according to Gender <strong>of</strong> the Head <strong>of</strong> the Household<br />
and to the Size <strong>of</strong> the Land <strong>of</strong> the Family which is Cultivable 95<br />
Table 70. Distribution <strong>of</strong> Persons <strong>with</strong> Disability and Non-Disabled Above 14 Having<br />
Taken a Loan in the Last 5 Years according to Activity 95<br />
Table 71. Distribution <strong>of</strong> Persons <strong>with</strong> Disability and Non-Disabled above 14 Having<br />
Taken a Loan in the Last 5 Years according to Gender and Age 96<br />
Table 72. Distribution <strong>of</strong> Persons <strong>with</strong> Disability and Non-Disabled above 14 Having<br />
Taken a Loan in the Last 5 Years according to the Area <strong>of</strong> Living 96<br />
Table 73. Distribution <strong>of</strong> Persons <strong>with</strong> Disability and Non-Disabled Above 14 Having Taken<br />
a Loan in the Last 5 Years according to Major Geographical Areas 97<br />
Table 74. Distribution <strong>of</strong> Persons <strong>with</strong> Disability and Non-Disabled above 14 according<br />
to Amounts <strong>of</strong> Loans 97<br />
Table 75. Distribution <strong>of</strong> Persons <strong>with</strong> Disability and Non-Disabled above 14 according<br />
to Amounts <strong>of</strong> Loans and Age Groups 98<br />
Table 76. Distribution <strong>of</strong> Persons <strong>with</strong> Disability and Non-Disabled above 14 according<br />
to Amounts <strong>of</strong> Loans and Gender 98<br />
Table 77. Distribution <strong>of</strong> Persons <strong>with</strong> Disability and Non-Disabled above 14 according<br />
to Amounts <strong>of</strong> Loans and Living Area 99<br />
Table 78. Distribution <strong>of</strong> Persons <strong>with</strong> Disability and Non-Disabled above 14 according<br />
to the Level <strong>of</strong> Debt 99<br />
Table 79. Distribution <strong>of</strong> Persons <strong>with</strong> Disability and Non-Disabled above 14 according<br />
to the Level <strong>of</strong> Debt by Age Group 100<br />
Table 80. Distribution <strong>of</strong> Persons <strong>with</strong> Disability and Non-Disabled above 14 according<br />
to the Level <strong>of</strong> Debt by Gender 100<br />
Table 81. Distribution <strong>of</strong> Persons <strong>with</strong> Disability and Non-disabled Above 14 according<br />
to the Level <strong>of</strong> Debt by Living Area 101<br />
Table 82. Distribution <strong>of</strong> Persons <strong>with</strong> Disability and Non-Disabled above 14 according<br />
to the Level <strong>of</strong> Debt and the Situation <strong>of</strong> Activity 101<br />
Table 83. Distribution <strong>of</strong> Persons <strong>with</strong> Disability and Non-Disabled above 14 according<br />
to the Purpose <strong>of</strong> Loan 102<br />
Table 84. Distribution <strong>of</strong> Persons <strong>with</strong> Disability and Non-Disabled above 14 according<br />
to the Money Lender 102<br />
Table 85. Distribution <strong>of</strong> Persons <strong>with</strong> Disability and Non-Disabled above 14<br />
Having Received Money according to Gender 103<br />
Table 86. Distribution <strong>of</strong> Persons <strong>with</strong> Disability and Non-Disabled above 14 Having<br />
Received Money according to Donors 103<br />
Table 87. Distribution <strong>of</strong> Persons <strong>with</strong> Disability and Non-Disabled above 14 Having<br />
Received Money according to the 3 Main Donors 104<br />
Table 88. Distribution <strong>of</strong> Persons <strong>with</strong> Disability and Non-Disabled above 14 Having<br />
Received Money according to Donors and Gender 104<br />
Table 89. Distribution <strong>of</strong> Persons <strong>with</strong> Disability and Non-Disabled above 14 Having<br />
Received Money according to Amounts 105<br />
Table 90. Distribution <strong>of</strong> Persons <strong>with</strong> Disability and Non-Disabled above 14 Having<br />
Received Money according to Amounts and Gender 105<br />
Contents<br />
vii
List <strong>of</strong> Figures<br />
Figure 1. Distribution <strong>of</strong> Persons and Households Having Easy Access to Drinking Water 6<br />
Figure 2. Distribution <strong>of</strong> Households according to the Time Needed to Fetch Drinking Water 6<br />
Figure 3. Distribution <strong>of</strong> People according to the Time Needed to Fetch Water in<br />
Urban/Rural Areas 7<br />
Figure 4. Distribution <strong>of</strong> Household according to Sources <strong>of</strong> Light 8<br />
Figure 5. Distribution <strong>of</strong> Households according to Main Source <strong>of</strong> Light in Urban<br />
and Rural Areas 8<br />
Figure 6. Distribution <strong>of</strong> Households according to Main Source <strong>of</strong> Light and Gender<br />
<strong>of</strong> the Head <strong>of</strong> the Household 8<br />
Figure 7. Distribution <strong>of</strong> Households according to Sources <strong>of</strong> Energy used for Cooking 9<br />
Figure 8. Distribution <strong>of</strong> Households according to Main Source <strong>of</strong> Energy for Cooking<br />
in Urban and Rural Settings 9<br />
Figure 9. Distribution <strong>of</strong> Households according to Access to Types <strong>of</strong> Toilet Facilities 10<br />
Figure 10. Distribution <strong>of</strong> Households according to the Number <strong>of</strong> Rooms in the House 11<br />
Figure 11. Distribution <strong>of</strong> People according to the Number <strong>of</strong> Rooms in the House and<br />
the Size <strong>of</strong> the Household 12<br />
Figure 12. Lorenz Curve <strong>of</strong> the Ratio <strong>of</strong> Number <strong>of</strong> Members by Room 13<br />
Figure 13. Distribution <strong>of</strong> People according to the Number <strong>of</strong> Rooms in the House by<br />
Urban and Rural Settings 13<br />
Figure 14. Distribution <strong>of</strong> People according to Gender <strong>of</strong> the Head <strong>of</strong> the Household and<br />
Number <strong>of</strong> Rooms in the House 14<br />
Figure 15. Distribution <strong>of</strong> Households regarding Sources for Supply <strong>of</strong> Food 14<br />
Figure 16. Distribution <strong>of</strong> Households Regarding Sources <strong>of</strong> Supply <strong>of</strong> Food in<br />
Urban and Rural Areas 15<br />
Figure 17. Distribution <strong>of</strong> Households regarding Amount <strong>of</strong> Food Available 16<br />
Figure 18. Distribution <strong>of</strong> People in Urban and Rural Areas regarding Amount<br />
<strong>of</strong> Food Available 16<br />
Figure 19. Distribution <strong>of</strong> People according to Gender <strong>of</strong> the Head <strong>of</strong> Household and<br />
Supply <strong>of</strong> Food 17<br />
Figure 20. Distribution <strong>of</strong> All Afghans Above 14 according to the Employment Situation 19<br />
Figure 21. Distribution <strong>of</strong> Persons Above 14 according to the Employment Situation 19<br />
Figure 22. Distribution <strong>of</strong> Households according to the Employment Ratio 20<br />
Figure 23. Distribution <strong>of</strong> Persons Aged 15-64 according to the Employment<br />
Situation and Gender 20<br />
Figure 24. Level <strong>of</strong> Employment Considering Additional Activities 21<br />
Figure 25. Distribution <strong>of</strong> Active People above 14 by Employment Status 22<br />
Figure 26. Distribution <strong>of</strong> Farmers by Types <strong>of</strong> Status 24<br />
Figure 27. Distribution <strong>of</strong> Active People by Types <strong>of</strong> Diffi culties Faced in the Workplace 25<br />
Figure 28. Distribution <strong>of</strong> Active Disabled and Non-Disabled Persons by Types <strong>of</strong><br />
Diffi culties Faced in the Workplace 26<br />
Figure 29. Distribution <strong>of</strong> Children Between 7 and 14 Years Old according to<br />
Employment Situation 27<br />
Figure 30. Distribution <strong>of</strong> Afghan Children Between 7 and 14 Years Old according<br />
to the Activity Situation 27<br />
Figure 31. Distribution <strong>of</strong> Children Between 7 and 14 Years Old according to<br />
the Employment Situation 28<br />
Figure 32. Distribution <strong>of</strong> Monthly Activity Income for All Active People and Aged 15-64 31<br />
Figure 33. Distribution <strong>of</strong> Monthly Activity Income for Active Males Aged 15-64 31<br />
Figure 34. Distribution <strong>of</strong> Active Persons according to the Monthly Pr<strong>of</strong>essional Income 32<br />
Figure 35. Distribution <strong>of</strong> Active Men above Aged 15-64 according to the Monthly<br />
Pr<strong>of</strong>essional Income 32<br />
Figure 36. Distribution <strong>of</strong> Households regarding Ownership <strong>of</strong> Goods or Equipment 36<br />
viii Understanding Vulnerability <strong>of</strong> Afghans <strong>with</strong> Disability
Figure 37. Distribution <strong>of</strong> People Regarding Possess <strong>of</strong> Goods or Equipment in Urban<br />
and Rural Areas 37<br />
Figure 38. Distribution <strong>of</strong> Households according to Gender <strong>of</strong> the Head <strong>of</strong> the Household<br />
for Ownership <strong>of</strong> Goods or Equipment 38<br />
Figure 39. Distribution <strong>of</strong> Households according to the Ownership <strong>of</strong> Livestock 39<br />
Figure 40. Distribution <strong>of</strong> Households according to the Gender <strong>of</strong> the Head <strong>of</strong> the Household<br />
and the Ownership <strong>of</strong> Livestock 40<br />
Figure 41. Distribution <strong>of</strong> Households regarding Ownership <strong>of</strong> Livestock in Urban and<br />
Rural Areas 41<br />
Figure 42. Distribution <strong>of</strong> Households regarding Ownership <strong>of</strong> Land 42<br />
Figure 43. Lorenz Curves <strong>of</strong> Land Ownership Inequalities 43<br />
Figure 44. Distribution <strong>of</strong> Persons <strong>with</strong> Disability and Non-Disabled Above 14<br />
<strong>with</strong> Loans Taken since 5 Years according to Situation <strong>of</strong> Activity 46<br />
Figure 45. Distribution <strong>of</strong> Persons <strong>with</strong> Disability and Non-disabled Above 14<br />
according to the Amount <strong>of</strong> Loans and Age Groups 46<br />
Figure 46. Distribution <strong>of</strong> Persons <strong>with</strong> Disability and Non-Disabled Above 14 <strong>with</strong><br />
Loan Taken since 5 Years according to Gender 47<br />
Figure 47. Distribution <strong>of</strong> Persons <strong>with</strong> Disability and Non-Disabled Above 14 <strong>with</strong> Loan<br />
Taken since 5 Years according to the Area <strong>of</strong> Living 47<br />
Figure 48. Distribution <strong>of</strong> All Afghans Above 14 according to the Amount <strong>of</strong> Loans 48<br />
Figure 49. Distribution <strong>of</strong> Persons <strong>with</strong> Disability and Non-Disabled Above 14 according<br />
to the Amount <strong>of</strong> Loans 48<br />
Figure 50. Distribution <strong>of</strong> Persons <strong>with</strong> Disability and Non-disabled Above 14 according<br />
to the Amount <strong>of</strong> Loans and Age Group 49<br />
Figure 51. Distribution <strong>of</strong> Persons <strong>with</strong> Disability and Non-Disabled Above 14 according<br />
to the Amount <strong>of</strong> Loans and Gender 50<br />
Figure 52. Distribution <strong>of</strong> Persons <strong>with</strong> Disability and Non-Disabled Above 14 according<br />
to the Amount <strong>of</strong> Loans and the Living Area 50<br />
Figure 53. Distribution <strong>of</strong> All Afghans Above 14 according to the Amount <strong>of</strong> Debt 51<br />
Figure 54. Distribution <strong>of</strong> Persons <strong>with</strong> Disability and Non-Disabled Above 14 according<br />
to the Level <strong>of</strong> Debt and the Age Group 51<br />
Figure 55. Distribution <strong>of</strong> Persons <strong>with</strong> Disability and Non-Disabled Above 14 according<br />
to the Level <strong>of</strong> Debt and the Age Group 52<br />
Figure 56. Distribution <strong>of</strong> Persons <strong>with</strong> Disability and Non-Disabled Above 14 according to<br />
the Level <strong>of</strong> Debt and Gender 52<br />
Figure 57. Distribution <strong>of</strong> Persons <strong>with</strong> Disability and Non-Disabled Above 14 according to<br />
the Level <strong>of</strong> Debt and the Living Area 53<br />
Figure 58. Distribution <strong>of</strong> Persons <strong>with</strong> Disability and Non-Disabled Above 14 according to<br />
the Level <strong>of</strong> Debt and the Situation <strong>of</strong> Activity 53<br />
Figure 59. Distribution <strong>of</strong> All People Above 14 Having Taken Loans according to Purpose <strong>of</strong><br />
Loan 54<br />
Figure 60. Distribution <strong>of</strong> Persons <strong>with</strong> Disability and Non-Disabled Above 14 according<br />
to the Purpose <strong>of</strong> Loan 54<br />
Figure 61. Distribution <strong>of</strong> all People above 14 according to the Lender 55<br />
Figure 62. Distribution <strong>of</strong> Persons <strong>with</strong> Disability and Non-Disabled Above 14 according<br />
to the Lender 56<br />
Figure 63. Distribution <strong>of</strong> Persons <strong>with</strong> Disability and Non-Disabled Above 14 receiving<br />
Money according to Gender 57<br />
Figure 64. Distribution <strong>of</strong> Persons <strong>with</strong> Disability and Non-Disabled Above 14 according<br />
to the 3 Main Donors 57<br />
Figure 65. Distribution <strong>of</strong> Persons <strong>with</strong> Disability and Non-Disabled Above 14 by<br />
Amount <strong>of</strong> Money Received and Gender 58<br />
Contents<br />
ix
Acknowledgements<br />
Firoz Ali Alizada (HI)<br />
Elena M. Andresen (University <strong>of</strong> Florida)<br />
Parween Azimi (NPAD)<br />
Mario Biggeri (University <strong>of</strong> Florence)<br />
Federica Biondi (INTERSOS)<br />
Tania Burchardt (London School <strong>of</strong> Economics)<br />
Alberto Cairo (ICRC)<br />
Sonia Cautin (HI)<br />
Fiona Gall (SGAA)<br />
Flavio Comin (Sd Edmonds College, Cambridge University)<br />
Heather Dawson (HI)<br />
Elias Hameedi (Afghan Human Right Commission)<br />
Peter Hansen (JHU)<br />
Susan Helseth (UNMACA)<br />
Chris Lang (NPAD)<br />
Ashraf Mashkoor (MoPH, HMIS)<br />
Kim Mikenis (HI)<br />
Dan Mont (World Bank)<br />
Sue McKey (HI)<br />
Cécile Rolland (HI)<br />
Bjorn Schranz (HI)<br />
Arnault Serra Horguelin (UNAMA)<br />
Lorella Terzi (University <strong>of</strong> London)<br />
Frederic Tissot (French Embassy)<br />
Erik Vandissel (MoLSA/UNICEF)<br />
Peter Ventevogel (Health Net International)<br />
Lakwinder P Singh (JHU Team)<br />
The Government <strong>of</strong> Afghanistan<br />
Ministry <strong>of</strong> Martyrs and Disabled and Social Affairs<br />
Ministry <strong>of</strong> Public Health<br />
Central Statistics Offi ce<br />
Non Governmental Organisations<br />
Afghan National Association for the Deaf<br />
Aide Médicale Internationale<br />
Afghan Research and Evaluation Unit<br />
Agroaction<br />
Community Center for Disabled<br />
CHA, Coordination <strong>of</strong> Humanitarian Assistance<br />
<strong>Handicap</strong> International Belgium<br />
Healthnet International<br />
IAM, International Assistance Mission<br />
ICRC, International Committee <strong>of</strong> the Red Cross<br />
INTERSOS Humanitairan Aid Organization<br />
MADERA<br />
Medecins du Monde<br />
National Afghan Disabled Women Association<br />
National Association for Disabled <strong>of</strong> Afghanistan<br />
National Disability Union<br />
National Programme for Action on Disability<br />
People in Need<br />
Sandy Gall’s Afghanistan Appeal<br />
SERVE, Serving Emergency Relief and Vocational<br />
Enterprises<br />
Swedish Committee <strong>of</strong> Afghanistan<br />
UNICEF<br />
World Bank, Disability Unit<br />
We are grateful to our donors:<br />
The European Commission<br />
UNOPS/UNDP<br />
UNMAS (Volunteer Trust Fund)<br />
Ambassade de France<br />
Swiss Agency for Development and Cooperation<br />
A special thank you to the Monitor and Master Trainers,<br />
the 200 surveyors <strong>with</strong>out whom this survey would never<br />
have been carried out and the families who accepted to<br />
answer the questionnaire.<br />
The NDSA team consists <strong>of</strong>:<br />
Jean François Trani, NDSA Manager<br />
Parul Bakhshi, Consultant<br />
Layla Lavasani, Regional Manager<br />
Steffen Schwarz, Regional Manager<br />
Jean-Luc Dubois, Scientifi c Advisor<br />
Dominique Lopez, Statistics Advisor<br />
x<br />
Understanding Vulnerability <strong>of</strong> Afghans <strong>with</strong> Disability
Abbreviations<br />
AFAs<br />
BPDS<br />
BPHS<br />
CDAP<br />
CDC<br />
CI<br />
CSO<br />
DPO<br />
EU<br />
GoA<br />
HA<br />
HDI<br />
HH<br />
HI<br />
Hrs<br />
ICRC<br />
INGO<br />
LSP<br />
MDG<br />
MICS<br />
Mins<br />
MMDSA<br />
MoPH<br />
MoWA<br />
MoPW<br />
MRRD<br />
NDC<br />
NDS<br />
NDSA<br />
NDF<br />
NEEP<br />
NGO<br />
NPAD<br />
NRVA<br />
NSP<br />
NVP<br />
PIP<br />
PNA<br />
PTSD<br />
PwD<br />
SQ. MT.<br />
TOT<br />
UN<br />
UNAMA<br />
UNDP HDI<br />
UNDP<br />
UNICEF<br />
UNOPS<br />
WHO<br />
Afghanis<br />
Basic Package <strong>of</strong> Disability Services<br />
Basic Package <strong>of</strong> Health Services<br />
Comprehensive Disabled Afghans’ Program<br />
Central for Disease Control<br />
Confi dence Interval<br />
Central Statistics Offi ce<br />
Disabled People Organization<br />
European Union<br />
Government <strong>of</strong> Afghanistan<br />
Hectare<br />
Human Development Index<br />
Household<br />
<strong>Handicap</strong> International<br />
Hours<br />
International Committee <strong>of</strong> Red Cross<br />
International Non Government Organization<br />
Livelihoods and Social Protection<br />
Millennium Development Goals<br />
Multi Indicators Cluster Survey<br />
Minutes<br />
Ministry <strong>of</strong> Martyrs, Disabled and Social Affairs<br />
Ministry <strong>of</strong> Public Health<br />
Ministry <strong>of</strong> Women’s Affairs<br />
Ministry <strong>of</strong> Public Works<br />
Ministry for Reconstruction and Rural Development<br />
National Disability Commission<br />
National Disability Strategy<br />
National Disability Survey in Afghanistan<br />
National Development Framework<br />
National Emergency Employment Programme<br />
Non Governmental Organization<br />
National Programme for Action on Disability<br />
National Risk and Vulnerability Assessment<br />
National Strategic Plan<br />
National Vulnerability Programme<br />
Public Investment Programme<br />
Preliminary Needs Assessment<br />
Post Traumatic Stress Disorder<br />
Persons <strong>with</strong> Disability<br />
Square Meter<br />
Training <strong>of</strong> Trainers<br />
United Nations<br />
United Nations Assistance Mission for Afghanistan<br />
United Nations Development Programme Human Development Index<br />
United Nations Development Programme<br />
United Nation’s Children’s Fund<br />
United Nations Offi ce for Project Services<br />
World Health Organization<br />
Abbreviations<br />
xi
Preface<br />
Like many other organisations working in the <strong>disability</strong> sector in Afghanistan over the last 20 years, at SGAA we have become<br />
progessively aware that the medical model <strong>of</strong> physical rehabilitation is not enough. Yes, it is tremendously satisfying to see a small<br />
girl <strong>with</strong> polio walk for the fi rst time <strong>with</strong> callipers in our workshop or to see a paraplegic propel himself home in his new wheelchair,<br />
or to watch a young, strong, amputee stride out <strong>of</strong> the door <strong>with</strong> his new prosthesis, completely independent once more. But mobility<br />
and physical rehabilitation are only the beginning. Increasingly over the years the disabled have been asking us to provide them<br />
training, employment opportunities and loans to start their own businesses and we have tried to meet some <strong>of</strong> these needs. Mobility<br />
can be solved relatively easily, but social and economic integration is a lifelong challenge for the majority <strong>of</strong> our disabled friends in<br />
Afghanistan. We need to support and lobby the Government <strong>of</strong> Afghanistan to draw up labour laws that encourage employment <strong>of</strong><br />
the disabled and include provisions in other laws to make sure that the disabled are provided equal access to health, education, skills<br />
training and public life.<br />
As this report documents, lack <strong>of</strong> clean drinking water, insuffi cient food and low income are diffi culties faced by a majority <strong>of</strong> poor<br />
households in Afghanistan. Poverty is a great leveller and affects equally families <strong>with</strong> able members as it does families <strong>with</strong> a disabled<br />
member. The report notes that women-headed households are particularly vulnerable among the low income groups. Within a poor<br />
family the burden <strong>of</strong> a member <strong>with</strong> a <strong>disability</strong> can negatively affect the coping strategy <strong>of</strong> the family. It is also much harder and more<br />
diffi cult for the individual <strong>with</strong> a <strong>disability</strong> to be valued in the family if he or she cannot participate in many <strong>of</strong> the domestic chores<br />
or employment generating activities <strong>of</strong> the family. Yet, if a person <strong>with</strong> a <strong>disability</strong> can receive education or learn a skill this can help<br />
provide them a specifi c role in the family and wider social acceptance. We can see great examples <strong>of</strong> men and women <strong>with</strong> disabilities<br />
fi nding work and becoming the bread-winners in their families around us today in Afghanistan.<br />
With the information and recommendations from this third report in the NSDA series all <strong>of</strong> us engaged in development in Afghanistan<br />
can identify the main priorites that need to be followed to improve liveliehoods for the disabled and other vulnerable groups –<br />
empowerment, mainstreaming and equalisation <strong>of</strong> opportunities.<br />
Fiona Gall<br />
Project Consultant<br />
Sandy Gall’s Afghanistan Appeal<br />
xii<br />
Understanding Vulnerability <strong>of</strong> Afghans <strong>with</strong> Disability
Executive Summary<br />
The National Disability Survey in Afghanistan was carried out by <strong>Handicap</strong> International for the Ministry <strong>of</strong> Martyrs and Disabled and<br />
Social Affairs (MMDSA) and the Ministry <strong>of</strong> Public Health (MoPH) and <strong>with</strong> the support <strong>of</strong> the Central Statistics Offi ce (CSO) <strong>of</strong> the<br />
Ministry <strong>of</strong> Economics. This survey aims at:<br />
Evaluating the prevalence <strong>of</strong> <strong>disability</strong>;<br />
Developing a general typology <strong>of</strong> persons <strong>with</strong> <strong>disability</strong>;<br />
Evaluating the access to public services mainly educational, social and medical services for persons <strong>with</strong> <strong>disability</strong>;<br />
Gathering quality information in order to further defi ne policy priorities aiming at mainstreaming persons <strong>with</strong> <strong>disability</strong>, capability<br />
development, autonomy and social integration.<br />
The methodology applied is based on the following rules:<br />
A probabilities proportional to population size sampling procedure <strong>with</strong> a national wide sample <strong>of</strong> 5250 households (all 34<br />
provinces) using pre-census data to control the sample size <strong>of</strong> clusters (little size variation);<br />
A screening questionnaire <strong>of</strong> 27 questions to identify “diffi culties” in terms <strong>of</strong> ability/inability (avoiding direct simple questions on<br />
<strong>disability</strong>) <strong>with</strong> a large reference to ICF and Sen`s Capabilities Approach adapted to the Afghan cultural context;<br />
A one and a half month training (theoretical and practical) <strong>of</strong> the team <strong>of</strong> monitors/supervisors and a three weeks training <strong>of</strong><br />
all surveyors on all <strong>disability</strong> issues, cluster household survey principles, the questionnaire, the sampling but also security and<br />
organisational problems.<br />
A test <strong>of</strong> all tools, especially the questionnaire (elaborated by specialists and reviewed by experts, Afghan organisations <strong>of</strong> persons <strong>with</strong><br />
<strong>disability</strong>), in both rural and urban areas.<br />
The present third volume <strong>of</strong> the NDSA results looks more closely at employment, income and livelihoods <strong>of</strong> persons <strong>with</strong> <strong>disability</strong>. A<br />
common belief is that persons <strong>with</strong> <strong>disability</strong>, suffering from discrimination and exclusion, are unable to access existing resources and<br />
are more at risk <strong>of</strong> poverty than non-disabled people. This report aims at identifying the differences between households <strong>of</strong> persons<br />
<strong>with</strong> and <strong>with</strong>out <strong>disability</strong> in terms <strong>of</strong> livelihoods, to understand in what ways or on which specifi c aspects are disabled people among<br />
the poorest <strong>of</strong> the poor in Afghanistan in particular, as it seems to be the case across the world in general.<br />
The main fi nding <strong>of</strong> this analysis is the fact that when considering situations <strong>of</strong> severe or chronic poverty, <strong>disability</strong> is more <strong>of</strong> a<br />
‘dormant’ factor. In other words, households <strong>of</strong> persons <strong>with</strong> <strong>disability</strong> are not signifi cantly worse <strong>of</strong>f than non-disabled households in<br />
terms <strong>of</strong> livelihoods, commodities and assets. The factors that do seem to play an important role on livelihood indicators are the living<br />
settings (urban or rural) and the gender <strong>of</strong> the head <strong>of</strong> the household. However, <strong>disability</strong> does have an impact on the livelihoods <strong>of</strong><br />
the more advantaged sections <strong>of</strong> society, suggesting that <strong>disability</strong> does come into play once the living situation improves. As a result,<br />
the households that have a person <strong>with</strong> <strong>disability</strong> may not be poorer at this point, but they are defi nitely more vulnerable in the long<br />
term. This in turn leads to believe that if policies and programmes are not set up in order to target this vulnerable group, then they will<br />
be left behind in the development effort.<br />
Executive Summary<br />
xiii
Introduction Message<br />
There is ongoing worldwide debate over what poverty means in terms <strong>of</strong> everyday life and how it impacts<br />
the individual and the community. Looking at poverty in solely monetary terms is not suffi cient for assessing<br />
the situation. In the past decade focus has shifted from looking at poverty in terms <strong>of</strong> income and assets<br />
to including other factors that impact quality <strong>of</strong> life. These may include health and education indicators as<br />
well as the social and family resources that a person can rely upon. Moreover, poverty must be looked at in<br />
the long term if sustainable development is the goal. This implies that not only should the focus be on the<br />
present situation <strong>of</strong> persons (<strong>with</strong> <strong>disability</strong> in this case), but also on indicators <strong>of</strong> how this situation is likely to<br />
evolve in the medium and long-term. Looking at these aspects entails giving attention to the <strong>vulnerability</strong> <strong>of</strong><br />
individuals and groups, to their ability to draw on various resources in order to deal <strong>with</strong> the unpredictable, on<br />
their social resources and support systems. For persons <strong>with</strong> <strong>disability</strong>, this aspect is crucial in order to assess<br />
their quality <strong>of</strong> life, as well as to identify the mechanisms that already do exist for them to fall back upon and<br />
to strengthen these, along <strong>with</strong> defi ning ways to fi ghting poverty and <strong>vulnerability</strong> in the long-run.<br />
The present third volume <strong>of</strong> the NDSA results looks more closely at employment, income and livelihoods<br />
<strong>of</strong> persons <strong>with</strong> <strong>disability</strong>. A common belief is that persons <strong>with</strong> <strong>disability</strong>, suffering from discrimination and<br />
exclusion, are unable to access existing resources and are more at risk <strong>of</strong> poverty than non-disabled people.<br />
This report aims at identifying the differences between households <strong>of</strong> people <strong>with</strong> and <strong>with</strong>out <strong>disability</strong> in<br />
terms <strong>of</strong> livelihoods, in order to better understand in what ways or on which specifi c aspects persons <strong>with</strong><br />
<strong>disability</strong> are in fact not only one <strong>of</strong> the poorest groups in Afghanistan, but also one <strong>of</strong> the most vulnerable.<br />
This report on employment, income and living conditions is closely related to the notion <strong>of</strong> poverty, as well<br />
as that <strong>of</strong> <strong>vulnerability</strong>. Even though Afghanistan still continues to rank among the lowest on the Human<br />
Development Index (HDI), it is relevant to think about what forms rapid development will take and<br />
who might get left behind. In the last fi ve years, Afghanistan has been benefi ting from the support <strong>of</strong> the<br />
international community <strong>with</strong> the aim to build sustainable infrastructures and systems . Considerable efforts<br />
have been made to improve the economic situation, and worldwide attention is currently focused on what is<br />
happening in the country.<br />
However, there remain a few domains where these efforts seem not to have met the expectations <strong>of</strong> the<br />
population. Many voices are now raising only to underline the lack <strong>of</strong> effectiveness and achievements <strong>of</strong><br />
the various partners working on <strong>disability</strong>, but also the lack <strong>of</strong> fi nancial commitment <strong>of</strong> the international<br />
community after half a decade <strong>of</strong> support. More Afghans are showing disappointment as violence has<br />
increased sharply and the capacity to provide better service and facilities, including school, health facilities,<br />
clean water, sanitation, roads, and electricity for the population, still leaves a lot to be desired. A holistic and<br />
comprehensive view <strong>of</strong> the situation is a pre-requisite to defi ning and implementing programs that will be<br />
accepted by the benefi ciaries.<br />
The fi ndings related to livelihoods and living conditions have a unique characteristic in the series <strong>of</strong> reports<br />
<strong>of</strong> the NDSA. Whereas other reports are based upon the ‘individual’ perspective and compare answers given<br />
by persons in different situations, this report is based on answers regarding the household, as a unit. Thus,<br />
xiv<br />
Understanding Vulnerability <strong>of</strong> Afghans <strong>with</strong> Disability
this report looks at the impact <strong>of</strong> <strong>disability</strong>, not just on the individual, but also on the family as a whole. How<br />
exactly does <strong>disability</strong> <strong>of</strong> one member weigh upon their living conditions; does it impact the livelihoods <strong>of</strong> the<br />
entire household? Wherever it is possible, results will be compared to those <strong>of</strong> NRVA 2003<br />
Foreword<br />
1 for which reports<br />
are available. In fact, some <strong>of</strong> the questions, notably about possession <strong>of</strong> assets, were voluntarily identical<br />
<strong>with</strong> the NRVA questions in order to make comparison over time possible.<br />
1<br />
VULNERABILITY ANALYSIS AND MAPPING UNIT OF THE WORLD FOOD PROGRAMME AND THE VULNERABILITY ANALYSIS UNIT<br />
OF THE MINISTRY OF RURAL REHABILITATION AND DEVELOPMENT (2004), Report on Findings from the 2003 National Risk and<br />
Vulnerability Assessment (NRVA) in Rural Afghanistan, December 2004, 123 p., http://www.mrrd.gov.af/vau/.<br />
Introduction<br />
xv
Definition and Context<br />
This fi rst section attempts to defi ne a few concepts that will be referred to throughout this report: poverty and<br />
<strong>vulnerability</strong>, and the links <strong>with</strong> sustainable development. It will also look at some <strong>of</strong> the specifi cities <strong>of</strong> the<br />
context that the NDSA was carried out in.<br />
A Few Definitions<br />
What is Poverty?<br />
When travelling through Afghanistan, a general observation that can be made is the discernible diffi culty <strong>of</strong><br />
ways <strong>of</strong> ensuring livelihoods, for a great majority <strong>of</strong> the population. What exactly is poverty? Defi nitions <strong>of</strong><br />
poverty vary widely and as a consequence, ways <strong>of</strong> fi ghting poverty are multiple.<br />
Monetary Income Poverty<br />
Studying livelihoods <strong>of</strong> the Afghan population leads to taking into consideration monetary poverty. Absolute<br />
monetary poverty can be defi ned as the insuffi ciency <strong>of</strong> income to be able to get the daily food ratio.<br />
Poverty, in terms <strong>of</strong> livelihoods is the consequence <strong>of</strong> paucity <strong>of</strong> adequate nutrition, lack <strong>of</strong> clothes, <strong>of</strong><br />
accommodation, etc. Poverty <strong>of</strong> potentiality is the lack <strong>of</strong> education, equipment, social networks and<br />
support systems. Thus, the most common and traditional way <strong>of</strong> defi ning poverty is in terms <strong>of</strong> monetary<br />
income poverty. The way chosen to measure poverty, on which experts continue to debate, is as essential<br />
as the multiple meanings this word encompasses. Currently, economic policy choices and the effi ciency <strong>of</strong><br />
these choices depend on the accuracy and reliability <strong>of</strong> the tools used to collect relevant information. If only<br />
monetary poverty is taken into consideration, it is obvious that this aspect has varied greatly and increased<br />
during the last 25 years in Afghanistan. Focusing on poverty <strong>of</strong> resources and <strong>of</strong> choices available in the<br />
larger sense paint a different picture. On these aspects the country is characterised by shortage <strong>of</strong> basic social<br />
services: education, health, water sanitation, shelter.<br />
Poverty <strong>of</strong> Capabilities<br />
However, over the last decade, a more comprehensive view has emerged, mostly pushed forward by the<br />
Human Development reports and the theories <strong>of</strong> Amartya Sen to look at poverty in terms <strong>of</strong> capabilities. The<br />
Capabilities Approach 2 is based on “beings and doings that an individual has reason to value”, thus<br />
shifting the focus from the specifi cities <strong>of</strong> the disabling situation to how to look at establishing equality in<br />
terms <strong>of</strong> possibilities and choices. Amartya Sen’s Capabilities Approach looks at not what a person actually<br />
does (functionings) but at the range <strong>of</strong> possibilities that he/she chooses that specifi c functioning from – this<br />
is the capability set. Taking the view <strong>of</strong> the individual shifts the focus to the interaction between the person,<br />
<strong>with</strong> his/her limitations in functioning (which may or may not be permanent) and the context, which consists<br />
<strong>of</strong> a number <strong>of</strong> resources as well as expectations, stereotypes and <strong>of</strong>ten prejudice and discrimination. As a<br />
result, looking at poverty <strong>of</strong> capabilities does not stop at just what the person does but what his/her choices<br />
are. These choices are infl uenced by the social and human resources, especially in traditional contexts.<br />
From Vulnerability to Poverty: Facing Risk and Enduring Shocks<br />
Vulnerability is defi ned as “the probability <strong>of</strong> having his/her own situation worsens when facing a dramatic event.<br />
2 See SEN A., (1999) Development as Freedom, Oxford University Press, Oxford.<br />
Definition and Context<br />
1
A worsening, which can lead, depending on various factors, to poverty” 3 . In other words <strong>vulnerability</strong> refers<br />
to the incapability <strong>of</strong> people or households, or even the community at large, to transform assets and income<br />
into capabilities. It is the inability to resist an external or covariate 4 shocks or to face risks that threaten and<br />
reduce their well-being. External shocks such as violence or insecurity, drought, fl ood, late frosts are common in<br />
Afghanistan. During the fi eldwork in June 2005, a complete cluster in Faryab province has been destroyed by a<br />
fl ood. People were interviewed in front <strong>of</strong> ruins <strong>of</strong> their houses or in tents handed over by relief agencies. During<br />
the summer 2006, a drought has threatened the country due to inadequate rainfall in the months <strong>of</strong> April and<br />
May 2006 5 . In November 2006, fl oods killed 40 people and injured 20 others in Uruzgan province. Some 300<br />
houses and hundreds <strong>of</strong> acres <strong>of</strong> farmland were also destroyed in this province.<br />
Many factors determine the level <strong>of</strong> <strong>vulnerability</strong>. The ownership <strong>of</strong> goods, land or animals are assets against<br />
<strong>vulnerability</strong>. The benefi t <strong>of</strong> a large social network can also be <strong>of</strong> assistance in trying times. The level <strong>of</strong> activity<br />
measured by the number <strong>of</strong> active people inside the household and other income-generating activities have<br />
an impact on the level <strong>of</strong> <strong>vulnerability</strong> and, as a consequence, infl uence falling into a situation <strong>of</strong> poverty. If<br />
it is essential to measure the phenomenon through indicators such as proportion <strong>of</strong> people living below the<br />
poverty line or probability <strong>of</strong> occurrence <strong>of</strong> a shock, it is also important to look more closely at the factors<br />
which help a person stay out <strong>of</strong> poverty, and help him/her face risks in the long term. Fighting <strong>vulnerability</strong><br />
by increasing capabilities to resist shocks is what can be called reducing the <strong>vulnerability</strong> <strong>of</strong><br />
disadvantaged groups.<br />
The Human Development Report has put forward the Human Development Index (HDI) that examines the<br />
dynamic aspect <strong>of</strong> development by focusing on a variety <strong>of</strong> factors. It is very possible that a certain population<br />
does not seem worse <strong>of</strong>f than another in terms <strong>of</strong> monetary poverty, but may be more vulnerable. This means<br />
that when faced <strong>with</strong> risks and challenges (such as illness, disease, unemployment…) these vulnerable<br />
groups are at a greater risk <strong>of</strong> falling (back) into poverty: their potentialities are weak and the way they<br />
adjust their livelihood strategies to cope <strong>with</strong> shocks might not be adapted or suffi cient to cope <strong>with</strong> them to<br />
escape from poverty.<br />
The NRVA 2003 has shown that years <strong>of</strong> war and drought have had a very negative impact on the rural<br />
average household’s ability to acquire and maintain assets as well as their ability to handle the adverse<br />
effects <strong>of</strong> multiple shocks to their livelihood 6 . The present report analyses attempt to present the features that<br />
determine the <strong>vulnerability</strong> <strong>of</strong> persons <strong>with</strong> <strong>disability</strong> as well as <strong>of</strong> the households they live in: what is the link<br />
between the number <strong>of</strong> people working, the assets <strong>of</strong> an household and poverty? What is the impact <strong>of</strong> the<br />
level <strong>of</strong> education or the state <strong>of</strong> unemployment <strong>of</strong> the head <strong>of</strong> household on the livelihoods <strong>of</strong> the household?<br />
How does <strong>disability</strong> impact the living conditions <strong>of</strong> the entire household unit? Answering these questions will<br />
in turn help to determine poverty and <strong>vulnerability</strong> <strong>of</strong> households that have a disabled member and look at<br />
ways <strong>of</strong> enhancing their capabilities. “These capabilities can be enhanced by public policy, but also, on<br />
the other side, the direction <strong>of</strong> public policy can be influenced by the effective use <strong>of</strong> participatory<br />
capabilities by the public. 7 ”<br />
3 See DUBOIS J.L., ROUSSEAU S., (2001),“Reinforcing Household’s Capabilities as a Way to Reduce Vulnerability and Prevent Poverty<br />
in Equitable Terms”, paper presented at the fi rst Conference on the Capability Approach, Justice and Poverty: Examining Sen’s Capability<br />
Approach, June 5th-7th 2001, Von Hugel Institute, St Edmund’s College, Cambridge University, http://www.st-edmunds.cam.ac.uk/vhi/.<br />
4 NRVA (2003) use the term <strong>of</strong> covariate shock for a shock independent <strong>of</strong> the family, to differentiate from idiosyncratic shocks which<br />
typically occur at a household level, like loss <strong>of</strong> employment or death <strong>of</strong> a member. See VULNERABILITY ANALYSIS AND MAPPING UNIT<br />
OF THE WORLD FOOD PROGRAMME AND THE VULNERABILITY ANALYSIS UNIT OF THE MINISTRY OF RURAL REHABILITATION AND<br />
DEVELOPMENT (2004), op. cit., p. 53.<br />
4 SEN A., (1999) , op. cit., p. 18.<br />
5 United Nations Assistance Mission in Afghanistan (UNAMA) July 25, 2006, To support the urgent needs <strong>of</strong> more than 2.5 million peopled<br />
affected by drought and food insecurity, the Government <strong>of</strong> Afghanistan and the United Nations today launched an appeal for nearly $76.4<br />
million, covering an initial period <strong>of</strong> six months. That is on top <strong>of</strong> the 6.5 million the World Food Programme estimates were already at<br />
risk <strong>of</strong> hunger.<br />
6 VULNERABILITY ANALYSIS AND MAPPING UNIT <strong>of</strong> the World Food Programme and the VULNERABILITY ANALYSIS UNIT <strong>of</strong> the Ministry<br />
<strong>of</strong> Rural Rehabilitation and Development (2004), op. cit.<br />
7 SEN A., (1999), op. cit, p 18.<br />
2 Understanding Vulnerability <strong>of</strong> Afghans <strong>with</strong> Disability
Livelihood, Poverty and Disability from a Global Perspective<br />
It is a widespread belief that persons <strong>with</strong> <strong>disability</strong> are among the more disadvantaged groups, especially in<br />
developing and transitional countries. Experts refer to exclusion and discrimination, less access to food or poor<br />
quality <strong>of</strong> food, inadequate health care and incapacity <strong>of</strong> the education system to include them. Finally, persons<br />
<strong>with</strong> <strong>disability</strong> are believed to have reduced capabilities for work. In Afghanistan, where 71.6% <strong>of</strong> inhabitants<br />
live in rural areas, livelihood is based largely on agricultural activities: “All (these reasons) contribute to<br />
less opportunities for disabled people and reduced income generating capabilities 8 ”. They are <strong>of</strong>ten<br />
considered as being more at risk <strong>of</strong> falling into poverty and thus being more vulnerable than the non-disabled<br />
population. On the other hand, people living in poverty are more likely to become disabled due to a lack <strong>of</strong><br />
access to basic services, illness, malnutrition... This correlation between <strong>disability</strong> and risk <strong>of</strong> poverty has been<br />
described in a number <strong>of</strong> different studies. But from correlation to causality, it is diffi cult to conclude clearly on<br />
which factor is predominant in a certain situation and determines the others. Poor households, because they lack<br />
adequate food, basic sanitation, good housing or access to health services, particularly preventive health services,<br />
are more at risk <strong>of</strong> disabling diseases. Or, what could be a temporary and curable disease, might transform into<br />
a permanent <strong>disability</strong>. It is stated in the UN Compendium that “in many respects, the <strong>disability</strong> rate is a<br />
socioeconomic indicator, a type <strong>of</strong> poverty index, or index <strong>of</strong> development 9 ”.<br />
Poverty and Disability in Afghanistan<br />
The only mechanism <strong>of</strong> public policy that specifi cally addresses poverty <strong>of</strong> persons <strong>with</strong> <strong>disability</strong> in Afghanistan<br />
is the pension welfare system <strong>of</strong> the Ministry <strong>of</strong> Martyrs and Disabled and Social Affairs. This Ministry was<br />
established in the Soviet infl uenced era <strong>of</strong> Afghanistan as a pensions and welfare organisation catering<br />
specially to the war related disabled and the families <strong>of</strong> the martyrs. The role <strong>of</strong> the ministry was expanded in<br />
2002 under the Transitional Islamic State <strong>of</strong> Afghanistan to become the lead government agency to advocate,<br />
facilitate coordination and dissemination <strong>of</strong> information regarding persons <strong>with</strong> <strong>disability</strong>. Despite this role<br />
given to the MMDSA, line ministries were and still are responsible for integrating the needs <strong>of</strong> the disabled<br />
population in their policies and programs. An effi cient coordination body is still missing in order to bridge<br />
communication, coordination and cooperation gaps between the various ministries.<br />
According to NRVA 2003 10 , poverty is strongly correlated <strong>with</strong> the presence <strong>of</strong> disabled members in the<br />
household, among other attributes. It is also correlated <strong>with</strong> lack <strong>of</strong> access to infrastructures and services,<br />
lack <strong>of</strong> access to school and health centres, lack <strong>of</strong> capital assets such as land and livestock. Landownership<br />
also appears to be a good divider between rich and poor 11 . The present report tries to further investigate this<br />
possible link, emphasising the analysis by comparing the situation <strong>of</strong> households <strong>with</strong> a person <strong>with</strong> <strong>disability</strong><br />
and those <strong>with</strong>out any person <strong>with</strong> <strong>disability</strong>.<br />
Poverty from a Gender Perspective<br />
An interesting perspective to look at livelihood and poverty in Afghanistan is provided by the gender approach.<br />
It is <strong>of</strong>ten emphasised that women are in general more disadvantaged than men in Afghanistan, especially<br />
in terms <strong>of</strong> income and livelihoods. Therefore, it is relevant to assess the major differences in the livelihood<br />
situation between households according to the gender <strong>of</strong> the head <strong>of</strong> the household in order to determine if<br />
women <strong>with</strong> <strong>disability</strong> are more vulnerable to (chronic) poverty than men <strong>with</strong> <strong>disability</strong>.<br />
8 HOOGEVEEN J. G. (2005), Measuring Welfare for small Vulnerable Groups. Poverty and Disability in Uganda, Journal <strong>of</strong> African Economies,<br />
2005 14(4):603-631.<br />
9 STATISTICAL OFFICE, DEPARTMENT OF INTERNATIONA L ECONOMIC AND SOCIAL AFFAIRS, UNITED NATIONS (1990), “Disability<br />
Statistics Compendium”, Statistics on Special Population Groups, Series Y, No. 4, New York.<br />
10 VULNERABILITY ANALYSIS AND MAPPING UNIT OF THE WORLD FOOD PROGRAMME AND THE VULNERABILITY ANALYSIS UNIT OF<br />
THE MINISTRY OF RURAL REHABILITATION AND DEVELOPMENT (2004), op. cit.<br />
11 For a very interesting and clarifying analysis <strong>of</strong> land system in Afghanistan see ALDEN W. L. (2004),“Looking for Peace in the Pastures:<br />
Rural Land Relations in Afghanistan”, Afghanistan Research and Evaluation Unit, AREU, December 2004, 125 pp., p.14.<br />
Definition and Context<br />
3
Table 1. Distribution <strong>of</strong> Households according to Location and<br />
Gender <strong>of</strong> the Head <strong>of</strong> the Household<br />
Location <strong>of</strong> Household†<br />
Urban<br />
Man Head <strong>of</strong><br />
the HH<br />
Woman Head <strong>of</strong><br />
the HH<br />
Total<br />
Number 5323 427 5750<br />
% in location 24.0** (1) 38.4** (1) 24.7<br />
Number 16888 685 17573<br />
Rural<br />
% in location 76.0 61.6 75.3<br />
Total Number 22211 1112 23323<br />
Source: NDSA. Note: † Weighted by the number <strong>of</strong> household in the cluster <strong>with</strong>out persons <strong>with</strong> disabilities<br />
living there. (1) Test <strong>of</strong> comparison between head <strong>of</strong> households` gender. ** Signifi cant at p
Poverty <strong>of</strong> Living Conditions:<br />
Identifying Benchmarks<br />
A study focusing on livelihoods <strong>of</strong> persons <strong>with</strong> <strong>disability</strong> compares the situation <strong>of</strong> this vulnerable group<br />
<strong>with</strong> that <strong>of</strong> the non-disabled, by taking into consideration a series <strong>of</strong> indicators and items. As discussed<br />
in the introduction, it appears that the livelihood picture is a complex one. The indicators considered in this<br />
report were those selected in the interview as valid benchmarks for comparison <strong>of</strong> well-being and quality <strong>of</strong><br />
life. Three major fi elds are considered here: access to basic goods, standards <strong>of</strong> living and activity and main<br />
sources <strong>of</strong> income.<br />
Inequality in the Access to Basic Goods<br />
Access to basic commodities and utilities help characterise living conditions for households that include<br />
persons <strong>with</strong> <strong>disability</strong> as well as those <strong>with</strong> non-disabled persons as an expression <strong>of</strong> the level <strong>of</strong> poverty. It<br />
is a basic needs’ approach, which tries to evaluate the current situation <strong>of</strong> people regarding basic goods. These<br />
living conditions are assessed through the following items:<br />
Access to drinking water;<br />
Source <strong>of</strong> lighting;<br />
Energy used for cooking;<br />
Toilet facilities;<br />
Supply and access to food.<br />
For all these items, the report presents the situation <strong>of</strong> the two types <strong>of</strong> households in order to assess the<br />
impact <strong>of</strong> <strong>disability</strong> on the living conditions <strong>of</strong> the entire unit. It is important to state that questions regarding<br />
livelihoods were asked to one member <strong>of</strong> the family, as it was assumed that they would be valid for all<br />
members living under the same ro<strong>of</strong>.<br />
Difficult Access to Drinking Water<br />
Access to drinking water is, needless to mention, essential. Sometimes, in the dry season, it is necessary<br />
to walk one entire day to go and catch water at a river. Inadequate access to drinking water constitutes a<br />
major burden and strongly infl uences standard <strong>of</strong> living. In 2003, according to NRVA results 12 , only 24%<br />
<strong>of</strong> households reported accessing water from safe sources. Figure 1 (and Table 12 in Annexure) looks at the<br />
distribution <strong>of</strong> persons <strong>with</strong> <strong>disability</strong> and the non-disabled on one hand, and the households that they live in<br />
on the other hand, regarding access to drinking water. The responses are similar for households <strong>with</strong> persons<br />
<strong>with</strong> <strong>disability</strong> and for non-disabled households. A large majority <strong>of</strong> people in Afghanistan (74.3%)<br />
have to go outside the compound to fetch water. Nevertheless, people living in households <strong>with</strong>out<br />
any person <strong>with</strong> <strong>disability</strong> were signifi cantly slightly more (5.6% more) to declare having to go outside the<br />
compound.<br />
12 VULNERABILITY ANALYSIS AND MAPPING UNIT OF THE WORLD FOOD PROGRAMME AND THE VULNERABILITY ANALYSIS UNIT OF<br />
THE MINISTRY OF RURAL REHABILITATION AND DEVELOPMENT (2004), op. cit.<br />
Poverty <strong>of</strong> Living Conditions: Identifying Benchmarks<br />
5
Figure 1. Distribution <strong>of</strong> Persons<br />
and Households Having Easy<br />
Access to Drinking Water<br />
35<br />
Non-Disabled Persons <strong>with</strong> Disability<br />
Households <strong>with</strong>out Persons <strong>with</strong> Disability<br />
Households <strong>with</strong> Persons <strong>with</strong> Disability<br />
30<br />
25<br />
20<br />
15<br />
10<br />
5<br />
0<br />
Source <strong>of</strong> Water <strong>with</strong>in the Compound/House<br />
A large majority <strong>of</strong> Afghans (95.6%, see Table 14 in the Annexure) do not have a pipe supply <strong>of</strong> water and<br />
need to walk more than 5 minutes to the nearest source <strong>of</strong> drinking water (63.7% <strong>of</strong> them, see Figure 2 and<br />
Table 13 in the Annexure). If a majority (54.5%) has to walk only 10 minutes to fetch water, in some villages,<br />
a small minority (6.8%) has to walk more than 2 hours. This is mainly due to drought that has made sources<br />
<strong>of</strong> water dry. The rest <strong>of</strong> the population (35%) needs between 10 minutes and 1 hour to fetch water: and this<br />
household task is carried out by children and women every day, along <strong>with</strong> number <strong>of</strong> other tasks. On the<br />
positive side, more households <strong>with</strong> a person <strong>with</strong> <strong>disability</strong> have less than 10 mins to go to fetch water than<br />
households <strong>with</strong>out a person <strong>with</strong> <strong>disability</strong>.<br />
Figure 2. Distribution <strong>of</strong> Households according to the Time<br />
Needed to Fetch Drinking Water<br />
45<br />
Households <strong>with</strong>out Persons <strong>with</strong> Disability<br />
Households <strong>with</strong> Persons <strong>with</strong> Disability<br />
40<br />
35<br />
30<br />
25<br />
20<br />
15<br />
10<br />
5<br />
0<br />
Less than 5 Mins 6 to 10 Mins 11 to 15 Mins 16 to 20 Mins 21 to 30 Mins 30 Mins and More<br />
Table 14 in the Annexure shows that a majority <strong>of</strong> Afghans have access to water that is not always drinkable,<br />
supporting the NRVA 2003 results. The use <strong>of</strong> water in hygiene is an important preventive measure;<br />
contaminated water remains an important cause <strong>of</strong> diarrhoea and other ailments. Cholera and dysentery<br />
cause severe, sometimes life threatening forms <strong>of</strong> diarrhoea, especially when it comes to very young children<br />
who get dehydrated at an alarming rate.<br />
Less than 8% <strong>of</strong> the population have access to a private or public tap, which do not reliably and systematically<br />
provide safe water. 23.8% have access to hand pumps and 29.5% to a well, among them, 9.4% <strong>of</strong> the wells<br />
6 Understanding Vulnerability <strong>of</strong> Afghans <strong>with</strong> Disability
are open well or Kariz 13 . 2.6% more households <strong>with</strong> a person <strong>with</strong> <strong>disability</strong> have access to a well in the<br />
residence compared to non-disabled households. Another 39.3% go to rivers, ponds, lakes, streams or fi nd a<br />
way to collect rainwater. In periods <strong>of</strong> drought, the level <strong>of</strong> wells and other natural sources can become so low<br />
that water provision becomes a challenge: this requires walking long distances to fi nd an alternative source<br />
<strong>of</strong> water. Use <strong>of</strong> water <strong>with</strong> mud in unsafe ponds <strong>with</strong> stagnant water where insects breed then becomes<br />
common. As a result, the drinking water supply, which is normally safe, becomes unreliable. Spreading <strong>of</strong><br />
diseases, and widespread diarrhoea thus increase. Diarrhoea is a symptom <strong>of</strong> infection caused by a host <strong>of</strong><br />
bacterial, viral and parasitic organisms most <strong>of</strong> which can be spread by contaminated water. All these are<br />
more common when there is a shortage <strong>of</strong> clean water for drinking, cooking and cleaning, and when basic<br />
hygiene is diffi cult to maintain 14 .<br />
Figure 3. Distribution <strong>of</strong> People according to the Time Needed to Fetch<br />
Water in Urban/Rural Areas<br />
70<br />
Urban<br />
Rural<br />
60<br />
50<br />
40<br />
30<br />
20<br />
10<br />
0<br />
Less than 5 Mins 6 to 10 Mins 11 to 15 Mins 16 to 20 Mins 21 to 30 Mins 30 Mins and More<br />
A statistically signifi cant higher proportion <strong>of</strong> urban households (56.5%) have access to water inside their<br />
compound than those in rural areas (15.5%) as shown in Table 15 in the Annexure. Such a result is expected,<br />
as it is easier to develop water sanitation supply in towns. The difference is also statistically signifi cant between<br />
households where the head is a woman compared to those where the head is a man: 63.2% <strong>of</strong> those headed<br />
by a woman have water inside the compound. This is explained by a relatively highly higher presence <strong>of</strong><br />
women head <strong>of</strong> households in towns and cities than in villages.<br />
Sources <strong>of</strong> Light: Paucity <strong>of</strong> Resources<br />
Afghan households <strong>of</strong>ten use two or more sources <strong>of</strong> energy for light. Responses in following Figure 4<br />
in next page (and Tables 17 in the Annexure) are considering two possible answers. Among all sources <strong>of</strong><br />
light, only a minority <strong>of</strong> Afghan households (12.3%) use main power. The large majority <strong>of</strong> these live in<br />
towns: 27.9% <strong>of</strong> those who live in towns and cities declare using main power as the major source <strong>of</strong> light,<br />
and only 4.3% <strong>of</strong> those who live in rural areas declare using it. These households are usually located in<br />
villages that are close to urban areas and not in remote areas (see Table 18 in the Annexure). But even for<br />
those households that are connected to electricity, the shortage <strong>of</strong> supply is recurrent.<br />
Taking into account only the fi rst answer given during the interview, thus considering only the main source <strong>of</strong><br />
light, as in Figure 5 next page, 41% <strong>of</strong> households in urban areas use main power. However, they also need<br />
to rely on an alternate source <strong>of</strong> lighting (generator, kerosene lamps or candles) in case <strong>of</strong> power shortage,<br />
13 Kariz (also known as kareze or qanat) is an ancient underground channel irrigation system invented in Persia (Iran). It is a slopping<br />
tunnel that brings water from an underground source in a range <strong>of</strong> hills down to a dry plain at the foot <strong>of</strong> these hills. Its advantage over an<br />
open air aqueduct is that less water is lost by evaporation on its way from the hill to the plain. In the high and dry plains <strong>of</strong> Afghanistan,<br />
agriculture is <strong>of</strong>ten impossible <strong>with</strong>out irrigation. The Afghans have put in place a system for harnessing the water: the kareze tunnels. Part<br />
<strong>of</strong> the network <strong>of</strong> kareze as been destroyed during the confl ict.<br />
14 World Health Organization, Water Sanitation and Health (WSH) Water-related diseases.<br />
Poverty <strong>of</strong> Living Conditions: Identifying Benchmarks<br />
7
Figure 4. Distribution <strong>of</strong> Household according to Sources <strong>of</strong> Light<br />
Households <strong>with</strong>out Persons <strong>with</strong> Disability<br />
Households <strong>with</strong> Persons <strong>with</strong> a Disability<br />
80<br />
70<br />
60<br />
50<br />
40<br />
30<br />
20<br />
10<br />
0<br />
Main Power<br />
Generator/<br />
Battery/Invertor<br />
Kerosene Petrol/<br />
Gas<br />
Candles<br />
Others<br />
which remains frequent. This is why when one considers both answers, the percentage <strong>of</strong> households using<br />
main power <strong>with</strong>in the total supply, decreases. Kerosene, petrol or gas lamps are mainly used in rural areas<br />
as the fi rst source <strong>of</strong> lighting. This was also true in towns in 2005. During winter, each block <strong>of</strong> Kabul received<br />
power only a few hours a day, at best.<br />
Figure 5. Distribution <strong>of</strong> Households according to Main Source <strong>of</strong><br />
Light in Urban and Rural Areas<br />
90<br />
80<br />
Urban<br />
Rural<br />
70<br />
60<br />
50<br />
40<br />
30<br />
20<br />
10<br />
0<br />
Main Power<br />
Generator/<br />
Battery/Invertor<br />
Kerosene Petrol/<br />
Gas<br />
Candles<br />
Others<br />
However, there is no statistically signifi cant difference between households <strong>with</strong> a person <strong>with</strong> <strong>disability</strong><br />
and households <strong>with</strong>out a person <strong>with</strong> <strong>disability</strong> for this indicator.<br />
Figure 6. Distribution <strong>of</strong> Households according to Main Source <strong>of</strong> Light<br />
and Gender <strong>of</strong> the Head <strong>of</strong> the Household<br />
80<br />
Man Head <strong>of</strong> the Household<br />
Woman Head <strong>of</strong> the Household<br />
70<br />
60<br />
50<br />
40<br />
30<br />
20<br />
10<br />
0<br />
Main Power<br />
Generator/<br />
Battery/Invertor<br />
Kerosene Petrol/<br />
Gas<br />
Candles<br />
Others<br />
8 Understanding Vulnerability <strong>of</strong> Afghans <strong>with</strong> Disability
On the other hand, statistically signifi cant differences between households where the head is a woman<br />
to those where the head is a man are evident (Figure 6 and Table 19 in the Annexure):<br />
19.9% <strong>of</strong> female headed households have access to main power against only 11.9% for households<br />
headed by a man;<br />
16.3% <strong>of</strong> these use mainly a generator, battery or invertors against only 8.8% for households headed<br />
by a man.<br />
These results can be easily explained by a higher number <strong>of</strong> woman-headed households in urban areas where<br />
main power and generators are accessible than in rural areas.<br />
Energy for Cooking: the Massive Use <strong>of</strong> Firewood a Cause for Concern?<br />
The use <strong>of</strong> fi rewood (47.9% <strong>of</strong> all source <strong>of</strong> cooking used), or dung is still the main and most commonly<br />
used source <strong>of</strong> energy for cooking (Figure 7 and Table 20 in the Annexure). There is no signifi cant difference<br />
between households <strong>with</strong> a person <strong>with</strong> <strong>disability</strong> and households <strong>with</strong>out a person <strong>with</strong> <strong>disability</strong>.<br />
Figure 7. Distribution <strong>of</strong> Households according to Sources <strong>of</strong> Energy used for Cooking<br />
50<br />
Households <strong>with</strong>out Persons <strong>with</strong> Disability<br />
Households <strong>with</strong> Persons <strong>with</strong> Disability<br />
45<br />
40<br />
35<br />
30<br />
25<br />
20<br />
15<br />
10<br />
5<br />
0<br />
Gas<br />
Stove <strong>with</strong><br />
Kerosene/Petrol<br />
Firewood Dung Charcoal Electricity Other<br />
It is only in towns and cities that 40% <strong>of</strong> households use gas as a main source <strong>of</strong> energy for cooking (See Figure<br />
8), but even there fi rewood is the major energy for cooking. Charcoal and electricity are rarely used even in towns<br />
for cooking (See Table 21 in the Annexure). Some research in developing countries has shown that if in the short<br />
term, deforestation is due to population growth and agricultural expansion, over the long-term deforestation is<br />
aggravated by wood harvesting for fuel and export 15 . This might be one <strong>of</strong> the challenges for the coming years.<br />
Figure 8. Distribution <strong>of</strong> Households according to Main Source <strong>of</strong><br />
Energy for Cooking in Urban and Rural Settings<br />
80<br />
70<br />
Urban<br />
Rural<br />
60<br />
50<br />
40<br />
30<br />
20<br />
10<br />
0<br />
Gas<br />
Stove <strong>with</strong><br />
Kerosene/Petrol<br />
Firewood Dung Charcoal Electricity Other<br />
15 ALLEN, J. C. & BARNES, D. F. (1985),“The Causes <strong>of</strong> Deforestation in Developing Countries”, Annals <strong>of</strong> the Association <strong>of</strong> American<br />
Geographers 75 (2), 163-184.<br />
Poverty <strong>of</strong> Living Conditions: Identifying Benchmarks<br />
9
Access to Modern Toilet Facilities: a Benchmark for Wealth?<br />
As shown in Figure 9 (and Table 22 in the Annexure), a very small proportion <strong>of</strong> people have access to modern<br />
toilet facilities (6.0%). A large majority <strong>of</strong> people have access to traditional types <strong>of</strong> latrines. The households <strong>of</strong><br />
a majority <strong>of</strong> persons (47.7%) include a traditional Afghan open-backed latrine, <strong>with</strong> a statistically signifi cant<br />
difference between households <strong>with</strong> a person <strong>with</strong> <strong>disability</strong> and those <strong>with</strong>out <strong>disability</strong>. This is followed by<br />
the 29.4% who make use <strong>of</strong> an open defecation fi eld outside their households.<br />
Figure 9. Distribution <strong>of</strong> Households according to Access to Types <strong>of</strong><br />
Toilet Facilities<br />
60<br />
Households <strong>with</strong>out Persons <strong>with</strong> Disability<br />
Households <strong>with</strong> Persons <strong>with</strong> Disability<br />
50<br />
40<br />
30<br />
20<br />
10<br />
0<br />
Private Flush<br />
Inside<br />
Private Flush<br />
Outside<br />
Shared Flush Traditional Pit Open Backed Open Defecation Other<br />
Field Outside the<br />
House<br />
As expected, Table 23 in the Annexure shows that Afghans have signifi cantly more access to fl ushes<br />
for their natural needs in urban areas, while open fi elds are naturally more used in rural places. These<br />
practices are a vector for several diseases related to lack <strong>of</strong> hygiene.<br />
Overall it can be concluded that there is a correlation <strong>of</strong> the <strong>disability</strong> factor <strong>with</strong> this particular indicator <strong>of</strong> living<br />
conditions. The overall lack <strong>of</strong> access to electricity and water supply is a plight that is shared by all Afghans.<br />
Standards <strong>of</strong> Living: Main Features<br />
In this sub-section, standards <strong>of</strong> living are studied through two key variables: size <strong>of</strong> housing and diversity<br />
and quality <strong>of</strong> food. There is a link between poverty and size <strong>of</strong> the house in which people live. The number <strong>of</strong><br />
rooms in which the household lives is an interesting proxy for the level <strong>of</strong> wealth or poverty <strong>of</strong> a family unit.<br />
In fact, increasing the size <strong>of</strong> a house, building or acquiring a new one are important expenses that a family<br />
cannot easily make since they require a long period <strong>of</strong> savings or an important level <strong>of</strong> income.<br />
Size <strong>of</strong> Houses and Size <strong>of</strong> Households: Over Crowded Living<br />
Spaces<br />
According to the NDSA, the average size <strong>of</strong> a household is almost 8 people (7.9) living in the same house,<br />
under the same ro<strong>of</strong>, preparing the food in the same kitchen, sharing the meals, the income and the expenses.<br />
A majority <strong>of</strong> people (57.1%) live in a space <strong>of</strong> 1 to 3 rooms as shown in Figure 10 (and Table 24 in the<br />
Annexure). Compared to the average size <strong>of</strong> a household, this means that the average living space is about<br />
one room for three people. Small size <strong>of</strong> households is more common when the head is a woman: 44.5%<br />
<strong>of</strong> households headed by a woman have less than 5 members; this fi gure is <strong>of</strong> 14.7% <strong>of</strong> those headed by<br />
a man. On the other hand, 36.8% <strong>of</strong> households headed by a man have more than 10 members. Similarly,<br />
households <strong>with</strong> a person <strong>with</strong> <strong>disability</strong> are more <strong>of</strong>ten larger in size: 44.9% live in households <strong>of</strong> more<br />
than 10 members.<br />
Figure 10 (and Table 24 in the Annexure) show that the difference <strong>of</strong> size <strong>of</strong> houses between households<br />
having a disabled member and households <strong>with</strong> none are limited, and significantly different for larger<br />
10 Understanding Vulnerability <strong>of</strong> Afghans <strong>with</strong> Disability
houses only. The fact that the number <strong>of</strong> persons <strong>with</strong> <strong>disability</strong> in wealthier families living in big houses<br />
is lower, can be explained by a number <strong>of</strong> factors: less exposure to certain types <strong>of</strong> risks such as endemic<br />
diseases, malnutrition, birth accidents due to lack <strong>of</strong> basic and maternal health care, limited exposure to<br />
mines and UXO due to less work in fi elds and distances covered on foot…<br />
In other words, the 2.2% difference <strong>of</strong> living spaces <strong>of</strong> one or two rooms between households <strong>with</strong> a member<br />
who is disabled and households <strong>with</strong>out any disabled member is statistically signifi cant at 5% only. But<br />
this only represents 2.2% difference on an average <strong>of</strong> 15.2% <strong>of</strong> households living in such a limited space.<br />
One can conclude that poverty strikes almost equally in families <strong>with</strong> a disabled member and those <strong>with</strong>out<br />
considering the indicator <strong>of</strong> small living spaces.<br />
On the other hand, there is no signifi cant difference between households <strong>with</strong> person <strong>with</strong> <strong>disability</strong> and nondisabled<br />
households regarding living spaces comprising <strong>of</strong> 3 to 5 rooms. The majority <strong>of</strong> households (57.1%)<br />
live in similar conditions, whether it includes a disabled member or not. The difference becomes statistically<br />
signifi cant for bigger size houses, but <strong>with</strong> opposite differences:<br />
For 6 rooms, the number <strong>of</strong> households <strong>with</strong>out a person <strong>with</strong> <strong>disability</strong> is 4.8% higher than households<br />
<strong>with</strong> a person <strong>with</strong> <strong>disability</strong>.<br />
For 7 or more rooms, households <strong>with</strong> a person <strong>with</strong> <strong>disability</strong> are 3.1% more numerous than households<br />
<strong>with</strong>out a person <strong>with</strong> <strong>disability</strong>.<br />
Generally, the size <strong>of</strong> houses is signifi cantly slightly different for households <strong>with</strong> a disabled member. This<br />
indicator does not show any major difference in the poverty situation between both groups: the poorest <strong>with</strong><br />
small size houses are found in both groups and <strong>disability</strong> does not seem to be correlated <strong>with</strong> the size <strong>of</strong> living<br />
spaces in a signifi cant manner.<br />
Figure 10. Distribution <strong>of</strong> Households according to the Number <strong>of</strong><br />
Rooms in the House<br />
25<br />
Households <strong>with</strong>out Persons <strong>with</strong> Disability<br />
Households <strong>with</strong> Persons <strong>with</strong> Disability<br />
20<br />
15<br />
10<br />
5<br />
0<br />
1 or 2 Rooms 3 Rooms 4 Rooms 5 Rooms 6 Rooms 7 Rooms and More<br />
In fact, when one compares the size <strong>of</strong> the house using the number <strong>of</strong> rooms, and the size <strong>of</strong> the<br />
household, considering the number <strong>of</strong> inhabitants, as in Figure 11 and Table 3 next page (and Table<br />
25 in the Annexure), the following results are observed. Larger size families live in very limited spaces:<br />
10.3% <strong>of</strong> households <strong>of</strong> more than 5 members, 14.8% <strong>of</strong> households <strong>of</strong> 8 and 9.4% <strong>of</strong> households<br />
<strong>of</strong> 9 members and even 9.6% <strong>of</strong> households <strong>of</strong> more than 10 members live in houses <strong>of</strong> one or<br />
two rooms. 51.9 % and 41.8% respectively <strong>of</strong> households <strong>of</strong> more than 9 and 10 members live in<br />
houses <strong>of</strong> 1 to 4 rooms.<br />
Poverty <strong>of</strong> Living Conditions: Identifying Benchmarks<br />
11
Table 3. Average Ratio <strong>of</strong> Number <strong>of</strong> Members by Room and Number <strong>of</strong> Household Members According to<br />
the Number <strong>of</strong> Rooms in the House<br />
Number <strong>of</strong><br />
Rooms<br />
Ratio Number<br />
<strong>of</strong> Members by<br />
Room<br />
Number <strong>of</strong><br />
Members in all<br />
Households<br />
Ratio Number <strong>of</strong><br />
Members by Room<br />
in Households <strong>with</strong><br />
PwDs<br />
Number <strong>of</strong><br />
members in<br />
Households <strong>with</strong><br />
PwDs<br />
Ratio Number <strong>of</strong><br />
Members by Room<br />
in Households<br />
<strong>with</strong>out PwDs<br />
Number <strong>of</strong><br />
members in<br />
Households<br />
<strong>with</strong>out PwDs<br />
1 Room 5.6 4.6 5.4 4.2 5.6 4.6<br />
2 Rooms 3.3 5.0 3.3 5.2 3.3 5.0<br />
3 Rooms 2.2 5.3 2.5 5.8 2.2 5.3<br />
4 Rooms 1.9 6.0 2.0 6.3 1.9 5.9<br />
5 Rooms 1.6 6.0 1.7 6.5 1.6 6.0<br />
6 Rooms 1.3 6.0 1.6 6.8 1.3 6.0<br />
7 Rooms 1.3 6.3 1.4 6.9 1.3 6.2<br />
8 Rooms 1.1 7.1 1.4 7.4 1.1 7.1<br />
9 Rooms and<br />
more<br />
0.9 6.1 1.1 7.1 0.9 6.1<br />
Total 2.0 5.7 2.2 6.2 2.0 5.7<br />
Source: NDSA<br />
Table 3 and Figure 11 lead to the following conclusions.<br />
There is a general proportionally positive relationship between the number <strong>of</strong> people in the household<br />
and size <strong>of</strong> the house. Households <strong>with</strong> persons <strong>with</strong> <strong>disability</strong> are a little bigger in size, but the general<br />
ratio is similar for both households <strong>with</strong> and <strong>with</strong>out persons <strong>with</strong> <strong>disability</strong>.<br />
This leads to confi rm the fact that when there is a possibility, people do occupy the living space that is<br />
available. This is not the case in all traditional cultures.<br />
The curves in Figure 11 intersect for a household <strong>with</strong> a living space between 1 and 2 rooms and having<br />
a size <strong>of</strong> 4 to 5 people living together. This could be considered by convention as a relative poverty<br />
threshold. Below this point, houses can be considered as overcrowded. Above this point, the house can<br />
be considered as better <strong>of</strong>f. This reference point can be used as a social norm for poverty reduction policy<br />
when considering housing policy in general.<br />
Figure 11. Distribution <strong>of</strong> People according to the Number <strong>of</strong> Rooms in the<br />
House and the Size <strong>of</strong> the Household<br />
8<br />
7<br />
6<br />
5<br />
4<br />
3<br />
2<br />
Ratio Number <strong>of</strong> Members by<br />
Room<br />
Number <strong>of</strong> Members in All<br />
Households<br />
Ratio Number <strong>of</strong> Members by<br />
Room in Households <strong>with</strong> Persons<br />
<strong>with</strong> Disability<br />
Number <strong>of</strong> Members in<br />
Households <strong>with</strong> Persons <strong>with</strong><br />
Disability<br />
Ratio Number <strong>of</strong> Members by<br />
Room in Households <strong>with</strong>out<br />
Persons <strong>with</strong> Disability<br />
Number <strong>of</strong> Members in<br />
Households <strong>with</strong>out Persons <strong>with</strong><br />
Disability<br />
1<br />
0<br />
1 Room 2 Rooms 3 Rooms 4 Rooms 5 Rooms 6 Rooms 7 Rooms 8 Rooms 9 Rooms<br />
and More<br />
12 Understanding Vulnerability <strong>of</strong> Afghans <strong>with</strong> Disability
The Afghans, not considering the situation <strong>with</strong> regards to <strong>disability</strong>, are in very different conditions in terms<br />
<strong>of</strong> housing as shown in Figure 12. Figure 12 shows the Lorenz 16 curve for the proportion <strong>of</strong> households and<br />
the ratio <strong>of</strong> number <strong>of</strong> people by room. Globally, 50% <strong>of</strong>:<br />
All households have more than 1.6 people living by room;<br />
Households <strong>with</strong> persons <strong>with</strong> <strong>disability</strong> have more than 2 people living by room;<br />
Households <strong>with</strong>out a person <strong>with</strong> <strong>disability</strong> have only more than 1.6 people living by room.<br />
This shows that additional living space that may be attributed to a member <strong>of</strong> a household where a person<br />
<strong>with</strong> <strong>disability</strong> lives is probably smaller than that for members <strong>of</strong> non-disabled households. This furthermore<br />
suggests that <strong>disability</strong> does impact living standards when these tend to improve.<br />
Figure 12. Lorenz Curve <strong>of</strong> the Ratio<br />
<strong>of</strong> Number <strong>of</strong> Members by Room<br />
100<br />
90<br />
80<br />
70<br />
60<br />
50<br />
40<br />
30<br />
20<br />
10<br />
0<br />
0 10 20 30 40 50 60 70 80 90 100<br />
It is noteworthy to see how and to what extent the most disadvantaged households living in rural<br />
settings are living in small houses: 18% more <strong>of</strong> rural households (41.2%) live in houses <strong>of</strong> 1 to 3 rooms<br />
than urban households (23.2%). This occurs even if living spaces in large towns and cities are much more<br />
expensive than in villages. In contrast, 22.7% more <strong>of</strong> urban households (60.8%) live in houses <strong>of</strong> at least 5<br />
rooms compared <strong>with</strong> rural households (38.1%). This indicates higher standards <strong>of</strong> living in urban settings. A<br />
further calculation shows that the gap between households living in the largest houses (more than 7 rooms)<br />
is 17% when one compares the largest urban centres (Kabul, Herat, Jalalabad, Mazar-I-Sharif, Kandahar and<br />
Kunduz) to the rest <strong>of</strong> the country. Largest houses are found most <strong>of</strong>ten in major urban areas.<br />
Figure 13. Distribution <strong>of</strong> People according to the Number <strong>of</strong> Rooms in<br />
the House by Urban and Rural Settings<br />
25<br />
Urban<br />
Rural<br />
20<br />
15<br />
10<br />
5<br />
0<br />
1 or 2 Rooms 3 Rooms 4 Rooms 5 Rooms 6 Rooms 7 Rooms and More<br />
16 The Lorenz curve, a cumulative frequency curve that compares the distribution <strong>of</strong> a specifi c variable (ratio <strong>of</strong> number <strong>of</strong> people per<br />
room) <strong>with</strong> the uniform distribution that represents equality. This equality distribution is represented by a diagonal line, and the greater the<br />
deviation <strong>of</strong> the Lorenz curves from this line, the greater the inequality.<br />
Poverty <strong>of</strong> Living Conditions: Identifying Benchmarks<br />
13
Comparing the size <strong>of</strong> households according to the gender <strong>of</strong> the head <strong>of</strong> household (Figure 14 and Table<br />
27 in the Annexure) shows signifi cant differences for small as well as big sizes <strong>of</strong> houses:<br />
22.4% <strong>of</strong> households <strong>with</strong> a woman at the head live <strong>with</strong>in one or two rooms, while only 14.8% <strong>of</strong><br />
those headed by a man;<br />
33.2% <strong>of</strong> households <strong>with</strong> a woman at the head live <strong>with</strong>in 6 or more rooms, while this fi gure is <strong>of</strong><br />
27.5% <strong>of</strong> those headed by a man.<br />
These results show that poor households headed by a woman more <strong>of</strong>ten live in worse conditions<br />
than poor households headed by a man, even considering that there are relatively more households<br />
headed by a woman in urban areas where size <strong>of</strong> houses are bigger than in villages. On the other hand,<br />
households headed by a man are strongly and signifi cantly more represented among houses <strong>of</strong> 4 rooms,<br />
which correspond to the average house size. If households headed by women <strong>with</strong> 6 rooms are more<br />
numerous, it is most probably because these less poor households are more present in urban areas<br />
where size <strong>of</strong> houses are bigger. But this conclusion has to be considered <strong>with</strong> caution as the number<br />
<strong>of</strong> households headed by a woman is rather low; and is much lower than those headed by a man in all<br />
categories considered.<br />
Figure 14. Distribution <strong>of</strong> People according to Gender <strong>of</strong> the Head <strong>of</strong><br />
the Household and Number <strong>of</strong> Rooms in the House<br />
25<br />
Man Head <strong>of</strong> the Household<br />
Woman Head <strong>of</strong> the Household<br />
20<br />
15<br />
10<br />
5<br />
0<br />
1 or 2 Rooms 3 Rooms 4 Rooms 5 Rooms 6 Rooms 7 Rooms and More<br />
Supply and Access to Food: Insufficient Quantity, Lack <strong>of</strong> Diversity<br />
60% <strong>of</strong> Afghan households buy their food at the market. 31% both produce what they eat and buy part <strong>of</strong> their<br />
food requirements at the market. Only a minority (7.3%) relies solely on self-provided food (Figure 15). There is<br />
no statistically signifi cant difference between households <strong>with</strong> a member who is disabled and households <strong>with</strong>out<br />
any disabled member for this indicator. Disability appears to have absolutely no infl uence on this distribution.<br />
Figure 15. Distribution <strong>of</strong> Households regarding Sources for Supply <strong>of</strong> Food<br />
70<br />
60<br />
Man Head <strong>of</strong> the Household<br />
Woman Head <strong>of</strong> the Household<br />
50<br />
40<br />
30<br />
20<br />
10<br />
0<br />
Market/Bazar<br />
Self Provided/<br />
Farm<br />
Combination <strong>of</strong><br />
Market/Farm<br />
Food Aid<br />
From Family,<br />
Other Relatives<br />
14 Understanding Vulnerability <strong>of</strong> Afghans <strong>with</strong> Disability
Figure 16 shows that the proportion <strong>of</strong> people buying all their food at the bazaar is higher in urban areas.<br />
Only 2.3% rely only on their own fi eld production in urban areas. A larger minority buy part <strong>of</strong> their food at<br />
the bazaar, and produce food for their own needs in rural area.<br />
In urban areas, because only a minority <strong>of</strong> families have access to the land for farming activities, 85.5% <strong>of</strong><br />
households rely on market for their food supply. Food aid in urban areas comes after market and farm supply,<br />
and represent a very small proportion <strong>of</strong> households relying on it.<br />
In rural areas, market provides food for only half (51.1%) <strong>of</strong> the households. Only a minority never go to<br />
the bazaar for food purchases (9%). But a large number <strong>of</strong> households (38.8%) declare both buying and<br />
producing food. Family outside the household very rarely provide food (0.8%).<br />
Figure 16. Distribution <strong>of</strong> Households Regarding Sources <strong>of</strong> Supply <strong>of</strong><br />
Food in Urban and Rural Areas<br />
90<br />
80<br />
Urban<br />
Rural<br />
70<br />
60<br />
50<br />
40<br />
30<br />
20<br />
10<br />
0<br />
Market/Bazar<br />
Self Provided/<br />
Farm<br />
Combination <strong>of</strong><br />
Market/Farm<br />
Food Aid<br />
From Family,<br />
Other Relatives<br />
In terms <strong>of</strong> consumption <strong>of</strong> food, a majority <strong>of</strong> people (52.4%) report having food shortage. When one adds<br />
people who declare receiving enough food in quantity but <strong>with</strong> poor quality, insuffi cient quality or quantity <strong>of</strong><br />
food affects the large majority (83.9%) <strong>of</strong> the Afghan population. These results are in accordance <strong>with</strong> NRVA<br />
2003 results and analysis 17 . The authors noticed that in 2003, the main coping strategy in case <strong>of</strong> shock was<br />
a reduction in diet quality or quantity. The fact that persons respond to a shock by curbing a basic survival<br />
need also shows <strong>vulnerability</strong> <strong>of</strong> the population.<br />
When the situation <strong>of</strong> households <strong>with</strong> a member who is disabled and households <strong>with</strong>out any disabled<br />
member is compared, very limited and non signifi cant differences can be observed (Figure 17 in next page<br />
and Table 30 in the Annexure):<br />
52% and 52.5% respectively <strong>of</strong> households <strong>with</strong> a member who is disabled and households <strong>with</strong>out<br />
any disabled member complain about food scarcity;<br />
87.1% and 83.6% respectively <strong>of</strong> households <strong>with</strong> a member who is disabled and households <strong>with</strong>out<br />
any disabled member either lack food or receive enough food but <strong>of</strong> poor quality;<br />
The only signifi cant differences between the two types <strong>of</strong> households concerns those having enough to<br />
eat: 3.8% more among households <strong>with</strong>out any disabled member report having enough to eat.<br />
Similarly, the difference is also statistically signifi cant for households having enough food but <strong>of</strong> poor quality:<br />
4.2%, but this time households <strong>with</strong> a member who is disabled are more to be in this situation.<br />
17 VULNERABILITY ANALYSIS AND MAPPING UNIT OF THE WORLD FOOD PROGRAMME AND THE VULNERABILITY ANALYSIS UNIT OF<br />
THE MINISTRY OF RURAL REHABILITATION AND DEVELOPMENT (2004), op. cit.<br />
Poverty <strong>of</strong> Living Conditions: Identifying Benchmarks<br />
15
Figure 17. Distribution <strong>of</strong> Households Regarding Amount <strong>of</strong> Food<br />
Available<br />
40<br />
Households <strong>with</strong>out Persons <strong>with</strong> Disability<br />
Households <strong>with</strong> Persons <strong>with</strong> Disability<br />
35<br />
30<br />
25<br />
20<br />
15<br />
10<br />
5<br />
0<br />
Always Enough<br />
Sometimes Not<br />
Enough<br />
Frequently Not<br />
Enough<br />
Always Not<br />
Enough<br />
Always Enough But<br />
<strong>with</strong> Poor Quality<br />
Thus, the food situation is poor for both groups and Afghans <strong>with</strong> <strong>disability</strong> are not necessarily in a worse<br />
situation regarding this indicator. In the NDSA health report 18 , it was concluded that the majority <strong>of</strong> persons<br />
reported that their household did not receive enough food in general. The results are similar in both groups’<br />
answers.<br />
Figure 18. Distribution <strong>of</strong> People in Urban and Rural Areas<br />
regarding Amount <strong>of</strong> Food Available<br />
35<br />
Urban<br />
Rural<br />
30<br />
25<br />
20<br />
15<br />
10<br />
5<br />
0<br />
Always Enough<br />
Sometimes Not<br />
Enough<br />
Frequently Not<br />
Enough<br />
Always Not<br />
Enough<br />
Always Enough But<br />
<strong>with</strong> Poor Quality<br />
But once again, there is a strong and statistically significant difference between urban and rural<br />
settings. While 27.0% <strong>of</strong> urban households declare eating enough and adequately, only 12.4% (which<br />
is 14.6% less) <strong>of</strong> rural households declare the same. On the other hand, 16.3% more rural households<br />
(40.1%) than urban ones (23.8%) declare eating always or frequently not enough as shown in Figure 18<br />
(and Table 31 in the Annexure).<br />
18 See BAKHSHI P., NOOR A. and TRANI J.F. (2006), “Towards Well-Being For Afghans With Disability:<br />
The Health Challenge”, Report to the Government <strong>of</strong> Afghanistan, Volume 2, <strong>Handicap</strong> International, Lyon and Kabul.<br />
16 Understanding Vulnerability <strong>of</strong> Afghans <strong>with</strong> Disability
Figure 19. Distribution <strong>of</strong> People according to Gender <strong>of</strong> the Head <strong>of</strong><br />
Household and Supply <strong>of</strong> Food<br />
35<br />
Man Head <strong>of</strong> the Household<br />
Woman Head <strong>of</strong> the Household<br />
30<br />
25<br />
20<br />
15<br />
10<br />
5<br />
0<br />
Always Enough<br />
Sometimes Not<br />
Enough<br />
Frequently Not<br />
Enough<br />
Always Not<br />
Enough<br />
Always Enough But<br />
<strong>with</strong> Poor Quality<br />
Figure 19 (and Table 32 in the Annexure) show that households headed by a woman suffer more <strong>of</strong>ten from<br />
lack <strong>of</strong> quantity and <strong>of</strong> diversity <strong>of</strong> food supply. 8.4% more households headed by a woman (60.5%) than<br />
households headed by a man (52.1%) suffer from either permanent, frequent, periodic shortage <strong>of</strong> food,<br />
while 8.4% more households headed by man (48.0%) than households headed by a woman (39.6%)<br />
always get enough food, even if it is <strong>with</strong> insuffi cient diversity.<br />
The correlation between having a disabled member <strong>with</strong>in the household unit and access to food is not<br />
signifi cant. As concluded for the previous section, it seems that the overall lack <strong>of</strong> food and widespread access<br />
to quality nutrition seems to affect all social categories in Afghanistan today. However, the <strong>disability</strong> aspect<br />
probably constitutes a <strong>vulnerability</strong> factor, which is not visible when the majority <strong>of</strong> the population<br />
is living in poor conditions. This is why there is a need to closely monitor the factors that infl uence the<br />
<strong>vulnerability</strong> <strong>of</strong> households and people.<br />
The next section explores the situation on the labour market. The proportion <strong>of</strong> people working in Afghanistan<br />
is a subject <strong>of</strong> controversy. Employment, under-employment, women’s and children’s activities are diffi cult to<br />
measure and closely rely upon how they are defi ned and considered.<br />
Activity and Income: Struggling for Survival<br />
Poverty can be a result <strong>of</strong> <strong>disability</strong> when the onset <strong>of</strong> <strong>disability</strong> results in loss <strong>of</strong> employment or loss <strong>of</strong> income<br />
for the family. A major hypothesis that could be put forward is that employment is a major way to autonomy<br />
for persons <strong>with</strong> <strong>disability</strong>, a vulnerable group at risk <strong>of</strong> dependency. Within a traditional context where family<br />
and community are the most important social groups, fi nancial contribution is also a means <strong>of</strong> increasing<br />
value and respect <strong>with</strong>in the family, as persons <strong>with</strong> <strong>disability</strong> are then regarded as contributors and not<br />
as a ‘burden’, and further leads to changing their social image. Employment is a key to <strong>understanding</strong> the<br />
economic situation <strong>of</strong> persons <strong>with</strong> <strong>disability</strong> and their families.<br />
A major objective <strong>of</strong> this analysis is to assess the level <strong>of</strong> income-generating activity <strong>of</strong> the households <strong>of</strong><br />
persons <strong>with</strong> <strong>disability</strong> (including services that are remunerated on a non monetary basis). An attempt is made<br />
in this section to establish a typology <strong>of</strong> activities including issues like unemployment, under-employment,<br />
satisfaction at work, constraints faced, and level <strong>of</strong> income.<br />
Activity and Unemployment in an Economy under Reconstruction<br />
After the long period <strong>of</strong> confl ict, the economic structures and mechanism have to be rebuilt in Afghanistan.<br />
Industry is almost inexistent, agriculture represents the largest sector for activity and services have been<br />
Poverty <strong>of</strong> Living Conditions: Identifying Benchmarks<br />
17
increasing at a high pace for the last fi ve years at least in urban areas. What is the situation <strong>of</strong> the labour<br />
market in Afghanistan? What exactly is the work <strong>of</strong>fer?<br />
According to an International Rescue Committee survey carried out in 2003, the unemployment rate represents<br />
32% <strong>of</strong> the active population. But what does this fi gure stand for? Unemployment is considered as the<br />
situation <strong>of</strong> a person <strong>with</strong>out an ‘income generating activity’, effectively looking for a job and<br />
ready to take it immediately if an opportunity occurs 19 . In large areas <strong>of</strong> the country, women are not<br />
allowed to work in the fi eld but carry out all the household tasks. In this case, the rate <strong>of</strong> unemployment is<br />
<strong>of</strong> 45.6% among the 15-65 years old <strong>of</strong> both sexes: it includes all women declaring that they undertake the<br />
household chores. But if one sticks strictly to the international ILO defi nition, only 2.4% <strong>of</strong> Afghans above 14<br />
are not working and effectively looking for a job.<br />
Another diffi culty is linked to the complexity <strong>of</strong> the land ownership system and the diversity <strong>of</strong> status <strong>of</strong> people<br />
working on this land: landowners, mortgagers, tenants who share the crops and those who pay a rent, simple<br />
labourers (Kargar), etc. Beyond this complexity <strong>of</strong> the land system in rural areas, the possessions <strong>of</strong> land and<br />
<strong>of</strong> a house remain reliable benchmarks for remaining out <strong>of</strong> poverty 20 .<br />
Assessing the level <strong>of</strong> income-generating activity <strong>of</strong> persons <strong>with</strong> <strong>disability</strong> (including services that are paid<br />
on a non monetary basis) will help establishing a typology <strong>of</strong> activities that includes unemployment, underemployment,<br />
work satisfaction, constraints to employment or in the workplace and levels <strong>of</strong> income. Lack<br />
<strong>of</strong> employment is a major obstacle to achieving self-suffi ciency and fi nancial independence, especially for<br />
persons <strong>with</strong> <strong>disability</strong> who are at high risk <strong>of</strong> lifetime dependency on others. Employment also modify the<br />
perception <strong>of</strong> the person considered as participating to the family welfare, thus enhancing her/his social<br />
image and status. Identifying differences <strong>of</strong> employment situation and strategies and the link <strong>with</strong> different<br />
kind <strong>of</strong> disabilities help to identify inequalities. One important belief in Afghanistan that must be assessed<br />
against scientifi c evidence is the idea that landmine and war survivors benefi t from a better situation than<br />
other persons <strong>with</strong> <strong>disability</strong>, especially when compared to those <strong>with</strong> intellectual <strong>disability</strong> or mental illness.<br />
The picture <strong>of</strong> the employment situation <strong>of</strong> persons <strong>with</strong> <strong>disability</strong> is characterised by diversity: the types <strong>of</strong><br />
employment that they have, the duration in terms <strong>of</strong> hours, days and months, the stability <strong>of</strong> this work as<br />
well as the need for secondary jobs. Results will also be presented <strong>with</strong> regards to children’s work and their<br />
contribution to the family.<br />
Major Characteristics <strong>of</strong> the Labour Force and Market<br />
A High Level <strong>of</strong> Unemployment?<br />
Figure 20 shows that active people represent 40.4% <strong>of</strong> the population aged 15 and more, 21.5% <strong>of</strong> the<br />
entire population and 41.4% if one considers the population aged 15 to 64 years old. People in charge<br />
<strong>of</strong> household tasks, essentially women aged above 14 represent 43.2% <strong>of</strong> the population <strong>of</strong> working age<br />
(age 15 to 64 ). This means that the level <strong>of</strong> unemployment is high. But if is measured only the persons<br />
unemployed, immediately available for a work and effectively looking for a job, then the level <strong>of</strong> unemployment<br />
drops considerably to 2.4% <strong>of</strong> the population aged 15 to 64. In this case, women in charge <strong>of</strong> household<br />
tasks are not considered as unemployed. Measure <strong>of</strong> unemployment is thus a complex matter that relies on<br />
a defi nition that excludes work inside the house because not generating any income.<br />
19 For more information about unemployment measure see http://www.ilo.org/public/english/employment/strat/kilm/.<br />
20 See ALDEN W. L. (2004); op cit.<br />
18 Understanding Vulnerability <strong>of</strong> Afghans <strong>with</strong> Disability
Figure 20. Distribution <strong>of</strong> All Afghans Above 14 according<br />
to the Employment Situation<br />
9.1%<br />
2.6%<br />
0.9% 0.2%<br />
0.1%<br />
0.0%<br />
Working (41.4%)<br />
Seeking Job (2.4%)<br />
Persons in Change <strong>of</strong> the<br />
Household Tasks (43.3%)<br />
Student (9.1%)<br />
Too Old to Work (2.6%)<br />
Long Disease (0.9%)<br />
Not Working, Not Looking<br />
43.3%<br />
41.4%<br />
for a Job (0.2%)<br />
Too Young to Work (0.0%)<br />
Other (0.0%)<br />
2.4%<br />
Figure 21 (and Table 33 in the Annexure) show that the situation regarding employment is quite different for<br />
persons <strong>with</strong> <strong>disability</strong> and the non-disabled. The difference between the two groups is statistically signifi cant.<br />
The same observation goes for people in charge <strong>of</strong> household tasks. Disability impedes both pr<strong>of</strong>essional<br />
activities and household tasks. In the fi rst case, men are a majority; in the second it is the women who are<br />
primarily concerned.<br />
Figure 21. Distribution <strong>of</strong> Persons Above 14 according to the Employment<br />
Situation<br />
Non-Disabled<br />
Persons <strong>with</strong> Disability<br />
50<br />
45<br />
40<br />
35<br />
30<br />
25<br />
20<br />
15<br />
0<br />
Working<br />
Seeking<br />
Job<br />
Household<br />
Tasks<br />
Student/<br />
Scholar<br />
Too Old to<br />
Work<br />
Too Young to<br />
Work<br />
Long Disease<br />
Not Working,<br />
Not Looking<br />
for a Job<br />
Other<br />
The proportion <strong>of</strong> active members in a household is a relevant indicator <strong>of</strong> <strong>vulnerability</strong>. The risk <strong>of</strong> shocks<br />
leading to poverty is lower when more active people can face the unexpected diffi culty. Only a minority <strong>of</strong><br />
households do not have any working member. These households rely on relatives outside the household<br />
for their subsistence and they are most probably particularly at risk <strong>of</strong> falling into poverty. There is a<br />
signifi cant difference between households <strong>with</strong> persons <strong>with</strong> <strong>disability</strong> and households <strong>with</strong> non-disabled.<br />
A large majority <strong>of</strong> both groups <strong>of</strong> households reported having less than 25% <strong>of</strong> household members<br />
working. A higher proportion (62.6%) is observed for lower employment ratio among households <strong>with</strong><br />
a person <strong>with</strong> <strong>disability</strong> than in non-disabled households (59.0%). Hence, this constitutes a distinct<br />
indicator <strong>of</strong> higher proportion <strong>of</strong> households at risk <strong>of</strong> unpredicted shocks. On the other hand, a signifi cant<br />
higher proportion <strong>of</strong> households <strong>with</strong>out persons <strong>with</strong> <strong>disability</strong> reported having more than 25% <strong>of</strong> active<br />
members.<br />
Poverty <strong>of</strong> Living Conditions: Identifying Benchmarks<br />
19
Figure 22. Distribution <strong>of</strong> Households according to the<br />
Employment Ratio<br />
70<br />
Households <strong>with</strong>out Persons <strong>with</strong> Disability<br />
Households <strong>with</strong> Persons <strong>with</strong> Disability<br />
60<br />
50<br />
40<br />
30<br />
20<br />
10<br />
0<br />
No One Less than 25% 25 to 50% 50% to 75% More than 75%<br />
The ratio <strong>of</strong> employment in the household does not provide the entire information about the level <strong>of</strong> <strong>vulnerability</strong><br />
<strong>of</strong> the household. The existence <strong>of</strong> women and children working also gives insight for <strong>understanding</strong> <strong>of</strong> the<br />
level <strong>of</strong> welfare <strong>of</strong> the household.<br />
Level <strong>of</strong> Activity <strong>of</strong> Women: How to Measure the Work Carried out <strong>with</strong>in the Household and the<br />
Compound?<br />
Men and women <strong>with</strong> <strong>disability</strong> have greater diffi culty to secure employment compared to non-disabled<br />
persons. But the situation is worse for women in general. In fact, Figure 23 (and Table 35 in the Annexure)<br />
show that women, disabled or not, are very scarcely present on the labour market (6% are active). This is<br />
due to string cultural norms and the fact that women are most <strong>of</strong>ten not allowed to go outside the house<br />
in the fi eld. But women are responsible <strong>of</strong> all household tasks: looking after children and elders, preparing<br />
meals, fetching wood and water if they are not too far, cleaning the house and the compound, etc. 90%<br />
<strong>of</strong> women aged 15 to 65 carry out all these tasks, which are physically demanding. The situation <strong>of</strong> work<br />
and employment is even worse for women <strong>with</strong> <strong>disability</strong>. Hence Figure 23 further shows that a majority<br />
<strong>of</strong> women <strong>with</strong> <strong>disability</strong> do not have the capacity to do chores that are expected <strong>of</strong> women due to their<br />
impairment. This in turn might jeopardise their chance <strong>of</strong> getting married, impact their position <strong>with</strong>in the<br />
family and the community, and reduce their capabilities in Afghan society.<br />
Figure 23. Distribution <strong>of</strong> Persons Aged 15-64 according to the<br />
Employment Situation and Gender<br />
90<br />
80<br />
70<br />
Non-Disabled Men<br />
Disabled Men<br />
Non-Disabled Women<br />
Disabled Women<br />
60<br />
50<br />
40<br />
30<br />
20<br />
10<br />
0<br />
Working Not Working Household Tasks<br />
20 Understanding Vulnerability <strong>of</strong> Afghans <strong>with</strong> Disability
Sometimes alongside household chores, women have an income-generating activity or a few agricultural<br />
tasks: farming and herding livestock. Yet, in Pashto areas particularly, women are <strong>of</strong>ten not allowed to farm<br />
and herd livestock. Therefore, the fi gure <strong>of</strong> 6% probably underestimates the exact level <strong>of</strong> activity <strong>of</strong> women.<br />
In reality, when asked more in-depth questions 21 about income-generating activities, the rate <strong>of</strong> employment<br />
<strong>of</strong> women reaches 13% for non-disabled women and 10% for women <strong>with</strong> <strong>disability</strong> as shown in Figure 24<br />
(and Table 36 in the Annexure).<br />
Figure 24. Level <strong>of</strong> Employment<br />
Considering Additional Activities<br />
90<br />
80<br />
Non-Disabled<br />
Persons <strong>with</strong> Disability<br />
70<br />
60<br />
50<br />
40<br />
30<br />
20<br />
10<br />
0<br />
Male Paid Employment<br />
Female Paid Employment<br />
The difference <strong>of</strong> level <strong>of</strong> employment, especially for women (as shown between Tables 35 and 36 in the<br />
Annexure) is due to two phenomena. Firstly, people tend to consider that women do not work when they have<br />
a small job <strong>with</strong> little and irregular income. When surveyors pursued and asked about the activity during the<br />
day, then it sometimes appeared that the interviewee was in fact carrying out some kind <strong>of</strong> work. Secondly,<br />
women declare their household activities: therefore they are not registered as having a paid employment in<br />
the family questionnaire. In the adult questionnaire, they are asked about both types <strong>of</strong> activities.<br />
The fact <strong>of</strong> being head <strong>of</strong> the household is closely linked to the employment situation, more so than age or<br />
status. Table 37 in the Annexure shows that both men and women, when they are head <strong>of</strong> their household, are<br />
most <strong>of</strong>ten active. Even if only 2.6% <strong>of</strong> women are at the head <strong>of</strong> the household, 30.6% <strong>of</strong> them are active,<br />
while only 6.0% <strong>of</strong> other women aged above 14 years old are active. A similar disparity exists between men<br />
heads <strong>of</strong> household: 87.6% <strong>of</strong> these have employment, whereas the proportion <strong>of</strong> active men is 59.7%<br />
among the other men in the household.<br />
Pr<strong>of</strong>essions <strong>of</strong> Afghans: A Majority <strong>of</strong> Farmers<br />
Among those who are working, Figure 25 in next page shows that 35.7% <strong>of</strong> active Afghans are owners <strong>of</strong> the<br />
land they cultivate or have it under mortgage. In second position, people having another type <strong>of</strong> independent<br />
activity represent 18.6% <strong>of</strong> the active employed population. Considered together, it appears than more<br />
than half <strong>of</strong> the active employed population is composed <strong>of</strong> self-employed people. 15.6% are<br />
wageworkers, which is a more stable status. These persons usually benefi t from a monthly wage and they<br />
have (well) defi ned working conditions: fi xed working hours, fi xed wage, specifi c tasks and working location.<br />
The rest <strong>of</strong> the active employed people (30%) all have a precarious working status: family helpers, seasonal<br />
and occasional workers, and daily workers. Only 0.1% <strong>of</strong> Afghans employ other people in their business,<br />
which represents just a few thousand people.<br />
21 The questions in the adult questionnaire are: Do you currently have a (regular or irregular) work? Did you work or have a job for at least<br />
one hour per day during last week? Did you work or have a job for at least one day during last month? If you are not working, for what<br />
reason? Even if you stated that you have not worked last month, have you carried out one <strong>of</strong> the following activities to help? (and follow<br />
a list <strong>of</strong> occurrences <strong>of</strong> possible tasks).<br />
Poverty <strong>of</strong> Living Conditions: Identifying Benchmarks<br />
21
Figure 25. Distribution <strong>of</strong> Active People above 14 by<br />
Employment Status<br />
18.6%<br />
5.8%<br />
1.3%<br />
2.8%<br />
15.6%<br />
0.1%<br />
0.1%<br />
35.7%<br />
Landowner/<br />
Mortgager<br />
Daily/Weekly Wage<br />
Worker<br />
Contract Worker<br />
Occasional Worker<br />
Apprentice<br />
Family Helper<br />
Self Employed<br />
Employer<br />
Other Status<br />
20.0%<br />
A multitude <strong>of</strong> pr<strong>of</strong>essions exist in Afghanistan. Dozens <strong>of</strong> pr<strong>of</strong>essions were identifi ed during the survey and<br />
were grouped into 68 types as shown in Table 38 in the Annexure and Table 4 below. The most common<br />
pr<strong>of</strong>ession is farmer (39.7%). Farmers are usually owners <strong>of</strong> their land or rent a piece <strong>of</strong> land from someone<br />
against part <strong>of</strong> the crop or/and a rent. Shepherds and labourers are other pr<strong>of</strong>essions <strong>of</strong> the agricultural<br />
sector, which represents almost 45% <strong>of</strong> all actives in Afghanistan (see Figure 26 p. 24).<br />
Table 4. Distribution <strong>of</strong> Active People by Main Pr<strong>of</strong>essions<br />
Pr<strong>of</strong>essions Number Percent by Category<br />
Shepherd 203310 3.8<br />
Craftsmen 107826 2.0<br />
Carpet/rag weaver 285803 5.3<br />
Driver 215651 4.0<br />
Electrician 16239 0.3<br />
Farmer 2126633 39.7<br />
Building worker 516394 9.7<br />
Labourers 388432 7.3<br />
Mechanic 98082 1.8<br />
Mollah 51315 1.0<br />
Policeman, soldier 97433 1.8<br />
Public employee 157192 2.9<br />
Teacher 170183 3.2<br />
Tailor 108475 2.0<br />
Shopkeeper 381287 7.1<br />
Street vendor and other street service providers 131859 2.5<br />
Intermediary pr<strong>of</strong>essions 127962 2.4<br />
Higher status pr<strong>of</strong>essions 76647 1.4<br />
Other little jobs 61058 1.1<br />
No answer 28580 0.5<br />
Source: NDSA<br />
22 Understanding Vulnerability <strong>of</strong> Afghans <strong>with</strong> Disability
Workers in the construction sector represent almost 10% <strong>of</strong> all active people. The considerable reconstruction<br />
effort since the end <strong>of</strong> 2001 explains the fact that many people fi nd a job in building activities. A number<br />
<strong>of</strong> people <strong>with</strong> a small capital open shops <strong>of</strong> various kinds and do small trade. The wealthiest open a shop<br />
(7.1% <strong>of</strong> actives); the poorest are street vendors (2.5%). Peace is also characterised by the revitalisation <strong>of</strong><br />
travels and transport. A lot happens by road in a country where a majority <strong>of</strong> transportation is done by cars<br />
and trucks. As a result the pr<strong>of</strong>ession <strong>of</strong> driver is quite common: 4.1% <strong>of</strong> the labour force.<br />
The State has become an important employer. The huge effort made in the education sector can be seen by<br />
the high number <strong>of</strong> teachers (3.2%). This pr<strong>of</strong>ession is in rapid progression, not only in public schools, but<br />
also in a fl ourishing sector <strong>of</strong> private schools and vocational training centres (<strong>of</strong>ten run by NGOs) in various<br />
disciplines: languages (mainly English), computer studies, trade, craft, tailoring, secretarial work…<br />
The security needs in the country explain that security services represent almost 2% <strong>of</strong> the active labour<br />
force. Another 3% are civil servants in Ministries, provincial department, and other government <strong>of</strong>fi ces.<br />
Table 5. Distribution <strong>of</strong> Active People by Sectors <strong>of</strong><br />
Activities<br />
Sector <strong>of</strong> Activities Number % by Sector<br />
Agriculture (farming, etc.) 2399445.4 44.8<br />
Mining 22734.3 0.4<br />
Manufacturing (textile, crafts, carpet weaving, etc.) 341664.4 6.4<br />
Manufacturing (industry like carpentry) 59109.2 1.1<br />
Land and construction (house building) 606032.1 11.3<br />
Transport (taxi, bus, train, airplane) 229291.9 4.3<br />
Trade (sales, commerce, bazaar, shops) 795051.7 14.9<br />
Education or health 209805.3 3.9<br />
State and administration (<strong>of</strong>fi ce, mullah, army) 379988.0 7.1<br />
Hunting or gathering 18837.0 0.4<br />
Banking services 8444.2 0.2<br />
Communication (Roshan, AWCC, AÏNA...) 5196.4 0.1<br />
Other services 270863.2 5.1<br />
No answer 3897.3 0.1<br />
Total 5350360.5 100.0<br />
Source: NDSA<br />
Distribution <strong>of</strong> the labour force according to sectors <strong>of</strong> activity as in Table 5 above refl ects the weight <strong>of</strong> the<br />
primary sector: 45.6% <strong>of</strong> the labour force works in the agricultural and mining sector. The industrial sector<br />
employs 18.8% <strong>of</strong> the labour force, including 11.3% in the building and construction segments. Finally,<br />
the tertiary sector, dominated by trade (almost 15% <strong>of</strong> all actives) also employs a large proportion <strong>of</strong> the<br />
labour force (35.5%). This distribution <strong>of</strong> the labour force by sectors <strong>of</strong> activities is the result <strong>of</strong> two main<br />
factors: absence <strong>of</strong> industry and development <strong>of</strong> public services such as education and health. Decades<br />
<strong>of</strong> confl ict had held up investment in the economic system, jeopardising the emergence <strong>of</strong> an industrial<br />
sector. Today a large proportion <strong>of</strong> manufactured goods come from nearby bordering countries such as<br />
Iran, Pakistan, China, Tajikistan and India. The public employees represent 7.1% <strong>of</strong> the labour force and<br />
this fi gure goes to 10% when part <strong>of</strong> the workers <strong>of</strong> the education and health sectors employed in public<br />
structures are included.<br />
Poverty <strong>of</strong> Living Conditions: Identifying Benchmarks<br />
23
Farmers: Heterogeneity and Diversity <strong>of</strong> Status<br />
What exactly is the status <strong>of</strong> the 44.9% <strong>of</strong> active people working in the agricultural sector? They are mainly<br />
in agriculture activities, the mining sector representing only 0.4% <strong>of</strong> employment. Heterogeneity is the norm<br />
for farmers’ status.<br />
Figure 26. Distribution <strong>of</strong> Farmers by Types <strong>of</strong> Status<br />
Landlord / Khan (4.8%)<br />
4.0%<br />
4.8%<br />
16.7%<br />
Landowner/Malik/<br />
Zamindar/Mulkadar<br />
(16.7%)<br />
Farmer/Sharecropper/<br />
Mortgager (39.8%)<br />
Tenant/Khistmand<br />
(7.3%)<br />
Labourer/Worker/Kargar<br />
(27.4%)<br />
Family Helper (4.0%)<br />
27.4%<br />
39.8%<br />
7.3%<br />
A major distinction can be made between those who own land and those who do not. A small group <strong>of</strong><br />
farmers (4.8%) are landlords, owning more than 200 jeribs (40 ha). A second group <strong>of</strong> farmers (16.7%)<br />
is composed <strong>of</strong> landowners who have less than 200 jeribs. The majority <strong>of</strong> farmers are sharecroppers and<br />
mortgagers (39.8%) who own small land and are constrained to rent more land for farming. On the land they<br />
rent, they provide all materials needed (seeds, plough, animals and labour), however they keep only part <strong>of</strong><br />
the crop (<strong>of</strong>ten less than 50%). They might have a garden but rent fi elds for wider cultivation such as food<br />
crops or poppy cultivation.<br />
A third group is composed <strong>of</strong> tenants who do not possess land but rent it according to different modalities:<br />
usually, in exchange <strong>of</strong> a part <strong>of</strong> the crop against the use <strong>of</strong> the land, payment <strong>of</strong> a rent, etc. Helpers are<br />
usually members <strong>of</strong> the family, mainly young boys, who help their father or brothers to cultivate the family<br />
land.<br />
The most vulnerable are undoubtedly the landless labourers who work for farmers and landowners on a<br />
daily, weekly or seasonal basis. Part <strong>of</strong> this group is also homeless and moves from village to village to <strong>of</strong>fer<br />
their services. They have trouble fi nding work as villagers prefer to hire members <strong>of</strong> the family (who they<br />
sometimes do not have to pay) or other members <strong>of</strong> the village they know. Moreover, in case <strong>of</strong> natural<br />
disasters as it has been the case recently, this category <strong>of</strong> farmers is <strong>of</strong>ten <strong>with</strong>out work.<br />
Activity and Disability<br />
To what extent are persons <strong>with</strong> <strong>disability</strong> working in Afghanistan? Figure 21 page 19 above (and Table 33<br />
in the Annexure) show that the rate <strong>of</strong> employment <strong>of</strong> persons <strong>with</strong> <strong>disability</strong> (33.8%) is a lot lower than the<br />
one <strong>of</strong> non-disabled people (41.7%).<br />
Different Types <strong>of</strong> Activities and More Precarious Status for Persons <strong>with</strong> Disability<br />
When they are active, persons <strong>with</strong> <strong>disability</strong> are in similar proportions and occupy jobs that have a more or<br />
less comparable status to those held by the non-disabled. Yet, as expected, persons <strong>with</strong> <strong>disability</strong> are less<br />
present in pr<strong>of</strong>essions requiring physical strength and abilities: farmers, house-workers, drivers, mechanics…<br />
They are however, in signifi cantly higher proportion working as street vendors, shopkeepers and other small<br />
24 Understanding Vulnerability <strong>of</strong> Afghans <strong>with</strong> Disability
jobs. Non-disabled persons are a larger proportion <strong>of</strong> landowners or land mortgagers, while persons <strong>with</strong><br />
<strong>disability</strong> are more <strong>of</strong>ten occasional workers. The latter are also slightly in higher proportion in self-employed<br />
activities which is <strong>of</strong>ten the status used for shopkeepers or street vendors.<br />
Table 40 in the Annexure shows that persons <strong>with</strong> <strong>disability</strong> are proportionally half the number <strong>of</strong> the nondisabled<br />
among wealthy landlords (2.7% against 5.7% for non-disabled). Nevertheless, the proportion<br />
<strong>of</strong> smaller landowners is the same for both categories (around 17%). On the other hand, persons <strong>with</strong><br />
<strong>disability</strong> are proportionally more in the three most vulnerable statuses: tenants, labourers and family helpers.<br />
These results may lead to the same conclusion for Afghanistan as Erb and Harris-White made for India 22 :<br />
in an agrarian economy, only extreme <strong>disability</strong> is a barrier for employment in fi eldwork. But furthermore in<br />
Afghanistan, persons <strong>with</strong> <strong>disability</strong> are more vulnerable on the labour market. They occupy the most insecure<br />
employment status.<br />
Difficulties in the Workplace<br />
When asked about the diffi culties they face in their work place, a majority (58.8%) <strong>of</strong> active Afghans declared<br />
spontaneously facing no particular diffi culty. This is not the case for persons <strong>with</strong> <strong>disability</strong> who were only<br />
26.3% to report the same.<br />
Figure 27. Distribution <strong>of</strong> Active People by Types <strong>of</strong><br />
Difficulties Faced in the Workplace<br />
58.8%<br />
10.4%<br />
17.3%<br />
0.0%<br />
5.1%<br />
0.2%<br />
2.8%<br />
5.3%<br />
Diffi cult to Reach my<br />
Work Place (10.4%)<br />
Work Painful/Dangerous<br />
(17.3%)<br />
Problem <strong>with</strong> Coworkers/<br />
Employer (0.0%)<br />
Wage Problem (5.1%)<br />
Corruption (0.2%)<br />
Bad Weather (2.8%)<br />
Other/Dont Know (5.3%)<br />
No Diffi culty (58.8%)<br />
Persons <strong>with</strong> <strong>disability</strong> face far more <strong>of</strong>ten diffi culties in their workplace than non-disabled persons as shown<br />
in Table 41 in the Annexure and Figure 28 in next page. This is observed for all types <strong>of</strong> diffi culties directly<br />
related to the work situation. Accessibility <strong>of</strong> the workplace is a problem in a country <strong>with</strong> poor road networks:<br />
it is a key problem in 24.7% <strong>of</strong> cases for persons <strong>with</strong> <strong>disability</strong> and only in 11% <strong>of</strong> cases for non-disabled<br />
people. Diffi culties due to physical discomfort or pain as well as dangerous positions are also frequent for<br />
persons <strong>with</strong> <strong>disability</strong> (37.4%). But these problems also exist for non-disabled people (23.7%). Inequality<br />
<strong>of</strong> wages (14.6% and 7.5% respectively for persons <strong>with</strong> <strong>disability</strong> and non-disabled) and mis<strong>understanding</strong><br />
<strong>of</strong> the boss or co-workers (2.5% and 0.0%) are also more frequent for persons <strong>with</strong> <strong>disability</strong> than for nondisabled.<br />
The level <strong>of</strong> diffi culty is similar for both groups <strong>with</strong> regards to corruption (obligation to pay bribes)<br />
or bad weather.<br />
22 ERB S. and HARRIS-WHITE B. (2001), Outcast from Social Welfare: Adult Disability and Incapacity in Rural South India, Books for<br />
Change, Bangalore.<br />
Poverty <strong>of</strong> Living Conditions: Identifying Benchmarks<br />
25
Figure 28. Distribution <strong>of</strong> Active Disabled and Non-Disabled Persons by<br />
Types <strong>of</strong> Difficulties Faced in the Workplace<br />
70<br />
Non-Disabled<br />
Persons <strong>with</strong> Disability<br />
60<br />
50<br />
40<br />
30<br />
20<br />
10<br />
0<br />
Diffi cult to<br />
Reach My Work<br />
Place<br />
Work Painful/<br />
Dangerous<br />
Problem <strong>with</strong><br />
Coworkers/<br />
Employer<br />
Wage<br />
Problem<br />
Corruption<br />
Bad Weather<br />
Other/Don’t<br />
Know<br />
No Diffi culty<br />
In conclusion, the level <strong>of</strong> diffi culties is signifi cantly different between the non-disabled and persons <strong>with</strong><br />
<strong>disability</strong>. Globally analysis shows that persons <strong>with</strong> <strong>disability</strong> experience a higher cost <strong>of</strong> working due to<br />
greater diffi culties faced in the workplace: securing employment requires greater efforts than for non-disabled<br />
people. There are a wide range <strong>of</strong> diffi culties: some are due to lack <strong>of</strong> adaptation <strong>of</strong> the work, inaccessibility<br />
<strong>of</strong> the place, stigma and mis<strong>understanding</strong> <strong>of</strong> co-workers, unequal wage scales…<br />
Less Child Labour in Afghanistan?<br />
According to the International Labour Organization (ILO) 23 , “Economic activity is a statistical concept that<br />
encompasses most productive activities undertaken by children, whether for the market or not, paid or<br />
unpaid, for a few hours or full time, on a casual or regular basis, legal or illegal; it excludes chores undertaken<br />
in the child’s own household. To be economically active, a child must have worked for at least one hour on any<br />
day during a seven-day reference period.”<br />
The ILO states 24 that there were about 317 million economically active children aged 5 to 17 in 2004, <strong>of</strong><br />
whom 218 million could be regarded as child labourers. Of the latter, 126 million were engaged in hazardous<br />
work. 165.8 million children between the ages <strong>of</strong> 5 and 14 are estimated to work in the world—at least<br />
74.4 million in hazardous work. The number <strong>of</strong> child labourers in both age groups <strong>of</strong> 5-14 and 5-17 fell by<br />
11% over the four years from 2000 to 2004. However, the decline was much greater for those engaged<br />
in hazardous work: the fi gure fell by 26% for the 5-17 age group, and 33% for the 5-4 age group. The<br />
incidence <strong>of</strong> child labour 25 (percentage <strong>of</strong> children working) in 2004 is estimated by ILO to be at 13.9%<br />
for the 5-17 age group, compared to 16% in 2000. The proportion <strong>of</strong> girls among child labourers, however,<br />
remained steady. The vast majority (70%) <strong>of</strong> these children are working in agriculture. Many children work as<br />
domestic help; urban children work in trade and services, <strong>with</strong> fewer in manufacturing and construction. Most<br />
<strong>of</strong> the active children are situated in Asia: 61% are in Asia, 32% in Africa, and 7% in Latin America. In Asia<br />
and the Pacifi c, the activity rate among children aged 5-14 was <strong>of</strong> 19.4% in 2000 and <strong>of</strong> 18.8% in 2004.<br />
The decline is limited, whereas it is massive in Latin America and the Caribbean 26 .<br />
23 See, INTERNATIONAL LABOR OFFICE (2006a), Out Of Work and in School: Our Development Challenge, Asia-Pacifi c Economic<br />
Cooperation, Publication <strong>of</strong> Project Experiences, 2001-2006 http://www.ilo.org/public/english/region/asro/bangkok/apec/download/<br />
book.pdf, p. 15.<br />
24 See INTERNATIONAL LABOR OFFICE (2006b), The end <strong>of</strong> child labour: Within reach, International Labour Conference 95th Session<br />
2006 Report I (B), Geneva, http://www.ilo.org/public/english/standards/relm/ilc/ilc95/pdf/rep-i-b.pdf.<br />
25 To the international community, the term “child labour” does not encompass all work performed by children under the age <strong>of</strong> 18 years.<br />
The consensus view is that work that falls <strong>with</strong>in the legal limits and does not interfere <strong>with</strong> children’s health and development or prejudice<br />
their schooling can be a positive experience. See Inter-PARLIAMENTARY UNION/ILO (2002), Eliminating the worst forms <strong>of</strong> child labour:<br />
A practical guide to ILO Convention No. 182, Handbook for parliamentarians No. 3-2002, (Geneva, p. 15.<br />
26 From 16.1% to 5.1% according to ILO (2006), op. cit., fi gure 1.2 p. 20.<br />
26 Understanding Vulnerability <strong>of</strong> Afghans <strong>with</strong> Disability
At fi rst glance, child labour does not seem as widespread in Afghanistan as it is in certain other countries <strong>of</strong><br />
the Asia and Pacifi c region. Only 5% <strong>of</strong> children aged 7 to 14 years old were reported to be working by the<br />
head <strong>of</strong> household in the family questionnaire (Figure 29 below). This low number must be considered <strong>with</strong><br />
caution due to the limited information given by the family questionnaire. Some <strong>of</strong> the children were declared<br />
as being scholars or student by the head <strong>of</strong> household (59.8% <strong>of</strong> the considered age group), but they may<br />
also work after their class, mainly during the harvest season helping the family in the fi eld.<br />
Figure 29. Distribution <strong>of</strong> Children Between 7 and 14 Years<br />
Old according to Employment Situation<br />
8.9% 0.6% 0.4%<br />
0.0% 5.0%<br />
25.4%<br />
Working (5.0%)<br />
Seeking Job (0.4%)<br />
Household Tasks (25.4%)<br />
Student (59.8%)<br />
Too Young to Work (8.9%)<br />
Long Disease (0.6%)<br />
No Working, Not Looking<br />
for a Job (0.0%)<br />
59.8%<br />
When all children who go to school but also do some work are considered together, 20.1% <strong>of</strong> children aged<br />
7 to 14 are working, 15.5% in the fi eld, and 4.6% in other types <strong>of</strong> jobs (Figure 30).<br />
Figure 30. Distribution <strong>of</strong> Afghan Children Between 7<br />
and 14 Years Old according to the Activity Situation<br />
15.5%<br />
Working in the Field<br />
Working in Other Job<br />
Not Working<br />
4.6%<br />
79.8%<br />
Table 6 gives an overview <strong>of</strong> children’s activities. 60.0% go to school and 76.6% help <strong>with</strong> all household<br />
tasks: cooking, taking care <strong>of</strong> elders and younger children, fetching water and cutting wood, etc. 20.2% also<br />
have a pr<strong>of</strong>essional activity, mainly in the agricultural sector: animals husbandry, fi eldwork, etc. Days can be<br />
very long for children, especially in rural areas and for girls.<br />
Poverty <strong>of</strong> Living Conditions: Identifying Benchmarks<br />
27
Table 6. Activities <strong>of</strong> Children Aged<br />
6 to 14<br />
Children Activities Number %<br />
Going To School 3841451 59.8<br />
Working in the Field 1996463 15.5<br />
Working in Other Job 597198 4.6<br />
Household Tasks 10884804 76.6<br />
Source: NDSA. Note: some children have more than one activity, total not<br />
equal to 100%.<br />
The incidence <strong>of</strong> child labour in Afghanistan is thus above the regional average <strong>of</strong> 18.8%. But according to<br />
ILO 27 , “the labour force participation rate <strong>of</strong> children aged from 10 to 14 years is extremely high at 30-60%<br />
in countries <strong>with</strong> a per capita income <strong>of</strong> US$500 or less”. Afghanistan ranges at this category 28 , yet its level<br />
<strong>of</strong> child activity is slightly lower.<br />
Figure 31 shows that children <strong>with</strong> <strong>disability</strong> work less <strong>of</strong>ten than other children, especially for fi eldwork. They<br />
also help signifi cantly less <strong>with</strong>in the house. This is explained by the physically demanding nature <strong>of</strong> the work<br />
both in the fi eld and in major household tasks such as fetching water, cleaning, cooking, cutting wood. The<br />
same trend is observed in town and in villages.<br />
Figure 31. Distribution <strong>of</strong> Children Between 6 and 14<br />
Years Old according to the Employment Situation<br />
90<br />
80<br />
70<br />
60<br />
50<br />
40<br />
30<br />
20<br />
10<br />
0<br />
Help in the Field Other Work Help in the<br />
House<br />
Non Disabled<br />
Children <strong>with</strong> Disability<br />
No Activity<br />
The frequency <strong>of</strong> children working inside the house is attested in the Figure 31.<br />
Household Tasks<br />
Contribution <strong>of</strong> children to the household chores is very high. Tables 43 and 44 in the Annexure show that both<br />
boys and girls participate in household tasks and that for girls it is systematic: 91.5% <strong>of</strong> all girls carry out some<br />
<strong>of</strong> the household tasks. Even children <strong>with</strong> <strong>disability</strong>, especially girls (61.2%) participate in chores <strong>with</strong>in the<br />
house. The large majority (58.7%) <strong>of</strong> children <strong>with</strong> <strong>disability</strong> work one or two hours while non-disabled children<br />
<strong>of</strong>ten work more than 3 hours (50.5% <strong>of</strong> them), especially girls (60.4% work more than 3 hours). If children<br />
<strong>with</strong> <strong>disability</strong> work less in terms <strong>of</strong> duration, and are a smaller proportion to do household chores, the proportion<br />
27 ILO (2006), op. cit., p. 22.<br />
28 Evaluations <strong>of</strong> per capita income for Afghanistan varies. Per capita income is evaluated at 822 USD in Purchasing Power Parity (PPP)-<br />
adjusted. UNDP (2004), “Security <strong>with</strong> a Human Face: Challenges and Responsibilities”, Afghanistan National Human Development<br />
Report, Kabul. According to DFID, average income would rather be about 300 USD per person, see http://www.dfi d.gov.uk/countries/<br />
asia/afghanistan.asp.<br />
28 Understanding Vulnerability <strong>of</strong> Afghans <strong>with</strong> Disability
y types <strong>of</strong> tasks done is similar. Fewer boys <strong>with</strong> <strong>disability</strong> clean the house, fetch water or do the grocery than<br />
non-disabled boys, probably because <strong>of</strong> physical limitations <strong>of</strong> movement. Similarly, girls <strong>with</strong> <strong>disability</strong> are<br />
proportionately less to cook, clean, fetch water, do the laundry than non-disabled girls.<br />
Mainly Boys Help in the Fields<br />
Working in the fi eld is essentially a male affair. Girls do not frequently go out to work in the fi eld, except<br />
maybe in some Uzbek or Hazara regions. In Pashto areas and even in Tadjik ones, women and girls almost<br />
never work in the fi elds. When they do work in the fi eld, boys <strong>with</strong> <strong>disability</strong> work only one or two hours,<br />
whereas non-disabled boys can work up to eight or more hours when they do not go to school. A large<br />
majority, however, works less than four hours. It is mainly for harvesting, sowing and reaping that boys <strong>of</strong><br />
the house are expected to help. Some <strong>of</strong> them are also in charge <strong>of</strong> an animal husbandry when the family<br />
possesses some livestock, and in this activity boys <strong>with</strong> <strong>disability</strong> are particularly present.<br />
Other Jobs<br />
Mainly in urban areas, a few boys have other types <strong>of</strong> jobs. A majority <strong>of</strong> young boys <strong>with</strong> <strong>disability</strong> are in<br />
apprenticeship (54.5%), more than the non-disabled boys (31.8%). The rest <strong>of</strong> the non-disabled active boys<br />
are equally distributed between fi xed jobs, helping someone, occasional jobs and independent jobs. A higher<br />
proportion <strong>of</strong> disabled boys also take on occasional and unstable jobs.<br />
A major benchmark to differentiate between poor people and those better <strong>of</strong>f is the level <strong>of</strong> income. Yet, this<br />
information is not <strong>of</strong>ten reliable in surveys, especially in developing and transition countries and in traditional<br />
contexts. Whatever the context, people are reluctant to provide information pertaining to their income. As a<br />
result, income cannot be the only indicator to measure poverty but it can complement the analysis <strong>of</strong> basic<br />
goods and employment.<br />
High Inequality <strong>of</strong> Income in Afghanistan<br />
Measuring level <strong>of</strong> income is a challenge in many contexts. Earnings are taboo in many cultures and individuals<br />
do not easily reveal sources and amounts <strong>of</strong> their income. Nevertheless, economists and other specialists <strong>of</strong><br />
poverty have developed several indicators based on income measures. These tools are useful for cross-country<br />
comparisons <strong>of</strong> distribution <strong>of</strong> income and other assets.<br />
Complexity <strong>of</strong> Measurement <strong>of</strong> Income<br />
Evaluation <strong>of</strong> income is a very complex issue. People always underestimate their income, sometimes because<br />
<strong>of</strong> lack <strong>of</strong> knowledge, sometimes in order to hide it. In fact, many activities generate irregular income. For a<br />
shopkeeper, the level <strong>of</strong> income is directly linked to the demand for his/her products. Farming income varies<br />
during the year, and is the highest after the harvest season. It also depends on the deal <strong>with</strong> the landowner<br />
for those who rent the land as well as landless labourers. Carpet weaving is also linked to the completion <strong>of</strong><br />
a carpet. Thus, income may come in a household not on a monthly base: it may be seasonal, daily, weekly,<br />
quarterly… and very <strong>of</strong>ten irregular. The sale <strong>of</strong> newspapers or the repair <strong>of</strong> shoes is largely dependent each<br />
day on the number <strong>of</strong> clients. In all these cases, it becomes very diffi cult for the interviewees to give an<br />
estimation <strong>of</strong> their monthly income.<br />
Researchers have developed several techniques to evaluate income <strong>of</strong> households through surveys. The best<br />
way to measure activity income is to leave a notebook for accountability during a certain period <strong>of</strong> time,<br />
and then come to recollect it. But this was not possible during the NDSA, because <strong>of</strong> the cost <strong>of</strong> such a<br />
technique, the diffi cult access <strong>of</strong> some places and the security constraints. Another way to proceed is to collect<br />
information about expenses and savings. Doing so gives an idea <strong>of</strong> the income <strong>of</strong> an household.<br />
Moreover, very <strong>of</strong>ten, income is underestimated due to the fact that people tend to hide the real amount.<br />
Many reasons can explain this. Firstly some interviewees may have had hopes that the survey would bring<br />
some help: therefore, as already explained 29 , the team <strong>of</strong> survey always tried to make it clear that there<br />
Poverty <strong>of</strong> Living Conditions: Identifying Benchmarks<br />
29
would be no direct help linked to the survey. Secondly, people were not willing to openly claim their earnings<br />
for fear <strong>of</strong> being asked for money by their relatives or by the community if they found out about it and become<br />
the subject <strong>of</strong> envy and even jealousy.<br />
Lastly, income in Afghanistan is not systematically an individual indicator. Many people are working but earning<br />
little or no direct individual income in exchange for their work. All the men in the family may work in the fi eld<br />
but the crop will be sold by the head <strong>of</strong> the family who is in charge <strong>of</strong> the whole family and decides what<br />
expenditures need to be made. The same can be said for a shopkeeper working <strong>with</strong> his sons. The former will<br />
not grant a wage but will take care <strong>of</strong> all the needs <strong>of</strong> the latter. The same can be stated for a carpet weaver. The<br />
ladies and the children living in the household will all work on the carpet weaving but the income will usually<br />
be collected by the fi rst wife or the head <strong>of</strong> the household. Therefore, many working persons are considered as<br />
family helpers and do not directly earn any income. However, the NDSA team did not directly ask the amount <strong>of</strong><br />
the household income since this does not always account for inequalities between family members.<br />
Measuring Inequality <strong>of</strong> Income<br />
A widespread measure <strong>of</strong> inequality is given by the Gini coeffi cient. The Gini coeffi cient is a measure <strong>of</strong> inequality<br />
<strong>of</strong> a distribution. It is defi ned as the ratio <strong>of</strong> area between the Lorenz curve <strong>of</strong> the distribution and the curve <strong>of</strong> the<br />
uniform distribution, and the area under the uniform distribution. It is <strong>of</strong>ten used to measure income inequality.<br />
In simple terms, experts use it to measure inequality regarding income. The Gini coeffi cient is measured<br />
between 0 (which corresponds to perfect equality e.g. everyone has the same income) and 1 (which corresponds<br />
to perfect inequality, e.g. one person gets all the income, and everyone else has no income).<br />
Table 7. Gini Coefficient for Income from Activity<br />
Estimated<br />
Value<br />
Standard<br />
Deviation Lower Bound Upper Bound<br />
Confi dence<br />
Level in (%)<br />
Actives Including Family Helpers 0.414 0.025 0.364 0.463 95<br />
Actives 0.404 0.026 0.354 0.455 95<br />
Source: NDSA. Note: DAD® S<strong>of</strong>tware.<br />
Inequality <strong>of</strong> income is rather high in Afghanistan, when measured <strong>with</strong> the Gini coeffi cient (See Table 7<br />
above). When family helpers working <strong>with</strong>out earning a direct income are included in the analysis, the Gini<br />
coeffi cient for Afghanistan is <strong>of</strong> 0.41. On the other hand, if family helpers <strong>with</strong>out direct income are excluded<br />
from the calculation, the Gini coeffi cient is <strong>of</strong> 0.40. Table 8 below provides an overview <strong>of</strong> inequality in the<br />
South Asia Region<br />
Table 8. Poverty and Inequality in the South Asia Region<br />
Inequality (Gini coeffi cient)<br />
Poverty headcount rate<br />
% Year % Year % Year % Year<br />
Notes<br />
Afghanistan n/a n/a 41.4 2005 n/a n/a n/a n/a For Gini coeffi cient, NDSA data.<br />
Bangladesh 25.9 1991-92 30.6 2000 58.8 91-92 49.8 2000 World Bank (2003)<br />
India (i) 29.0 93-94 32.0 1999-00 29.2 93-94 22.7 99-00<br />
Staff estimation and Deaton and Dreze (2002), the<br />
variance <strong>of</strong> the logarithm <strong>of</strong> per capita expenditure is<br />
used for inequality measure<br />
India (ii) n/a 93-94 33.0 1999-00 36.0 93-94 28.6 99-00 WDR 2006<br />
Nepal 34.2 1995-96 41.4 2003-04 41.8 95-96 30.9 2003-04 World Bank (2005)<br />
Pakistan 30.6 1998-99 28.4 2001-02 32.0 98-99 35.2 2001-02 Kijima, et.al. (2005)<br />
Sri Lanka 32 1990-91 40.0 2002 26.1 90-91 22.7 2002 Narayan and Yoshida (2004)<br />
Maldives n/a n/a 34.8 2002/03 n/a n/a 17.3 2002/03 Murgai (2004)<br />
Bhutan n/a n/a 41.6 2003 n/a n/a 31.7 2003 National Statistical Bureau, Bhutan (2004)<br />
Source:http://siteresources.worldbank.org/INTSAREGTOPPOVRED/Countries/20816264/regionaldataonpovertyandinequality.pdf<br />
Note: Poverty lines are defi ned differently across countries; so poverty headcount ratios are not comparable across countries.<br />
29 See BAKHSHI P. and al. (2006), op. cit.<br />
30 Understanding Vulnerability <strong>of</strong> Afghans <strong>with</strong> Disability
Comparing the Gini coeffi cient for Afghanistan and other countries in the South Asia region, shows that this<br />
indicator <strong>of</strong> inequality is almost the highest for Afghanistan. It comes just after Bhutan and is equal to Nepal.<br />
It is 13% above Pakistan, which presents the lowest level <strong>of</strong> inequality according to the Gini coeffi cient. It is<br />
not possible to compare present levels <strong>of</strong> inequality <strong>with</strong> the situation in the past as no data is available for<br />
Afghanistan.<br />
The level <strong>of</strong> inequality is also revealed by the distribution <strong>of</strong> monthly income as presented in Figure 32.<br />
Figure 32. Distribution <strong>of</strong> Monthly Activity Income for All Active People and Aged 15-64<br />
8.1%<br />
9.9%<br />
5.3% 1.1%<br />
6.0%<br />
26.5%<br />
15.1%<br />
11.1%<br />
12.5%<br />
10.3%<br />
16.9%<br />
O AFAs<br />
100 to 1000 AFAs<br />
1100 to 2000 AFAs<br />
2100 to 3000 AFAs<br />
3050 to 4000 AFAs<br />
4050AFAs to 5500 AFAs<br />
6000 AFAs and More<br />
Refuse or Don’t Know<br />
10.2%<br />
22.7%<br />
15.5%<br />
13.3%<br />
15.5%<br />
The distribution <strong>of</strong> monthly income explains why the number <strong>of</strong> people working but earning no income or<br />
less than 1000 AFAs is high (37.6% if no age group is considered and almost one quarter <strong>of</strong> all active people<br />
aged 14-65 according to Figure 32 and Table 47 in the Annexure). The proportion <strong>of</strong> family helpers earning<br />
no direct wage is higher at early and old ages. Working children, and, to a certain extend aged persons who<br />
are still active, do not receive any wage but are working to help other member <strong>of</strong> the family. It is not necessary<br />
a clear sign <strong>of</strong> inequality or a factor <strong>of</strong> deeper poverty in the Afghan society. Many children and elders help a<br />
member <strong>of</strong> the family in his activity and do not receive any direct wage, but benefi t from the general income<br />
<strong>of</strong> the household.<br />
Figure 33. Distribution <strong>of</strong> the Monthly Activity Income for<br />
Active Males Aged 15-64<br />
0 AFAs (8.8%)<br />
17.1%<br />
0.0%<br />
8.8%<br />
17.8%<br />
100 to 1000 AFAs (17.8%)<br />
1100 to 2000 AFAs (24.3%)<br />
2100 to 3000 AFAs (17.8%)<br />
3050 to 4000 AFAs (14.2%)<br />
4050 AFAs to 5500 AFAs (17.1%)<br />
6000AFAs and More (0.0%)<br />
14.2%<br />
24.3%<br />
17.8%<br />
Looking at the situation <strong>of</strong> males between 15 and 64 years old, the number <strong>of</strong> persons working but not earning<br />
any money decreases drastically (Figure 33). The average monthly income becomes 4187.6 AFAs and 17.1%<br />
earn more than 6000 AFAs a month. The median is 3,000 AFAs, which means that 50% <strong>of</strong> males above age 15<br />
and working earn less and 50 earn more. The upper decile – the 10% <strong>with</strong> the highest income – earns more<br />
Poverty <strong>of</strong> Living Conditions: Identifying Benchmarks<br />
31
than 7,500 AFAs a month. The 1% <strong>with</strong> the highest income earns more than 20,000 AFAs a month (400 USD),<br />
almost 7 times more than the median income and 4.8 times more than the average income.<br />
Comparing Income <strong>of</strong> Persons <strong>with</strong> Disability and Non-Disabled<br />
Comparing monetary income must be done <strong>with</strong> a lot <strong>of</strong> caution. Firstly, because, as already explained above,<br />
many active people do not receive an individual wage; it is included in the family income. According to Figure<br />
34 (and Table 48 in the Annexure), many active people are not paid, and there are probably more nondisabled<br />
persons in this case than persons <strong>with</strong> <strong>disability</strong>. This is explained by a higher rate <strong>of</strong> employment<br />
among non-disabled people who contribute to the family income by participating in a large array <strong>of</strong> activities<br />
for which the head <strong>of</strong> household is paid. In high ranges <strong>of</strong> income, the proportion <strong>of</strong> persons <strong>with</strong>out <strong>disability</strong><br />
is higher. But the level <strong>of</strong> disparity is not statistically signifi cant for higher levels <strong>of</strong> income; it is however<br />
signifi cant for the lowest levels (less than 2000 AFAs). Hence, persons <strong>with</strong> <strong>disability</strong> are signifi cantly a higher<br />
proportion to earn smaller wages than the non-disabled.<br />
Figure 34. Distribution <strong>of</strong> Active Persons according to the Monthly Pr<strong>of</strong>essional Income<br />
Active All Ages<br />
Active Age 15-64<br />
30<br />
30<br />
Non-Disabled<br />
Persons <strong>with</strong> Disability<br />
25<br />
25<br />
20<br />
20<br />
15<br />
15<br />
10<br />
10<br />
5<br />
5<br />
0<br />
0 AFAs 100 to 1100<br />
1000 to 2000<br />
AFAs AFAs<br />
2100<br />
to 3000<br />
AFAs<br />
3050<br />
to 4000<br />
AFAs<br />
4050<br />
AFAs to<br />
5500<br />
AFAs<br />
6000<br />
AFAs and<br />
More<br />
0<br />
0 AFAs 100 to 1100<br />
1000 to 2000<br />
AFAs AFAs<br />
2100<br />
to 3000<br />
AFAs<br />
3050<br />
to 4000<br />
AFAs<br />
4050<br />
AFAs to<br />
5500<br />
AFAs<br />
6000<br />
AFAs and<br />
More<br />
Focusing the analysis only on active men above age 15 as in Figure 35 (and Table 49 in the Annexure), clearly<br />
shows differences <strong>of</strong> level <strong>of</strong> income between disabled and non-disabled. Almost 50% <strong>of</strong> men <strong>with</strong> <strong>disability</strong><br />
earn less than 2000 AFAs a month, while only 28.8% <strong>of</strong> non-disabled men earn the same. A proportion <strong>of</strong><br />
46.3% <strong>of</strong> non-disabled men earns more than 3000 AFAs a month while only 28.1% <strong>of</strong> disabled men earn<br />
that much.<br />
Figure 35. Distribution <strong>of</strong> Active Men above Aged 15-64 according to<br />
the Monthly Pr<strong>of</strong>essional Income<br />
30<br />
Persons <strong>with</strong> Disability<br />
Non-Disabled<br />
25<br />
20<br />
15<br />
10<br />
5<br />
0<br />
0 AFAs 100 to 1000 1100 to 2000<br />
AFAs<br />
AFAs<br />
2100 to 3000<br />
AFAs<br />
3050 to 4000<br />
AFAs<br />
4050 AFAs to<br />
5500 AFAs<br />
6000<br />
AFAs and More<br />
32 Understanding Vulnerability <strong>of</strong> Afghans <strong>with</strong> Disability
Among higher monthly income, the difference <strong>of</strong> earnings is between non-disabled males and those <strong>with</strong><br />
<strong>disability</strong> is statistically signifi cant.<br />
If pr<strong>of</strong>essional income is concentrated among a few active people in the household, then redistribution <strong>of</strong><br />
money and goods is also a widespread phenomenon inside the household and in the family. The individuals<br />
working usually give their income to the head <strong>of</strong> household, or to the woman in charge <strong>of</strong> expenditure. If<br />
any <strong>of</strong> them has specifi c requirements he/she requests the money from the head <strong>of</strong> the household. For this<br />
reason, disparity in earnings does not refl ect totally inequity among individuals as an important redistribution<br />
<strong>of</strong> resources takes place inside the household.<br />
Concluding Remarks<br />
The Afghan labour market is characterised by a dominant agricultural sector, which represents the majority <strong>of</strong><br />
the Afghan work force. Men <strong>with</strong> <strong>disability</strong> have more diffi culty to work in the fi elds due to some impairments<br />
that make diffi cult to carry out physical tasks. It might be challenging in the near future to organise accessibility<br />
for farming. Yet, many other actions can be planed.<br />
Accessibility <strong>of</strong> women to the labour market is a fi rst important step to be taken. A large majority <strong>of</strong> women<br />
do not have income generating employment.<br />
On the other hand, children <strong>with</strong> <strong>disability</strong> aged 6-14 do work: they are just as many as non-disabled<br />
children in all jobs except fi eldwork. Almost half <strong>of</strong> them contribute to household tasks. Promoting school<br />
enrolment is the most effi cient way to reduce the most alarming child labour activities. By knowing to read<br />
and write, developing analytical skills and critical thinking, these children are more able to deal <strong>with</strong> their<br />
environment and get better working conditions in the future.<br />
Persons <strong>with</strong> <strong>disability</strong>, when they participate in the labour market, are present in the same pr<strong>of</strong>essions as<br />
other Afghan workers. Yet, they occupy the most precarious positions: occasional workers, family helpers,<br />
etc. They also earn lower wages, especially women <strong>with</strong> <strong>disability</strong>. Equalisation <strong>of</strong> opportunities, promoting<br />
equal wages and fair labour conditions together <strong>with</strong> an employment obligation could be a signifi cant step<br />
forward.<br />
Disabled men do not work due to their impairment. Finding the way to allow them to contribute to the family<br />
welfare by their activity is a step towards alleviation <strong>of</strong> poverty. Access to employment for persons <strong>with</strong><br />
<strong>disability</strong> is an effective way to fi ght poverty, reduce <strong>vulnerability</strong>, and strengthen social inclusion. Whenever<br />
a person contributes to the family welfare, her/his social status <strong>with</strong>in the family improves. An obligation<br />
<strong>of</strong> employment, <strong>of</strong> at least 5% <strong>of</strong> persons <strong>with</strong> <strong>disability</strong> in the public sector, if correctly and effectively<br />
enforced, is a strong impetus towards ensuring that persons <strong>with</strong> <strong>disability</strong> have an equal access to the labour<br />
market. However, going a step ahead would mean including persons <strong>with</strong> <strong>disability</strong> in mainstream labour<br />
market programmes (private and public) and activities wherever it is possible, as a priority group. Persons<br />
<strong>with</strong> <strong>disability</strong> should also be <strong>of</strong>fered equal opportunities and full participation in programmes such as cash<br />
for work or food for work or the National Solidarity Programme <strong>of</strong> Afghanistan, that aim to provide jobs in<br />
projects undertaken at the community level.<br />
Poverty <strong>of</strong> Living Conditions: Identifying Benchmarks<br />
33
Fewer Assets for Persons <strong>with</strong><br />
Disability: a Vulnerability Issue<br />
Afghans are systematically at risk <strong>of</strong> falling into more severe poverty, especially in rural areas: this constitutes<br />
their <strong>vulnerability</strong>. These forms <strong>of</strong> <strong>vulnerability</strong> are studied through the evaluation <strong>of</strong> assets possessed by<br />
the household as a unit. As the NRVA 2003 puts it “those households <strong>with</strong> a fewer assets are more<br />
likely to report a worse economic situation 30 ”. At this point it seems essential to ask what the assets<br />
relevant in order to overcome unexpected external shocks are. Various ways <strong>of</strong> classifying durable goods can<br />
be suggested:<br />
Common goods, usually for consumption or production;<br />
Luxury goods which are sign <strong>of</strong> the social position: big size house, costly animals, TV set and car;<br />
Assets that can be used to fi ght against <strong>vulnerability</strong> and are useful to overcome shocks: equipment for<br />
agriculture and for the house.<br />
High amount <strong>of</strong> material possession is a relative indicator <strong>of</strong> well being <strong>of</strong> the household. Yet, possession <strong>of</strong><br />
vast land on one hand and reliable and extensive social networks on the other, are invaluable assets useful to<br />
escape poverty and face risks, and not being vulnerable to unexpected shocks. Having more assets increases<br />
the capability to overcome diffi culties. It is a determinant factor in the capacity that individuals have for<br />
resilience.<br />
In this section, comparison <strong>with</strong> NRVA 2003 will be provided wherever it is relevant. Globally, it appears that<br />
major trends are similar in both surveys, even if fi gures can be different for some assets.<br />
Durable Goods: Relative Indicators <strong>of</strong> Well-Being<br />
One can considers different ways <strong>of</strong> classifying durable goods according to:<br />
Their function: equipment for production (tractor), or home appliances (radio, refrigerator, TV set...);<br />
The way they symbolise the standard <strong>of</strong> living <strong>of</strong> the house: a kerosene lamp is a major asset for a poor<br />
family, which is used for light, whereas it is basic equipment for the majority <strong>of</strong> Afghan families.<br />
In both cases, durable goods can be considered as assets for the household since they can be used to increase<br />
capability and therefore, reduce <strong>vulnerability</strong>.<br />
Equipment <strong>of</strong> the House and Common Goods: Benchmarks for<br />
Wealth<br />
During the survey, people were asked about the possession <strong>of</strong> goods and equipment by any member <strong>of</strong> the<br />
household or by the household as a whole. These include very basic and non-costly goods such as kerosene<br />
lamps, which almost all families own except the poorest strata (97.3% <strong>of</strong> households reported having one),<br />
pressure cooker or radio are respectively present in 62% and 68.9% <strong>of</strong> Afghan households. Other more costly<br />
goods or equipments such as cars or television sets are owned by 4% and 21.1% <strong>of</strong> Afghan households.<br />
30 VULNERABILITY ANALYSIS AND MAPPING UNIT OF THE WORLD FOOD PROGRAMME AND THE VULNERABILITY ANALYSIS UNIT OF<br />
THE MINISTRY OF RURAL REHABILITATION AND DEVELOPMENT (2004), op. cit. p.52.<br />
Fewer Assets for Persons <strong>with</strong> Disability: a Vulnerability Issue<br />
35
Another striking result is that 77.4% <strong>of</strong> Afghan families possess their house. The ownership <strong>of</strong> a house is an<br />
important asset to reduce <strong>vulnerability</strong>.<br />
These results are not very different for persons <strong>with</strong> <strong>disability</strong> and non-disabled. A statistically signifi cant difference<br />
<strong>of</strong> 5.3% exists for possession <strong>of</strong> a sewing machine between the two types <strong>of</strong> households; this difference is <strong>of</strong><br />
4% for a radio. But for ownership <strong>of</strong> other goods and equipment there is little difference: ranging from 0.3%<br />
for cars or ovens, to 2.1% for generators or 2.2% for televisions. When calculated by referring to the number <strong>of</strong><br />
households possessing these items, the difference is extremely limited and non-signifi cant.<br />
Figure 36 (and Table 51 in the Annexure) compares the situation <strong>of</strong> the two types <strong>of</strong> households for<br />
possession <strong>of</strong> material goods and equipment. It further explains the similarity between the two pertaining to<br />
the ownership <strong>of</strong> goods. With slightly different weighting between the two types <strong>of</strong> cross tabulations 31 , results<br />
are very similar. The statistically signifi cant differences are for:<br />
Radio (4.5% more households <strong>of</strong> non-disabled own one);<br />
Pressure cooker (4.8% more households <strong>with</strong> non-disabled members have one);<br />
Motorbike (3.2% more households <strong>with</strong> non-disabled members have one);<br />
Tractor (0.9% more households <strong>with</strong> non-disabled members have one);<br />
Sewing machine (6.7% more households <strong>with</strong> non-disabled members have one).<br />
Kerosene lamps and pressure cookers are not considered as luxury goods except for the extremely poor<br />
households, who cannot afford one. The figures above demonstrate that households <strong>with</strong> persons<br />
<strong>with</strong> <strong>disability</strong> consistently have fewer assets and are more vulnerable for all durable goods and<br />
equipment except for basic goods such as a pressure cooker.<br />
In the case <strong>of</strong> motorbikes, the hypothesis that some <strong>of</strong> these households do not have use <strong>of</strong> a motorbike if no<br />
one is able to drive it 32 , can be put forward. For ownership <strong>of</strong> other items, the variations are again very low:<br />
the highest is 1.7% for the motorbike. The lowest is 0.2% for ovens and hotplates, which are certainly not an<br />
expensive equipments characteristic <strong>of</strong> wealth, but the lack <strong>of</strong> electricity makes their use limited. For tractors,<br />
the difference is small but statistically signifi cant due to the low numbers <strong>of</strong> households having one: this<br />
might indicate that in very wealthy households differences between households <strong>with</strong> persons <strong>with</strong> <strong>disability</strong><br />
and non-disabled households are signifi cant.<br />
Figure 36. Distribution <strong>of</strong> Households regarding Ownership <strong>of</strong> Goods or<br />
Equipment<br />
100<br />
90<br />
80<br />
70<br />
60<br />
50<br />
40<br />
30<br />
20<br />
10<br />
0<br />
Radio<br />
Television<br />
Pressure<br />
Cooker<br />
Oven,<br />
Hotplate<br />
Refrigerator<br />
Bukhari<br />
31<br />
In Figure 36 and Table 51 the number <strong>of</strong> households <strong>with</strong>out disabled members is weighted using the ratio <strong>of</strong> the number <strong>of</strong> households<br />
in the country divided by the number <strong>of</strong> households <strong>with</strong>out a person <strong>with</strong> <strong>disability</strong> in the sample. The methodology used is based on<br />
the interview <strong>of</strong> one control non-disabled person every fi ve households <strong>with</strong>out people <strong>with</strong> <strong>disability</strong>. Each <strong>of</strong> the non-disabled persons<br />
interviewed living in a household <strong>with</strong> non-disabled, represents all <strong>of</strong> them. See BAKHSHI P. et al. (2006b), “Conducting Surveys on<br />
Disability: a Comprehensive Toolkit”, <strong>Handicap</strong> International and Government <strong>of</strong> Afghanistan, Lyon and Kabul.<br />
32<br />
See BAKHSHI P. et al. (2006a), op. cit. for more about ability to drive a bicycle…<br />
Households <strong>with</strong>out Persons <strong>with</strong> Disability<br />
Households <strong>with</strong> Persons <strong>with</strong> Disability<br />
Bicycle<br />
Motorbike<br />
Car<br />
Tractor<br />
Generator<br />
Kerosene<br />
Lamp<br />
Sewing<br />
Machine<br />
House or<br />
Apartment<br />
36 Understanding Vulnerability <strong>of</strong> Afghans <strong>with</strong> Disability
Figure 37 (and Table 52 in the Annexure) show strong statistically signifi cant differences between urban<br />
and rural settings, <strong>with</strong> an exception for kerosene lamps that are owned by almost all households. Rural<br />
households generally possess fewer assets than urban ones, except for houses: this might indicate that<br />
rural households are poorer but less vulnerable in case <strong>of</strong> an external shock. In fact, owning a house can<br />
avoid becoming homeless as a direct consequence <strong>of</strong> an external shock except in some cases <strong>of</strong> fl ood... It is<br />
probable that people who have a partial mortgage on the house also declare themselves as being owners.<br />
Figure 37. Distribution <strong>of</strong> People regarding Possess <strong>of</strong> Goods or Equipment in<br />
Urban and Rural Areas<br />
100<br />
90<br />
80<br />
70<br />
60<br />
50<br />
40<br />
30<br />
20<br />
10<br />
0<br />
Radio<br />
Television<br />
Pressure<br />
Cooker<br />
Oven,<br />
Hotplate<br />
Refrigerator<br />
Bukhari<br />
Bicycle<br />
Motorbike<br />
Car<br />
Tractor<br />
Generator<br />
Kerosene<br />
Lamp<br />
Sewing<br />
Machine<br />
House or<br />
Apartment<br />
Urban<br />
Rural<br />
In rural areas, 67.7% <strong>of</strong> households owned a radio in 2005, and this result is consistent <strong>with</strong> NRVA 2003 33<br />
result, which found 65% <strong>of</strong> households. 86.7% <strong>of</strong> urban households own a radio. For sewing machines, the<br />
proportion <strong>of</strong> rural households owning one is higher than in the NRVA 2003. 46.2% <strong>of</strong> rural households<br />
own a sewing machine (64.3% <strong>of</strong> urban households) according to the NDSA data, while only 31% <strong>of</strong> rural<br />
households were reported owning one by the NRVA 2003 survey. The gap is diffi cult to explain and nothing<br />
indicates a sole valid reason that could explain the increase <strong>of</strong> more than 10% <strong>of</strong> acquisitions <strong>of</strong> such<br />
equipment during the two-year period between the surveys. Is the reason to be fi nd in the aid <strong>of</strong> INGOs ?<br />
Some distribute sewing machines through livelihood projects…<br />
The difference for tractors is signifi cant but almost nobody has one. It is probable that urban households<br />
owning one have fi elds just outside town. It is striking how much better <strong>of</strong>f, in terms <strong>of</strong> possession <strong>of</strong> goods<br />
and equipment, urban households are:<br />
The highest difference is for television sets: 58.6% <strong>of</strong> urban households own one against only 9.8% <strong>of</strong><br />
rural ones, which is understandable mostly because <strong>of</strong> lack <strong>of</strong> main power in rural areas and because<br />
<strong>of</strong> the still relatively high price <strong>of</strong> a TV set. There is also a concept <strong>of</strong> community televisions, which is<br />
widespread in these rural areas, where TV sets are usually in a shop or tea-house (Tchaikhana) and are<br />
watched by a number <strong>of</strong> people.<br />
Car (10.8% <strong>of</strong> households own one in town, 2.2% in rural areas; NRVA 2003 found 4% for ownership<br />
<strong>of</strong> car or truck in rural areas);<br />
Bicycle (respectively 53.8% urban and 24.6% rural; 25% in NRVA 2003 for rural households);<br />
Motorbike (respectively 15.7% urban and 8.2% rural, almost the same as in NRVA 2003: 8%);<br />
Refrigerator (respectively 20.6% urban and 0.3% rural);<br />
Generator (respectively 27.8% urban and 7.0% rural), etc.<br />
34<br />
VULNERABILITY ANALYSIS AND MAPPING UNIT OF THE WORLD FOOD PROGRAMME AND THE VULNERABILITY ANALYSIS UNIT OF<br />
THE MINISTRY OF RURAL REHABILITATION AND DEVELOPMENT (2004), op. cit., p. 41.<br />
Fewer Assets for Persons <strong>with</strong> Disability: a Vulnerability Issue<br />
37
The quantity <strong>of</strong> equipment possessed by rural households is very low, and this illustrates the high difference<br />
in livelihood assets and wealth between rural and urban Afghanistan. The only exception is for ownership <strong>of</strong><br />
houses: rural households usually own their houses (82.3% <strong>of</strong> them). Renting <strong>of</strong> houses is far more common in<br />
towns where one-third <strong>of</strong> households rent their living spaces. The prices <strong>of</strong> real estate – especially in regional<br />
centres and above all in Kabul city where the international community is very present – are skyrocketing, this<br />
factor may also explain this difference.<br />
As shown in Figure 38, even if households headed by a woman are relatively more present in urban areas<br />
than those headed by a man, they systematically possess less goods, and equipments, <strong>with</strong> the exception <strong>of</strong><br />
sewing machines that are <strong>of</strong>ten used by women for income generating activities.<br />
Figure 38. Distribution <strong>of</strong> Households according to Gender <strong>of</strong> the Head <strong>of</strong> the<br />
Household for Ownership <strong>of</strong> Goods or Equipment<br />
100<br />
90<br />
80<br />
70<br />
60<br />
50<br />
40<br />
30<br />
20<br />
10<br />
0<br />
Radio<br />
Television<br />
Pressure<br />
Cooker<br />
Oven,<br />
Hotplate<br />
Refrigerator<br />
Bukhari<br />
Bicycle<br />
Man Head <strong>of</strong> the Household<br />
Woman Head <strong>of</strong> the Household<br />
Motorbike<br />
Car<br />
Tractor<br />
Generator<br />
Kerosene<br />
Lamp<br />
Sewing<br />
Machine<br />
House or<br />
Apartment<br />
Thus, households headed by a woman are statistically signifi cantly less than men headed households to<br />
own:<br />
Radio set (52.5% against 73.2% for households headed by a man);<br />
Pressure cooker (50.8% against 59.0% for households headed by a man);<br />
Refrigerator (2.8% against 5.5% for households headed by a man);<br />
Car (0% against 4.5% for households headed by a man).<br />
If households headed by a woman owning a motorbike are as numerous as those headed by a man, a possible<br />
explanation might be that men living in the households headed by women buy it whenever they can for<br />
transportation.<br />
72% <strong>of</strong> households headed by a woman own their house, which is a strong warrantee against the risk <strong>of</strong><br />
falling into poverty. Yet, the remaining third <strong>of</strong> these households are particularly vulnerable because they do<br />
not own their house and in fact, barely have anything to call their own.<br />
Overall, more than a third <strong>of</strong> all households do not possess anything except a kerosene lamp.<br />
Results further indicate that households headed by a woman are more at risk <strong>of</strong> poverty. Here<br />
again, the <strong>disability</strong> factor does not seem to have a strong impact on ownership <strong>of</strong> goods.<br />
Widespread Ownership <strong>of</strong> Livestock<br />
Results regarding the ownership <strong>of</strong> livestock are in line <strong>with</strong> the analysis above that indicates the general<br />
similarity <strong>of</strong> livelihood level between persons <strong>with</strong> <strong>disability</strong> and non-disabled. A high number <strong>of</strong> Afghan<br />
households possess at least one animal. Livestock is a good indicator <strong>of</strong> the ability to face unexpected<br />
shocks and <strong>of</strong> the decrease <strong>of</strong> <strong>vulnerability</strong>.<br />
38 Understanding Vulnerability <strong>of</strong> Afghans <strong>with</strong> Disability
The analysis in terms <strong>of</strong> households <strong>with</strong> persons <strong>with</strong> <strong>disability</strong> and households <strong>with</strong>out persons <strong>with</strong> <strong>disability</strong><br />
leads to similar conclusions. A large number <strong>of</strong> both groups <strong>of</strong> households possess livestock (See Figure 39<br />
and Table 58 in the Annexure). It is interesting to notice that households <strong>with</strong>out persons <strong>with</strong> <strong>disability</strong> more<br />
<strong>of</strong>ten own livestock, which is expensive, and are considered more valuable such as cows, horses, donkeys,<br />
roosters and camels. This means that households <strong>with</strong> persons <strong>with</strong> <strong>disability</strong> are among the most vulnerable<br />
as they do not own as many useful assets.<br />
Figure 39. Distribution <strong>of</strong> Households according to the Ownership <strong>of</strong><br />
Livestock<br />
80<br />
70<br />
Households <strong>with</strong>out Persons <strong>with</strong> Disability<br />
Households <strong>with</strong> Persons <strong>with</strong> Disability<br />
60<br />
50<br />
40<br />
30<br />
20<br />
10<br />
0<br />
Owns<br />
Animals<br />
Sheeps Cows Goats Horses Donkeys Chickens Rooster Camles<br />
More in-depth analyses <strong>of</strong> ownership <strong>of</strong> livestock by type <strong>of</strong> animal yield no significant differences between<br />
persons <strong>with</strong> <strong>disability</strong> and non-disabled at the level <strong>of</strong> individuals. But at the households level, a few<br />
differences are signifi cant between the two types <strong>of</strong> households (see Table 59 in the Annexure). Nevertheless,<br />
the percentage <strong>of</strong> differences remains limited.<br />
The highest difference observed between households is a statistically signifi cant 4.7% for families not<br />
possessing goats: a higher proportion <strong>of</strong> households <strong>with</strong> persons <strong>with</strong> <strong>disability</strong> do not own goats.<br />
Statistically signifi cant differences are observed in two situations, but in both cases, the difference is a few<br />
percentages:<br />
On one hand, households <strong>with</strong> persons <strong>with</strong> <strong>disability</strong> own fewer animals that are most commonly<br />
owned such as poultry, sheep, cows, and goats;<br />
On the other hand, they less <strong>of</strong>ten own very expensive animals such as roosters (used among other<br />
things for fi ghting), horses or camels.<br />
As a conclusion, it can be noted that the difference between households is not significantly<br />
observable among poor households, but that it becomes more important among households,<br />
which are better <strong>of</strong>f. This leads to believe that poverty is <strong>of</strong>ten chronic and multifaceted, infl uenced by a<br />
number <strong>of</strong> variables. Disability affects living conditions once all the other factors have been tackled, making<br />
persons <strong>with</strong> <strong>disability</strong> more vulnerable and more at risk <strong>of</strong> remaining in poverty. Policies geared towards<br />
fi ghting poverty must also focus on ensuring security and strengthening capability by reducing <strong>vulnerability</strong><br />
<strong>of</strong> households that have a disabled member.<br />
As shown in Figure 40, the same conclusion can be made for households headed by men or women. Both<br />
possess livestock. To go one step further in the analysis, it is interesting to distinguish between types <strong>of</strong><br />
animals owned: it is not the same to own a chicken or two own four horses for Buskachi! While households<br />
Fewer Assets for Persons <strong>with</strong> Disability: a Vulnerability Issue<br />
39
headed by a woman more <strong>of</strong>ten own chickens and birds, households headed by a man more <strong>of</strong>ten own<br />
expensive animals. For instance, 4.6% <strong>of</strong> the latter own a horse and 2% own camels whereas no household<br />
headed by a woman in the sample own any <strong>of</strong> these.<br />
Figure 40. Distribution <strong>of</strong> Households according to the Gender <strong>of</strong> the<br />
Head <strong>of</strong> the Household and the Ownership <strong>of</strong> Livestock<br />
80<br />
70<br />
Households Headed by a Man<br />
Households Headed by a Woman<br />
60<br />
50<br />
40<br />
30<br />
20<br />
10<br />
0<br />
Owns<br />
Animals<br />
Sheeps Cows Goats Horses Donkeys Chickens Rooster Camels<br />
The major statistically signifi cant and important differences are observed between households headed by a<br />
man and those headed by a woman. The latter never own livestock <strong>of</strong> great value such as horses or camels.<br />
They invariably possess fewer animals, except for the group <strong>of</strong> 1 to 3 chickens. Above 7 chickens, a larger<br />
number <strong>of</strong> households headed by men are observed. The relatively frequent ownership <strong>of</strong> chicken and birds by<br />
households headed by women is explained by the high number <strong>of</strong> women head <strong>of</strong> households that depend on<br />
chicken breeding for an income for the family, sometimes <strong>with</strong> the help <strong>of</strong> NGOs 34 . The recent epidemic <strong>of</strong> bird<br />
fl ue represents an important threat for these households. But a large number <strong>of</strong> animals as a sign <strong>of</strong> wealth<br />
or a security asset are mainly observed in households headed by man:<br />
0% <strong>of</strong> households headed by a woman against 7.1% <strong>of</strong> those headed by a man possess more than 6<br />
sheep;<br />
2.4% <strong>of</strong> households headed by a woman against 5% possess more than 4 cows;<br />
0% <strong>of</strong> households headed by a woman against 8.9% possess more than 2 donkeys;<br />
0% <strong>of</strong> households headed by a woman against 1.7% possess more than 2 roosters. We know that the<br />
value <strong>of</strong> roosters can be high when they are well trained for fi ghts.<br />
Again the possession <strong>of</strong> livestock by the households headed by women and the types <strong>of</strong> possession are among<br />
other indicators that show that these households are among the poorest.<br />
Not surprisingly, the main difference is observed between rural and urban areas. Twice more households own<br />
livestock in rural areas (84.3%) than in urban ones (46.0%) as shown in Figure 41. This result corroborates<br />
NRVA 2003 fi ndings: 86% <strong>of</strong> the sample households own at least poultry 35 . Yet, very slight differences can<br />
be noted.<br />
34 For instance, in Kabul province, chicken breeding support to women head <strong>of</strong> family is one major programme <strong>of</strong> Care International.<br />
35 VULNERABILITY ANALYSIS AND MAPPING UNIT OF THE WORLD FOOD PROGRAMME AND THE VULNERABILITY ANALYSIS UNIT OF<br />
THE MINISTRY OF RURAL REHABILITATION AND DEVELOPMENT (2004), op. cit., p. 48.<br />
40 Understanding Vulnerability <strong>of</strong> Afghans <strong>with</strong> Disability
Table 9. Ownership <strong>of</strong> Livestock: Comparing<br />
NRVA 2003 and NDSA 2005<br />
Types <strong>of</strong> Livestock<br />
NRVA<br />
NDSA<br />
Rural<br />
NDSA<br />
Urban<br />
Donkeys 55.0% 41.2% 11.4%<br />
Cows 45.0% 52.5% 20.0%<br />
Horses 4.0% 5.2% 0.9%<br />
Camels 2.0% 2.4% 0.4%<br />
NRVA 2003 found that 55% <strong>of</strong> rural households own donkeys, 45% milking cows, 4% at least one horse<br />
and 2% a camel. NDSA results show that in 2005:<br />
41.2% <strong>of</strong> rural households and 11.4% <strong>of</strong> urban households own at least one donkey;<br />
52.5% <strong>of</strong> rural households and 20% <strong>of</strong> urban households own at least one cow;<br />
5.2% <strong>of</strong> rural households and 0.9% <strong>of</strong> urban households own at least one horse;<br />
2.4% <strong>of</strong> rural households and 0.4% <strong>of</strong> urban households own at least one camel.<br />
Considering the confi dence interval for this data, the results appear to be similar <strong>with</strong> the exception <strong>of</strong> the<br />
proportion <strong>of</strong> households possessing donkeys. The difference in proportion <strong>of</strong> possession <strong>of</strong> cows might be<br />
explained by the fact that NDSA did not differentiate between milking and non-milking cows.<br />
Figure 41. Distribution <strong>of</strong> Households regarding Ownership <strong>of</strong> Livestock<br />
in Urban and Rural Areas<br />
90<br />
80<br />
Urban Households<br />
Rural Households<br />
70<br />
60<br />
50<br />
40<br />
30<br />
20<br />
10<br />
0<br />
Owns<br />
Animals<br />
Sheeps Cows Goats Horses Donkeys Chickens Rooster Camels<br />
Again livestock can be classifi ed into various different types:<br />
Some are considered as assets used for transportation, agricultural production (ploughing);<br />
Some are used for consumption: cows or chicken;<br />
Some directly provide an income when bred for selling: chicken, roosters.<br />
The degree to which they contribute to the reduction <strong>of</strong> <strong>vulnerability</strong> will depend upon other factors, but in<br />
general they all contribute to enhancing household capabilities.<br />
Fewer Assets for Persons <strong>with</strong> Disability: a Vulnerability Issue<br />
41
Land Ownership: Do Households <strong>of</strong> Persons <strong>with</strong> Disability Have<br />
Smaller Land Holdings?<br />
Half <strong>of</strong> the Households own Land<br />
Possession <strong>of</strong> land is more common in rural communities as already stated and even more so in Afghanistan.<br />
Movements <strong>of</strong> population due to the unending confl ict have transformed the issue <strong>of</strong> ownership <strong>of</strong> the land<br />
into a major source <strong>of</strong> dispute between people. The measure <strong>of</strong> land in Afghanistan is in biswa and jerib. 1<br />
biswa is the equivalent <strong>of</strong> 100 sq.mt. and there are 20 biswa in 1 jerib (2000 sq.mt.).<br />
According to Figure 42 (and Tables 61 to 65 in the Annexure), 55.2% <strong>of</strong> households own land, <strong>with</strong>out any<br />
signifi cant difference between households <strong>with</strong> persons <strong>with</strong> <strong>disability</strong> and households <strong>with</strong> non-disabled<br />
people.<br />
Figure 42. Distribution <strong>of</strong> Households regarding Ownership <strong>of</strong> Land<br />
70<br />
60<br />
50<br />
40<br />
30<br />
20<br />
Households <strong>with</strong>out Persons <strong>with</strong> Disability<br />
Households <strong>with</strong> Persons <strong>with</strong> Disability<br />
Non-Disabled<br />
Persons <strong>with</strong> Disability<br />
Urban<br />
Rural<br />
Man Head <strong>of</strong> the Household<br />
Woman Head <strong>of</strong> the Household<br />
Men<br />
Women<br />
Women in Urban Area<br />
Women in Rural Area<br />
10<br />
0<br />
Own Land<br />
Results regarding land owned by the interviewee herself or himself 36 as presented in Figure 42 (and Table<br />
65 in the Annexure), show that the difference between persons <strong>with</strong> <strong>disability</strong> and non-disabled is high and<br />
statistically signifi cant. But these results have to be considered <strong>with</strong> caution. In fact, the cultural tradition in<br />
Afghanistan is community-based. Therefore, the land is usually considered as belonging to the whole family.<br />
When NDSA surveyors insisted to know if part <strong>of</strong> the land belonged to the individual interviewed herself/<br />
himself, the answer might have been affi rmative when in fact, a given land was considered as shared by all<br />
the (male) members <strong>of</strong> the family. This leads to a striking and statistically signifi cant result: almost 10%<br />
more <strong>of</strong> persons <strong>with</strong> <strong>disability</strong> declare owning part <strong>of</strong> the family land.<br />
The main disparity is between urban and rural households. Twice more people own land in rural areas<br />
than in urban zones. The land prices are a lot higher in urban areas, especially in major towns where fi elds are<br />
not available and property documents do not exist, reducing transactions made on lands.<br />
Another distinction that can be noted is between households headed by a woman and those headed by a<br />
man. The latter are a lot more <strong>of</strong>ten owner <strong>of</strong> lands (56.5%) than the former (30.5%). Nevertheless, when<br />
the interviewee was directly asked if he/she owned part <strong>of</strong> the family land the proportion was similar between<br />
both households, but slightly higher among households headed by a woman.<br />
36<br />
Their own answer to the question.<br />
42 Understanding Vulnerability <strong>of</strong> Afghans <strong>with</strong> Disability
The size <strong>of</strong> land also varies widely among households and families. The difference between households <strong>with</strong><br />
persons <strong>with</strong> <strong>disability</strong> and households <strong>with</strong> non-disabled people regarding ownership <strong>of</strong> land is only statistically<br />
signifi cant for large size <strong>of</strong> lands (See Table 66 in the Annexure). This is even more striking for cultivable land<br />
(See Table 67 in the Annexure). If the proportion <strong>of</strong> households which do not own any land is the same for both<br />
types <strong>of</strong> households; the difference is <strong>of</strong> 2.5% more for households <strong>of</strong> non-disabled people only when the land<br />
considered is more than 40 biswas. This difference is <strong>of</strong> 3.4% for land which is cultivable. It can be assumed<br />
that if the difference between the two types <strong>of</strong> households is not important or significant when under<br />
or close to the poverty line, the difference becomes significant for wealthy family. Thus, among families<br />
owning land, the average size <strong>of</strong> land is respectively 102 and 120 biswa (between 1000 and 1200 sq. mt.) in<br />
urban and rural areas for family <strong>with</strong> a person <strong>with</strong> <strong>disability</strong>, and respectively 154 and 113 (between 1540 and<br />
1130 sq. mt.) in urban and rural areas for family <strong>with</strong>out a person <strong>with</strong> <strong>disability</strong>.<br />
All together, the average size <strong>of</strong> land owned is 149 and 113.5 biswa (1490 and 1135 sq. mt.) respectively<br />
in urban and rural areas. It seems that wealthy families owning large size <strong>of</strong> lands <strong>of</strong>ten live in urban<br />
areas, even if the land is possessed in the village <strong>of</strong> origin.<br />
Tables 68 and 69 in the Annexure show that households headed by a woman are statistically signifi cantly<br />
a lower proportion to own land (30.5%) especially cultivable land (29.9%), than those headed by a<br />
man (respectively 56.5% and 54.3%). This result is different from NRVA 2003 that found that 56%<br />
<strong>of</strong> female headed <strong>of</strong> household own some land. But if only rural areas are considered, women head <strong>of</strong><br />
households are a proportion <strong>of</strong> 44.5% owning land in their own right (but only 8% in urban areas). For<br />
larger size lands, almost fi ve times more <strong>of</strong> households headed by a man own fi elds <strong>of</strong> more than 40<br />
biswa. The gap is slightly less for cultivable land.<br />
Women heads <strong>of</strong> household own land, but other women also do (see Figure 42 in previous page). No<br />
law in Afghanistan prohibits women from possessing land. Of course, especially in Pashto tradition,<br />
women are scarcely landowners and rarely cultivate fi elds. Yet, some do. Women receive land through<br />
inheritance from their fathers or their husbands, even if their share is less important than the share <strong>of</strong><br />
the men. Sometime, daughters give up their right on the land to their brother. Widows usually keep their<br />
land when they do not live <strong>with</strong> their sons, even if someone else is cultivating them.<br />
Measure <strong>of</strong> Inequality: Lorenz Curves and Gini Coefficients<br />
The Lorenz curve measures inequalities. It is a graphical representation <strong>of</strong> the proportionality <strong>of</strong> a distribution<br />
(the cumulative percentage <strong>of</strong> the values <strong>of</strong> land). The curves look at the distribution <strong>of</strong> land among individuals<br />
and households.<br />
Figure 43. Lorenz Curves <strong>of</strong> Land Ownership Inequalities<br />
Cumulative Distribution <strong>of</strong> Land<br />
1.00<br />
0.95<br />
0.90<br />
0.85<br />
0.80<br />
0.75<br />
0.70<br />
0.65<br />
0.60<br />
0.55<br />
0.50<br />
0.45<br />
0.40<br />
0.35<br />
0.30<br />
0.25<br />
0.20<br />
0.15<br />
0.10<br />
0.05<br />
0.00<br />
0.000<br />
0.025<br />
0.050<br />
0.075<br />
0.100<br />
0.125<br />
0.150<br />
0.175<br />
0.200<br />
0.225<br />
0.250<br />
0.275<br />
0.300<br />
0.325<br />
0.350<br />
0.375<br />
0.400<br />
0.425<br />
0.450<br />
0.475<br />
0.500<br />
0.525<br />
0.550<br />
0.575<br />
0.600<br />
0.625<br />
0.650<br />
0.675<br />
0.700<br />
0.725<br />
0.750<br />
0.775<br />
0.800<br />
0.825<br />
0.850<br />
0.875<br />
0.900<br />
0.925<br />
0.950<br />
0.975<br />
0.000<br />
Cumulative Distribution <strong>of</strong> Land<br />
Land Ownership Households <strong>with</strong>out Persons <strong>with</strong> Disability Land Ownership Households <strong>with</strong> Persons <strong>with</strong> Disability<br />
Land Ownership All Households<br />
Cultivable Land Ownership All Households<br />
DAD ® S<strong>of</strong>tware.<br />
Fewer Assets for Persons <strong>with</strong> Disability: a Vulnerability Issue<br />
43
The four curves show the distribution <strong>of</strong> land among households.<br />
The fi rst one related to households <strong>with</strong>out a person <strong>with</strong> <strong>disability</strong> owning land;<br />
The second one refers to family <strong>with</strong> a person <strong>with</strong> <strong>disability</strong> owning land;<br />
The third one refers to family in general owning land or not;<br />
The fourth one refers to cultivable land distribution for all families.<br />
As Figure 43 clearly shows, all four follow a similar slope. In all cases people who do not own land at all are<br />
included. It appears that inequality <strong>of</strong> ownership is quite significant:<br />
For instance, 49.6% <strong>of</strong> the population do not own land;<br />
30% <strong>of</strong> the landowners own only 20% <strong>of</strong> the land;<br />
Moreover, if one considers all the households, including those not possessing any land, then 90% <strong>of</strong><br />
households own 30% <strong>of</strong> the land;<br />
10% <strong>of</strong> the population are major landlords who own 90% <strong>of</strong> the land;<br />
Households <strong>with</strong> persons <strong>with</strong> <strong>disability</strong> are not in a worse situation than those <strong>with</strong>out any person <strong>with</strong><br />
<strong>disability</strong>.<br />
Table 10. Gini Coefficients <strong>of</strong> Land Ownership<br />
Land Ownership<br />
Estimated<br />
Value<br />
Standard<br />
Deviation<br />
Lower<br />
Bound<br />
Upper<br />
Bound<br />
Confidence<br />
Level in (%)<br />
Land Ownership 0.775 0.011 0.754 0.796 95<br />
Cultivable Land Ownership 0.775 0.012 0.752 0.799 95<br />
Land Ownership HH <strong>of</strong><br />
Non-Disabled 0.775 0.013 0.750 0.800 95<br />
Land Ownership HH <strong>of</strong><br />
Persons <strong>with</strong> Disability 0.776 0.018 0.742 0.811 95<br />
Source: NDSA. Note: Use <strong>of</strong> DAD ® S<strong>of</strong>tware for calculation.<br />
The Gini coefficient for the land distribution in Afghanistan is <strong>of</strong> 0.78, and corresponds to a very<br />
high level <strong>of</strong> inequality. The Gini coeffi cient for cultivable land is almost identical. This confi rms fi ndings<br />
from other studies 37 showing a high concentration <strong>of</strong> land among a minority <strong>of</strong> Afghans who are major<br />
landlords. Landownership is a good indicator <strong>of</strong> wealth in Afghanistan: in rural areas, itinerant labourers<br />
are landless and <strong>of</strong>ten among the poorest. NRVA 2003 estimated that 21% to 24% (according to type <strong>of</strong><br />
analysis) <strong>of</strong> rural Afghans are landless. Confi rming results <strong>of</strong> the Lorenz curve, the Gini coeffi cient analysis <strong>of</strong><br />
inequality show no signifi cant difference between the two types <strong>of</strong> households.<br />
Concluding on Durable Goods: Fighting Poverty in a<br />
Comprehensive Manner<br />
A few conclusions can be made regarding household commodities and living conditions.<br />
The main fi nding <strong>of</strong> this section is that <strong>disability</strong> <strong>with</strong>in a household does not strongly impact the factors that<br />
determine <strong>vulnerability</strong> except to a certain extent for landownership.<br />
The two major elements that do seem to have an infl uence on these factors is the settings in which the<br />
households live (urban or rural) and the gender <strong>of</strong> the head <strong>of</strong> the household.<br />
However, <strong>disability</strong> seems to have an infl uence once a certain number <strong>of</strong> basic needs have been satisfi ed. This<br />
is evident in the fact that the difference between households <strong>of</strong> disabled and non-disabled appears clearly in<br />
the more advantaged social strata, even though these remain few in number. These results suggest that<br />
37<br />
See again ALDEN W. L. (2004); op. cit., p.25.<br />
44 Understanding Vulnerability <strong>of</strong> Afghans <strong>with</strong> Disability
it is when the living conditions improve that the impact <strong>of</strong> <strong>disability</strong> is stronger as this weighs<br />
down on the entire household. Thus, once fi ght against monetary poverty is underway, the main challenge<br />
remains to reduce <strong>vulnerability</strong> in the long-term. Public action will need to be focused on increasing assets,<br />
improving functionings and generally empowering persons <strong>with</strong> <strong>disability</strong> ensuring that their concerns are<br />
mainstreamed and they do not remain at risk <strong>of</strong> falling back into poverty when faced <strong>with</strong> unexpected<br />
external shocks.<br />
Debt and Donation: Assets or Factors <strong>of</strong> Vulnerability?<br />
This section looks at a wider defi nition <strong>of</strong> income: income through the social capital, i.e. the network <strong>of</strong> an<br />
individual that is supporting her/him. Usually this term is related to the monetary amounts that a person<br />
receives. But in traditional structures such as Afghanistan, it is essential to also take into account the other<br />
goods (food and clothing for example) that a person receives. This aspect <strong>of</strong> income is crucial for persons <strong>with</strong><br />
<strong>disability</strong> since it determines the consideration and support that he/she has <strong>with</strong>in the household. Moreover,<br />
in such social and cultural structures, the salaries are <strong>of</strong>ten paid in non-monetary terms, or given to the head<br />
<strong>of</strong> household for an effort <strong>of</strong> the family unit. All these aspects <strong>of</strong> “income” make it diffi cult to assess in terms<br />
<strong>of</strong> “how much” exactly is received by the individual.<br />
However, income remains different from donation since the former is remuneration for an effort, some form<br />
<strong>of</strong> work. A donation is money, goods or presents that are given by solidarity for example. A donation is defi ned<br />
by the fact that nothing is (<strong>of</strong>fi cially) expected in return 38 . Lastly, a donation differs from a loan, which not<br />
only is explicit in monetary terms but is also expected to be paid back. Questions regarding income are asked<br />
directly to the interviewee and donations are an evaluation <strong>of</strong> money and goods given.<br />
Resort to Loan and Level <strong>of</strong> Debt: Higher for Persons <strong>with</strong><br />
Disability<br />
The level <strong>of</strong> debt can be a factor <strong>of</strong> risk <strong>of</strong> falling into poverty or a way <strong>of</strong> drawing on resources to achieve<br />
certain functionings and increase capabilities. In fact, as loan is <strong>of</strong>ten a family matter in Afghanistan, if a<br />
person or his/her relatives cannot face his/her obligations <strong>of</strong> repayment, there is a propensity <strong>of</strong> selling or<br />
mortgaging assets to pay back the debt. 35.8% <strong>of</strong> all Afghans aged over 14, female and male, had taken<br />
a loan, whatever the amount might be, in the 5 years preceding the interview. This fi gure refl ects a frequent<br />
practice, especially if one considers that the loan is <strong>of</strong>ten taken for a family need and is paid back by all the<br />
active members in the family.<br />
What are the characteristics <strong>of</strong> debt <strong>of</strong> Afghans today? Understanding these will help to evaluate the risk <strong>of</strong><br />
falling into poverty for the people indebted and to assess how vulnerable they may be. One major aspect<br />
to keep in mind is that people who lend money do not <strong>of</strong>ten ask for interests to be paid. Even if usury is a<br />
forbidden practice in a Muslim country, it is important to note that mortgager gets back the amount lent, even<br />
if various generations have to pay it <strong>of</strong>f.<br />
Diversity <strong>of</strong> Borrowers’ Pr<strong>of</strong>iles<br />
Since a loan needs to be paid back, a majority <strong>of</strong> active persons report having taken one (46.2%) as shown<br />
in Figure 44 (and Table 70 in the Annexure). Nevertheless, more than a quarter (27.6%) <strong>of</strong> inactive people<br />
have also taken loans in the last fi ve years. Among these, a large part <strong>of</strong> people looking for a job have<br />
taken loans (55.9%), this is also the case for a large proportion <strong>of</strong> old people (52.9%) who do not work<br />
anymore but have different sources <strong>of</strong> income coming from house rent, fi eld rent, etc. There is a statistically<br />
signifi cant difference between persons <strong>with</strong> <strong>disability</strong> taking a loan (36.1%) and the non-disabled (30.5%).<br />
This difference is even higher when active people are taken into account: active persons <strong>with</strong> <strong>disability</strong> are<br />
60% to be indebted while active non-disabled are only 45.7%.<br />
39<br />
Here we specify ‘<strong>of</strong>fi cially’ because a donation always implies a relationship <strong>of</strong> dominance between giver and receiver. It aslo defi nes<br />
social and family dynamics and implies the authority <strong>of</strong> the donor.<br />
Fewer Assets for Persons <strong>with</strong> Disability: a Vulnerability Issue<br />
45
Figure 44. Distribution <strong>of</strong> Persons <strong>with</strong> Disability<br />
and Non-Disabled Above 14 <strong>with</strong> Loans taken since<br />
5 Years according to the Situation <strong>of</strong> Activity<br />
70<br />
60<br />
Persons <strong>with</strong> Disability<br />
Non-Disabled<br />
50<br />
40<br />
30<br />
20<br />
10<br />
0<br />
Working<br />
Not Working<br />
Figures 44 and 45 (and Tables 70 and 71 in the Annexure) show that older Afghans take loans more <strong>of</strong>ten<br />
than youngsters. Moreover, men take loans a lot more <strong>of</strong>ten than women, regardless <strong>of</strong> the situation <strong>of</strong><br />
<strong>disability</strong>. This is explained by the ability <strong>of</strong> older men to provide better security for paying back loans due to<br />
the fact they own more assets and benefi t from their social status and most <strong>of</strong>ten have family members who<br />
are also working.<br />
Figure 45. Distribution <strong>of</strong> Persons <strong>with</strong> Disability<br />
and Non-disabled Above 14 according to the<br />
Amount <strong>of</strong> Loans and Age Groups<br />
50<br />
45<br />
40<br />
35<br />
30<br />
25<br />
20<br />
15<br />
10<br />
5<br />
Persons <strong>with</strong> Disability<br />
Non-Disabled<br />
0<br />
Less than 25<br />
26 and More<br />
The fact that women and youngsters provide little direct income to the family because they less <strong>of</strong>ten earn<br />
an income explains that they are less likely to go into debt. Often, the man who is head <strong>of</strong> the family is the<br />
person who goes into debt because he is the person who collects all the income <strong>of</strong> the household and is in<br />
charge <strong>of</strong> expenditures. Moreover, when a child is working but still living in the household, even married, he/<br />
she gives his/her income to the head <strong>of</strong> household. But the need to repay the loan is shared by all members<br />
<strong>of</strong> the family.<br />
46 Understanding Vulnerability <strong>of</strong> Afghans <strong>with</strong> Disability
Figure 46. Distribution <strong>of</strong> Persons <strong>with</strong> Disability<br />
and Non-Disabled Above 14 <strong>with</strong> Loan taken<br />
since 5 Years According to Gender<br />
60<br />
Persons <strong>with</strong> Disability<br />
Non-Disabled<br />
50<br />
40<br />
30<br />
20<br />
10<br />
0<br />
Males<br />
Females<br />
Figure 47 (and Table 72 in the Annexure) show that persons <strong>with</strong> <strong>disability</strong> take a loan more <strong>of</strong>ten when<br />
they live in urban areas than when they live in rural ones. This result is inversed for the non-disabled. The<br />
difference <strong>of</strong> proportion is statistically signifi cant between persons <strong>with</strong> <strong>disability</strong> and non-disabled taking a<br />
loan in urban areas; but not in rural ones.<br />
Figure 47. Distribution <strong>of</strong> Persons <strong>with</strong> Disability<br />
and Non-Disabled Above 14 <strong>with</strong> Loan taken<br />
since 5 Years According to the Area <strong>of</strong> Living<br />
50<br />
45<br />
Persons <strong>with</strong> Disability<br />
Non-Disabled<br />
40<br />
35<br />
30<br />
25<br />
20<br />
15<br />
10<br />
5<br />
0<br />
Urban<br />
Rural<br />
Similar results, even more prominent, are found when taking into account only the major towns <strong>of</strong> the country<br />
such as Kabul, Herat, Jalalabad, Kandahar, Mazar-I-Sharif and Kunduz on one hand and the rest <strong>of</strong> the country on<br />
the other (see Table 73 in the Annexure). This is explained by various factors. There are a higher number <strong>of</strong> persons<br />
<strong>with</strong> <strong>disability</strong> in major towns, and they more <strong>of</strong>ten work than those living in villages. They also have a higher<br />
standard <strong>of</strong> living and probably a larger social network, making it easier to obtain a loan in such settings.<br />
High Amount <strong>of</strong> Loans Taken<br />
The amount <strong>of</strong> the loans taken is an interesting way <strong>of</strong> having an overview on income. In fact, people are<br />
less reluctant in Afghanistan to talk about the loans they take than the income they get. If 36.7% <strong>of</strong> Afghans<br />
contract a loan, they are only a small proportion to have taken more than one in the last 5 years. 17.5% took<br />
a second one, 7.2% a third one, 1.7% a fourth one and 0.7% a fi fth one. These fi gures must be interpreted<br />
Fewer Assets for Persons <strong>with</strong> Disability: a Vulnerability Issue<br />
47
<strong>with</strong> caution for two main reasons. First <strong>of</strong> all, it is well known that the capacity <strong>of</strong> remembering facts<br />
diminishes <strong>with</strong> time and interviewees might have forgot some <strong>of</strong> the loans they took in the past. Experts<br />
usually consider that asking an interviewee to remember events older than 6 months constitutes a challenge<br />
for their memory. Such a diffi culty is for example very frequent for recalling the date <strong>of</strong> a wedding, fi rst job,<br />
period <strong>of</strong> migration 39 , etc. A second limitation is due to the fact that some people might consider some loans<br />
taken in the relevant period as not worth quoting for various reasons: the loan has been completely paid<br />
back for instance or is considered too low an amount to be taken into consideration. Therefore, in this report,<br />
emphasis is given on the global amount <strong>of</strong> all the loans (up to 5 major loans during the previous 5 years<br />
preceding the interview) quoted by the interviewee as a good approximation <strong>of</strong> the level and characteristics<br />
<strong>of</strong> debt.<br />
Figure 48. Distribution <strong>of</strong> All Afghans Above 14 according<br />
to the Amount <strong>of</strong> Loans<br />
24.9%<br />
28.7%<br />
30 to 5000 AFAs<br />
5100 to 10000 AFAs<br />
10100 to 23000 AFAs<br />
24000 AFAs and Above<br />
23.9%<br />
22.5%<br />
Figure 48 shows that a large fi rst quartile (28.7%) contracts small loans, while another quartile (24.9%)<br />
contracts the highest loans. The 5% <strong>with</strong> highest loans contracted 75,000 AFAs or more in loans, and the<br />
2% <strong>with</strong> the highest loans more than 150,000 AFAs. At the other end <strong>of</strong> the spectrum, the 10% <strong>with</strong> lowest<br />
loan took less than 1,800 AFAs. The loan most frequently made is 10,000 AFAs (mode), and on average,<br />
loans amount to 22,800 AFAs.<br />
Figure 49. Distribution <strong>of</strong> Persons <strong>with</strong> Disability and Non-<br />
Disabled Above 14 according to the Amount <strong>of</strong> Loans<br />
35<br />
Persons <strong>with</strong> Disability<br />
Non-Disabled<br />
30<br />
25<br />
20<br />
15<br />
10<br />
5<br />
0<br />
30 to 5000 AFAs 5100 to 12000 AFAs<br />
12100 to 30000 AFAs 31000 AFAs and Above<br />
39 For more information, see DEPARTMENT OF ECONOMIC AND SOCIAL AFFAIRS (2001), op. cit.<br />
48 Understanding Vulnerability <strong>of</strong> Afghans <strong>with</strong> Disability
Figure 49 (and Table 75 in the Annexure) show that persons <strong>with</strong> <strong>disability</strong> have a tendency to borrow more<br />
money than non-disabled Afghans. This might be explained by increased expenditure due to health cure as<br />
well as the need for support and devices, for instance.<br />
Table 11. Average Amount <strong>of</strong> Loan for Urban and Rural<br />
Households<br />
Households<br />
Urban Rural<br />
Mean (AFAs) Mean (AFAs)<br />
Households <strong>with</strong>out Persons <strong>with</strong> Disability 23346.8 20581.2<br />
Households <strong>with</strong> Persons <strong>with</strong> Disability 41024.9 28508.0<br />
Source: NDSA<br />
Table 11 shows that the average loan is almost twice as high in urban areas for households <strong>with</strong> a person<br />
<strong>with</strong> <strong>disability</strong>, and almost 50% higher in rural areas than for households <strong>with</strong>out a person <strong>with</strong> <strong>disability</strong>.<br />
Considering that the sources for livelihood <strong>of</strong> these households is not very different in terms <strong>of</strong> poverty level<br />
than households <strong>with</strong> only non-disabled, the need for money might be explained by specifi c expenses that<br />
non-disabled household do not face or face to a less extent, such as health expenses 40 .<br />
Figure 50. Distribution <strong>of</strong> Persons <strong>with</strong> Disability and Non-Disabled<br />
Above 14 according to the Amount <strong>of</strong> Loans and the Age Group<br />
100%<br />
80%<br />
5.9<br />
30.0<br />
28.0<br />
8.9<br />
28.9<br />
27.1<br />
31000 AFAs and Above<br />
12100 to 30000 AFAs<br />
5100 to 12000 AFAs<br />
30 to 5000 AFAs<br />
60%<br />
21.2<br />
25.3<br />
29.6<br />
22.2<br />
40%<br />
24.6<br />
24.0<br />
20%<br />
34.6<br />
26.2<br />
40.0<br />
23.6<br />
0%<br />
Non-Disabled26<br />
Persons <strong>with</strong> Disability26<br />
Figure 50 (and Table 75 in the Annexure) show that older Afghans, regardless <strong>of</strong> <strong>disability</strong>, are more likely to<br />
take high amount loans (27.5% <strong>of</strong> Afghans older than age 26 take loan <strong>of</strong> more than 31,000 AFAs) than<br />
younger people (only 7.3% <strong>of</strong> Afghans younger than age 26 take loans above 31,000 AFAs). The latter take<br />
loans most <strong>of</strong>ten <strong>of</strong> less than 5,000 AFAs: 37.3% among them versus a proportion <strong>of</strong> only 26.3% among<br />
older people. The probability <strong>of</strong> becoming indebted logically increases <strong>with</strong> age.<br />
40 See BAKHSHI P. et. al. (2006), op. cit.<br />
Fewer Assets for Persons <strong>with</strong> Disability: a Vulnerability Issue<br />
49
Figure 51. Distribution <strong>of</strong> Persons <strong>with</strong> Disability and Non-Disabled<br />
Above 14 according to the Amount <strong>of</strong> Loans and Gender<br />
100%<br />
80%<br />
60%<br />
23.5<br />
24.8<br />
12.7<br />
20.8<br />
20.3<br />
24.1<br />
30.2<br />
23.9<br />
14.1<br />
31000 AFAs and Above<br />
12100 to 30000 AFAs<br />
5100 to 12000 AFAs<br />
30 to 5000 AFAs<br />
23.9<br />
40%<br />
28.0<br />
23.6<br />
20%<br />
23.6<br />
46.1<br />
22.1<br />
38.0<br />
0%<br />
Non-Disabled Males<br />
Non-Disabled Females<br />
Persons <strong>with</strong> Disability Males Persons <strong>with</strong> Disability Females<br />
Figure 51 (and Table 76 in the Annexure) show that Afghan men do take loans <strong>of</strong> higher amount than women,<br />
but a notable result is that disabled women also take loans <strong>of</strong> high amounts: more than 23% <strong>of</strong> men<br />
and only 12.7% <strong>of</strong> women (but 23.9% <strong>of</strong> women <strong>with</strong> <strong>disability</strong>). The need to face high expenditures,<br />
particularly in the health sector, sometimes explains the necessity to borrow money.<br />
Figure 52. Distribution <strong>of</strong> Persons <strong>with</strong> Disability and Non-Disabled<br />
Above 14 according to the Amount <strong>of</strong> Loans and the Living Area<br />
100%<br />
80%<br />
60%<br />
24.2<br />
25.8<br />
20.0<br />
23.3<br />
31.1<br />
25.6<br />
20.6<br />
26.1<br />
31000 AFAs and Above<br />
12100 to 30000 AFAs<br />
5100 to 12000 AFAs<br />
30 to 5000 AFAs<br />
40%<br />
21.7<br />
27.7<br />
23.3<br />
23.9<br />
20%<br />
28.3<br />
29.0<br />
20.0<br />
29.4<br />
0%<br />
Non-Disabled Urban<br />
Non-Disabled Rural Persons <strong>with</strong> Disability Urban Persons <strong>with</strong> Disability Rural<br />
Figure 52 (and Table 77 in the Annexure) show that urban Afghan people take higher amount <strong>of</strong> loans, especially<br />
persons <strong>with</strong> <strong>disability</strong>: 31.1% <strong>of</strong> urban Afghans <strong>with</strong> <strong>disability</strong> and 24.2% <strong>of</strong> urban non-disabled Afghans took<br />
loans worth more than 31,000 AFAs whereas rural Afghans are respectively 20% <strong>of</strong> non-disabled and 20.6%<br />
<strong>of</strong> persons <strong>with</strong> <strong>disability</strong> to take loans <strong>of</strong> such high amounts. The difference between urban and rural Afghans<br />
for highest and lowest amounts <strong>of</strong> loans is statistically signifi cant for persons <strong>with</strong> <strong>disability</strong>.<br />
A Limited Level <strong>of</strong> Debt<br />
The level <strong>of</strong> debt is measured by the amount <strong>of</strong> money still owed by the borrower. It is the difference between<br />
the amount <strong>of</strong> money borrowed globally and the amount <strong>of</strong> money already paid back at the time <strong>of</strong> the<br />
interview. Figure 53 shows that 27.6% <strong>of</strong> all borrowers owe less than 1500 AFAs, and a further 20.2% owe<br />
nothing, having paid back all the money. This means, grouped <strong>with</strong> the 64.2% <strong>of</strong> Afghans over age 14 who<br />
did not take a loan in the last 5 years, 84.2% <strong>of</strong> the Afghan population <strong>of</strong> this age is not in debt or has loans<br />
older than 5 years.<br />
50 Understanding Vulnerability <strong>of</strong> Afghans <strong>with</strong> Disability
Figure 53. Distribution <strong>of</strong> All Afghans Above 14 according<br />
to the Amount <strong>of</strong> Debt<br />
20.5<br />
27.6<br />
0 to 1500 AFAs<br />
1800 to 7800 AFAs<br />
8000 to 20000 AFAs<br />
20500 AFAs and Abnove<br />
29.1<br />
22.8<br />
Among those who are in debt, 20.5% owe more than 20,500 AFAs. The 5% <strong>of</strong> Afghans who are most in<br />
debt owe more than 67,000 AFAs and the 2% who are the most in debt owe more than 90,000 AFAs (under<br />
2000 USD).<br />
Figure 54. Distribution <strong>of</strong> Persons <strong>with</strong> Disability and Non-<br />
Disabled Above 14 according to the Level <strong>of</strong> Debt and the<br />
Age Group<br />
35<br />
Persons <strong>with</strong> Disability<br />
Non-Disabled<br />
30<br />
25<br />
20<br />
15<br />
10<br />
5<br />
0<br />
0 to 1500 AFAs 1800 to 7800 AFAs<br />
8000 to 20000 AFAs 20500 AFAs and Above<br />
Figure 54 shows a signifi cantly higher proportion <strong>of</strong> persons <strong>with</strong> <strong>disability</strong> <strong>with</strong> a high level <strong>of</strong> debt: while<br />
20% <strong>of</strong> non-disabled people have a debt <strong>of</strong> over 20,000 AFAs, this proportion is <strong>of</strong> 31% among persons <strong>with</strong><br />
<strong>disability</strong>. If one assumes that the annual wage <strong>of</strong> a medical doctor working in a public hospital is 30,000<br />
AFAs, this is clearly a very high level <strong>of</strong> debt.<br />
Fewer Assets for Persons <strong>with</strong> Disability: a Vulnerability Issue<br />
51
Figure 55. Distribution <strong>of</strong> Persons <strong>with</strong> Disability and Non-Disabled<br />
Above 14 according to the Level <strong>of</strong> Debt and the Age Group<br />
100%<br />
80%<br />
6.9<br />
34.7<br />
26.0<br />
20.0<br />
33.3<br />
20500 AFAs and Above<br />
8000 to 20000 AFAs<br />
1800 to 7800 AFAs<br />
0 to 1500 AFAs<br />
60%<br />
26.6<br />
31.1<br />
28.0<br />
23.9<br />
40%<br />
22.1<br />
33.3<br />
24.4<br />
20%<br />
0%<br />
34.6<br />
Non-Disabled
Figure 57. Distribution <strong>of</strong> Persons <strong>with</strong> Disability and Non-Disabled<br />
Above 14 according to the Level <strong>of</strong> Debt and the Living Area<br />
100%<br />
80%<br />
32.5<br />
16.0<br />
31.6<br />
38.9<br />
27.2<br />
20500 AFAs and Above<br />
8000 to 20000 AFAs<br />
1800 to 7800 AFAs<br />
0 to 1500 AFAs<br />
60%<br />
21.6<br />
25.6<br />
30.0<br />
40%<br />
8.6<br />
27.2<br />
20%<br />
0%<br />
37.3<br />
Non-Disabled Urban<br />
25.2<br />
Non-Disabled Rural<br />
22.2<br />
13.3<br />
Persons <strong>with</strong><br />
Disability Urban<br />
27.8<br />
15.0<br />
Persons <strong>with</strong><br />
Disability Rural<br />
The situation is slightly different when comparing living areas. There is no signifi cant difference for level <strong>of</strong><br />
debt between rural and urban areas for persons <strong>with</strong> <strong>disability</strong>, except for debts above 20,500 AFAs for which<br />
persons <strong>with</strong> <strong>disability</strong> are signifi cantly more numerous to be indebt in urban areas. Differences between<br />
non-disabled living in urban and rural areas are signifi cant at all levels. Urban people are in majority to be<br />
at the extremes: having high levels <strong>of</strong> debt (32.5% <strong>of</strong> them have a debt above 20,500 AFAs) or very low<br />
level (37.3% have less than 1,500 AFAs). Rural people are mainly around an average level <strong>of</strong> debt (58.8%<br />
between 1,800 AFAs and 20,000 AFAs). Few have very high debt and a quarter has low debt. This result<br />
corroborates the fact that households among the poorest and those among the wealthiest are present in<br />
towns.<br />
Figure 58. Distribution <strong>of</strong> Persons <strong>with</strong> Disability and Non-Disabled<br />
Above 14 according to the Level <strong>of</strong> Debt and the Situation <strong>of</strong> Activity<br />
100%<br />
80%<br />
3.1<br />
6.1<br />
5.6<br />
11.3<br />
14.8<br />
10.6<br />
9.1<br />
8.9<br />
7.4<br />
20.1<br />
17.2<br />
20500 AFAs and Above<br />
8000 to 20000 AFAs<br />
1800 to 7800 AFAs<br />
0 to 1500 AFAs<br />
60%<br />
17.2<br />
40%<br />
85.2<br />
63.3<br />
74.7<br />
20%<br />
45.5<br />
0%<br />
Non-Disabled Not Active<br />
Non-Disabled Active<br />
Persons <strong>with</strong> Disability<br />
Not Active<br />
Persons <strong>with</strong><br />
Disability Active<br />
Figure 58 (and Table 82 in the Annexure) show that active people, especially among persons <strong>with</strong> <strong>disability</strong>,<br />
have a tendency to have higher debt. They take loans that they know they will be able to pay back. Nevertheless,<br />
the level <strong>of</strong> debt is not linked to the number <strong>of</strong> working people in the household; it does not increase according<br />
to the number <strong>of</strong> active people.<br />
Fewer Assets for Persons <strong>with</strong> Disability: a Vulnerability Issue<br />
53
Purpose <strong>of</strong> Loan: a Yardstick <strong>of</strong> Poverty?<br />
Why do Afghans need to take loans?<br />
The fi rst reason is food. Almost a third <strong>of</strong> Afghans took a loan at least once in the last 5 years to get some food<br />
for the family. Food and health requirements <strong>of</strong>ten constitute emergency expenditures: there is realisation <strong>of</strong> a<br />
risk, lack <strong>of</strong> food or accident, disease, etc. Suddenly the family faces an unexpected expenditure and is forced<br />
to take a loan. In these circumstances, taking a loan is clearly an indication <strong>of</strong> <strong>vulnerability</strong>.<br />
Figure 59. Distribution <strong>of</strong> All People Above 14 Having Taken<br />
Loans according to the Purpose <strong>of</strong> Loan<br />
1.5% 3.5%<br />
2.5% 1.5%<br />
0.6%<br />
11.8%<br />
16.5%<br />
31.4%<br />
2.9%<br />
Food (31.4%)<br />
School Expenditure (2.9%)<br />
Health Expenditure (17.8%)<br />
Pr<strong>of</strong>essional Equipment (10.1%)<br />
House Equipment (16.5%)<br />
Ceremony (11.8%)<br />
Dowry (0.6%)<br />
Land Purchase/Rent (2.5%)<br />
Property Purchase (1.5%)<br />
Good Purchase for Business (1.5%)<br />
Other (3.5%)<br />
10.1%<br />
17.8%<br />
Is there a difference between persons <strong>with</strong> <strong>disability</strong> and non-disabled concerning the reasons why a loan<br />
has been taken? Actually, a major and statistically signifi cant difference is for health expenditures: persons<br />
<strong>with</strong> <strong>disability</strong>, because <strong>of</strong> their health needs, more <strong>of</strong>ten take a loan to cover such expenditures. On the other<br />
hand, non-disabled persons signifi cantly take loans more <strong>of</strong>ten to pay for pr<strong>of</strong>essional equipment purchase<br />
or to cover ceremony expenditures. Persons <strong>with</strong> <strong>disability</strong> slightly more <strong>of</strong>ten use loans for food, while nondisabled<br />
use it more for pr<strong>of</strong>essional reasons (15.8% <strong>of</strong> non-disabled, 6.7% <strong>of</strong> persons <strong>with</strong> <strong>disability</strong>) or<br />
house equipment (21.9% <strong>of</strong> Non-disabled, 17.0% <strong>of</strong> persons <strong>with</strong> <strong>disability</strong>).<br />
Figure 60. Distribution <strong>of</strong> Persons <strong>with</strong> Disability and Non-Disabled<br />
Above 14 according to the Purpose <strong>of</strong> Loan<br />
50<br />
45<br />
Persons <strong>with</strong> Disability<br />
Non-Disabled<br />
40<br />
35<br />
30<br />
25<br />
20<br />
15<br />
10<br />
5<br />
0<br />
Food<br />
School Health Pr<strong>of</strong>.<br />
Expenditure Expenditure Equipment<br />
House Ceremony Dowry Land Property<br />
Equipment<br />
Purchase/Rent purchase<br />
Good<br />
Purchase<br />
Other<br />
Purpose<br />
54 Understanding Vulnerability <strong>of</strong> Afghans <strong>with</strong> Disability
Whereas persons <strong>with</strong> <strong>disability</strong> usually use loans for emergency expenditures to cover basic needs such as<br />
nutrition and health, non-disabled have a tendency to use loans more for pr<strong>of</strong>essional investment, equipment<br />
or social expenditure. It is a tool used to improve a personal or family situation. Thus, borrowing money and<br />
being indebted can be regarded as a factor <strong>of</strong> <strong>vulnerability</strong> in the case <strong>of</strong> persons <strong>with</strong> <strong>disability</strong><br />
Loan is a Family and “Friendly” Matter<br />
Lenders are most <strong>of</strong>ten friends <strong>of</strong> the borrower (47.9% <strong>of</strong> all cases) and children or other relatives (37.3%).<br />
There is no wide “business” <strong>of</strong> loan in Afghanistan, except in the emerging banking system, which started only<br />
in the last years and is solely implemented in main towns. Mostly people rely on their community and family<br />
network. Borrowing does not exist inside the household. Husband and wife do not borrow money from each<br />
other either; this is logical as money is dealt in common <strong>with</strong>in the household.<br />
Figure 61. Distribution <strong>of</strong> all People Above 14 according to<br />
the Lender<br />
47.9%<br />
2.5%<br />
0.4%<br />
0.1% 0.2% 0.4%<br />
0.9% 1.2% 1.7%<br />
7.3%<br />
37.3%<br />
Husband/Wife (7.3%)<br />
Father/Mother (37.3%)<br />
Brother/Sister (47.9%)<br />
Child/Other Relative<br />
(11.8%)<br />
Friend (0.1%)<br />
Local/Religious Leader<br />
(0.9%)<br />
Bank/Saving and Loans<br />
(2.5%)<br />
Boss (0.4%)<br />
Pr<strong>of</strong>essional Money Lender<br />
NGOs<br />
Other People<br />
Figure 62 (and Table 84 in the Annexure) show that persons <strong>with</strong> <strong>disability</strong> and non-disabled both rely fi rst<br />
<strong>of</strong> all on friends to get money when they need it. But this phenomenon is statistically signifi cantly more<br />
common for the non-disabled. Non-disabled persons benefi t more <strong>of</strong>ten from the support <strong>of</strong> their social<br />
network. In other words, their social capital seems slightly more effi cient. On the other hand, persons <strong>with</strong><br />
<strong>disability</strong> rely more on family: children especially (40.3% <strong>of</strong> them borrow from their children which is logical<br />
because persons <strong>with</strong> <strong>disability</strong> are older), but also siblings (11.3%) and parents (2%). Still, friends also are<br />
requested to lend money by 36.3% <strong>of</strong> persons <strong>with</strong> <strong>disability</strong>. Lenders who are not in the family are a higher<br />
proportion to lend money to persons <strong>with</strong> <strong>disability</strong>. This can be explained by the emergency <strong>of</strong> some needs.<br />
When a person needs to buy food or drugs, then he/she starts looking fi rst <strong>with</strong>in the personal network, then,<br />
in case <strong>of</strong> lack <strong>of</strong> fund or sometime refusal, they seek the pr<strong>of</strong>essional owners, employer, in some case banks.<br />
NGOs are mentioned as loans providers by 1.4% <strong>of</strong> persons <strong>with</strong> <strong>disability</strong> and by 0.15% <strong>of</strong> non-disabled.<br />
Fewer Assets for Persons <strong>with</strong> Disability: a Vulnerability Issue<br />
55
Figure 62. Distribution <strong>of</strong> Persons <strong>with</strong> Disability and Non-Disabled<br />
Above 14 according to the Lender<br />
50<br />
45<br />
40<br />
35<br />
30<br />
25<br />
20<br />
15<br />
10<br />
5<br />
0<br />
Persons <strong>with</strong> Disability<br />
Non-Disabled<br />
Husband/<br />
Wife<br />
Father/Mother<br />
Siblings<br />
Child/Other<br />
Relative<br />
Friend<br />
Local/Religious<br />
Leader<br />
Bank/Lender/<br />
NGO/Other<br />
Concluding on Borrowing Practices: Risk Factor or Capability<br />
Asset?<br />
Loan can be consider both as a factor <strong>of</strong> risk and as a factor <strong>of</strong> empowerment. For some people it can<br />
constitute a capability asset, whereas it represents for others a transitional survival…<br />
The characteristics <strong>of</strong> loans also show the link <strong>with</strong> <strong>vulnerability</strong>. People who make the highest loans are not<br />
the poorest but the ones who need to invest for the future or cover a special need. They usually have the<br />
capacity to pay back. They use a larger social network <strong>of</strong> friends and relatives to cover their needs. Elder men<br />
<strong>of</strong>fer more guarantee <strong>of</strong> security. The loan system seems to be based on the social capital. Reimbursement<br />
must be ensured, so higher income is also an asset.<br />
More vulnerable people such as persons <strong>with</strong> <strong>disability</strong> and women make loans but they cannot benefi t from<br />
the same network: they rely on parents or children (especially for women heads <strong>of</strong> household), and brothers (for<br />
persons <strong>with</strong> <strong>disability</strong>). Higher debt <strong>with</strong>out the same capacity to pay back or to have someone able to help<br />
in case <strong>of</strong> need would become a major burden. In this case, debt might be a factor <strong>of</strong> higher <strong>vulnerability</strong>. This<br />
possibly explains why women <strong>with</strong>out <strong>disability</strong> do not <strong>of</strong>ten take high loans. All together, it might also explain<br />
why women who are head <strong>of</strong> household or disabled women are particularly in debt: more vulnerable, <strong>with</strong><br />
unexpected expenses, they try to meet urgent needs by taking loan and hoping to fi nd a way to pay back later.<br />
Income through the Social Network: the Social Income<br />
The social capital theory considers that the individual is at the centre <strong>of</strong> a social network that is as valuable<br />
as his/her own assets: this human capital is measured by level <strong>of</strong> education, level <strong>of</strong> income, ownership <strong>of</strong><br />
goods, etc. The hypothesis is that each individual is part <strong>of</strong> a “social environment 41 ”, <strong>with</strong> which relations are<br />
maintained especially <strong>with</strong> regards to exchange <strong>of</strong> goods <strong>of</strong> services.<br />
Money Given: Family at the Basis <strong>of</strong> the Social Capital<br />
If income from activity is concentrated on a small proportion, redistribution <strong>with</strong>in the family is a common practice,<br />
in both groups. Questions regarding monetary exchanges were asked during the survey. Figure 63 (and Table 85 in<br />
the Annexure) show that 42.2% <strong>of</strong> all adults above 14 received money from the social network, mainly family. There<br />
is not a huge difference between disabled and non-disabled when it comes to receiving money, even if persons <strong>with</strong><br />
<strong>disability</strong> receive money more <strong>of</strong>ten (a proportion <strong>of</strong> 45.4% compared to a proportion <strong>of</strong> 38.9% for non-disabled).<br />
One difference, which is noticeable, is that women receive help more <strong>of</strong>ten than men. This is consistent <strong>with</strong> the fact<br />
that men are the ones who hold paid employment and bring the majority <strong>of</strong> money into the household.<br />
41 See BECKER G. S. (1976), Part 7: « Social Interactions », in The Economic Approach <strong>of</strong> Human Behavior, Chicago and London, the<br />
University <strong>of</strong> Chicago Press, 1976, pp. 251-282.<br />
56 Understanding Vulnerability <strong>of</strong> Afghans <strong>with</strong> Disability
Figure 63. Distribution <strong>of</strong> Persons <strong>with</strong> Disability and<br />
Non-Disabled Above 14 Receiving Money according to Gender<br />
80<br />
Received<br />
Not Received<br />
70<br />
60<br />
50<br />
40<br />
30<br />
20<br />
10<br />
0<br />
Non-Disabled Males<br />
Non-Disabled Females<br />
Males <strong>with</strong> Disability<br />
Females <strong>with</strong> Disability<br />
Figure 64 (and Table 86 in the Annexure) show a breakdown <strong>of</strong> persons <strong>with</strong> <strong>disability</strong> and non-disabled<br />
according to the donors. In both cases, a huge majority <strong>of</strong> the donors are from the family itself:<br />
For non-disabled persons, fi rst come the parents (28.9%) followed closely by the spouse (27.8%),<br />
then come brother and sister (23.2%) and children and other relatives in fourth position but far behind<br />
(10.9%);<br />
For persons <strong>with</strong> <strong>disability</strong>, fi rst come children and other relatives (24.6%), before brother and sister<br />
(22.6%), the spouse (19.7%) and parents (17.9%).<br />
The differences between both groups are highly statistically signifi cant. The major difference regarding the<br />
money received from children is probably due to the needs <strong>of</strong> persons <strong>with</strong> <strong>disability</strong> to get support. This is<br />
also in line <strong>with</strong> the NDSA results that show a high number <strong>of</strong> persons over the age <strong>of</strong> 45 among the persons<br />
<strong>with</strong> <strong>disability</strong> 42 . The children support their parents as they become disabled <strong>with</strong> age and/or disease.<br />
A minority <strong>of</strong> people receives money from persons outside the family. Friends are 5.4% to give money. Then<br />
other donors are quoted such as NGOs or employers mainly for persons <strong>with</strong> <strong>disability</strong>.<br />
Figure 64. Distribution <strong>of</strong> Persons <strong>with</strong> Disability and Non-Disabled<br />
Above 14 according to the 3 Main Donors<br />
30<br />
Persons <strong>with</strong> Disability<br />
Non-Disabled<br />
25<br />
20<br />
15<br />
10<br />
5<br />
0<br />
Husband/Wife<br />
Father/Mother Brother/Sister<br />
Children and<br />
other Family<br />
Members<br />
Friends State Pension Local or<br />
Religious<br />
Leader<br />
Employer,<br />
NGOs or<br />
Other<br />
42 See BAKHSHI P. et. al. (2006), op. cit.<br />
Fewer Assets for Persons <strong>with</strong> Disability: a Vulnerability Issue<br />
57
If one considers the order <strong>of</strong> the answers separately as in Table 87 in the Annexure, one fi nds that:<br />
For non-disabled people, the spouse appears to be quoted as the main donor in the 3 possible answers<br />
and even represents 66.6% <strong>of</strong> all the donors in the third answer;<br />
For persons <strong>with</strong> <strong>disability</strong>, the children and other family members appear to be the major donor whatever<br />
the answer considered.<br />
If NGOs and employers are quoted in the fi rst answer for the few persons <strong>with</strong> <strong>disability</strong> they give money<br />
to, it is probably because the amount <strong>of</strong> money is signifi cant, particularly over the recent years.<br />
State pensions or leaders <strong>of</strong> the community are quoted mainly in the third answer.<br />
Table 88 in the Annexure gives an overview according to gender <strong>of</strong> who the main donors are. In both groups,<br />
persons <strong>with</strong> <strong>disability</strong> and non-disabled, women receive a lot more from their husbands, which is logical<br />
considering the general family dynamics. This also seems obvious given the social and cultural context and<br />
the gender dynamics.<br />
Amounts Donated: Higher for Men<br />
Figure 65 (and Tables 89 and 90 in the Annexure) show that males more <strong>of</strong>ten receive higher amounts <strong>of</strong><br />
money than women, independently from the <strong>disability</strong> factor. 58.6% <strong>of</strong> non-disabled women and 58.3%<br />
<strong>of</strong> disabled women receive less than 3,200 AFAs a year whereas more than 25% <strong>of</strong> males disabled or not,<br />
receive more than 12,000 AFAs.<br />
Figure 65. Distribution <strong>of</strong> Persons <strong>with</strong> Disability and Non-Disabled<br />
above 14 by Amount <strong>of</strong> Money received and Gender<br />
40<br />
35<br />
Non-Disabled Males<br />
Non-Disabled Females<br />
Males <strong>with</strong> Disability<br />
Females <strong>with</strong> Disability<br />
30<br />
25<br />
20<br />
15<br />
10<br />
5<br />
0<br />
Less than 700 AFAs<br />
710 to 3200 AFAs 3300 to 12000 AFAs 12030 AFAs and Above<br />
Concluding on Social Income<br />
Men more <strong>of</strong>ten give money to the members <strong>of</strong> their social network, particularly to their spouses. If they are<br />
a lower proportion to receive money, they receive higher amounts than women. Donation <strong>of</strong> money is also<br />
part <strong>of</strong> the social control <strong>of</strong> men on women. Women are not allowed to work, especially in rural areas, so men<br />
provide the resources for their needs. If they inherit part <strong>of</strong> the family land, they hand it over to the male <strong>of</strong><br />
the family (sister to a brother, widow to a son) against a commitment <strong>of</strong> the latter to cover her needs.<br />
58 Understanding Vulnerability <strong>of</strong> Afghans <strong>with</strong> Disability
General Conclusions<br />
Disability: a Dormant Factor?<br />
In Afghanistan, poverty appears as a “great leveller”. This is evident in some <strong>of</strong> the fi ndings <strong>of</strong> the present<br />
report and can be said <strong>with</strong> regards to commodities, living spaces as well as other assets. Disability does<br />
not have an impact when the general population is faced <strong>with</strong> severe and chronic poverty. The lack <strong>of</strong> water,<br />
electricity and general commodities <strong>of</strong> the overall population lead to a very minimal difference between<br />
households <strong>of</strong> persons <strong>with</strong> <strong>disability</strong> and non-disabled households. The persons <strong>with</strong> <strong>disability</strong> are not<br />
necessarily the poorest <strong>of</strong> the poor. On the contrary, the low level <strong>of</strong> life standard is shared on an equal basis<br />
by all. An exception is the case <strong>of</strong> women, especially isolated women, who suffer from more discrimination<br />
and appear to be among the poorest, and this is true both in towns and rural areas.<br />
However, it is also essential to focus upon the few results that have been found regarding the small proportion<br />
<strong>of</strong> the population that is better <strong>of</strong>f than the majority. The trends observed lead to believe that <strong>with</strong> regards<br />
to livelihoods and living conditions, <strong>disability</strong> impacts the more advantaged social groups. This in turn led us<br />
to put forward the strong assumption that as conditions in general improve, the impact <strong>of</strong> <strong>disability</strong><br />
on livelihoods becomes salient. In order words, as households get out <strong>of</strong> poverty, households that have<br />
a disabled member will have to face more diffi culties, need more resources in order to improve their living<br />
conditions. Disability is thus a ‘dormant’ factor that is not on the forefront when faced <strong>with</strong> extreme poverty.<br />
However, at the second stage, this factor may have a heavy impact by keeping certain households more<br />
vulnerable to poverty and less equipped to face risks in life.<br />
Urban or Rural Settings: an Expected Difference<br />
Urban livelihood seems to be a little wealthier: better access to water, main power, fl ush, diet diversity, more<br />
equipment, larger size <strong>of</strong> houses and household… Unlike Schutte 43 who found more widespread nuclear<br />
households in Herat, urban households seem to be more extended. But the picture is not always positive.<br />
Ownership <strong>of</strong> house is less important. In case <strong>of</strong> incapacity to pay a rent, or if the person who provides<br />
the housing needs the house back, the family loses a major asset. Unemployment, underemployment and<br />
precarious conditions are more frequent in urban areas.<br />
Female-headed Households: the most Vulnerable and the<br />
Poorest<br />
Households headed by a woman are both the poorest and the most vulnerable. This fi nding corroborates<br />
NRVA 2003 analysis that identifi ed such households among the poor and very poor wealth groups. As shown<br />
by the NRVA 2003, NDSA 2005 fi nds that women head <strong>of</strong> household are a higher proportion having an<br />
income generating activity. These households have lower assets ownership and poor dietary diversity. They<br />
also face more isolation, thus are not able to rely on a strong social capital in case <strong>of</strong> shock occurrence.<br />
Households headed by women are more present in urban areas, probably because <strong>of</strong> highest isolation from<br />
the rest <strong>of</strong> the family who is in the village. Acceptance <strong>of</strong> women heads <strong>of</strong> household might be also higher in<br />
43 SCHUTTE S, (2006), “Poverty amid Prosperity: Urban Livelihood in Herat”, Afghanistan Research and Evaluation Unit, AREU, May<br />
2006, 61 pp.<br />
General Conclusions<br />
59
major towns and the social expectations and control a little less salient. Hence Afghan society maintains a strict<br />
control on women who must conform to traditional rules. As Dupree writes, “the hierarchical structure <strong>with</strong>in<br />
families leaves little room for individualism, for senior male members, the ultimate arbiters, maintain family<br />
honour and social status by ensuring all members conform to prescribed forms <strong>of</strong> acceptable behaviour 44 ”.<br />
Access to the Labour Market: a Matter <strong>of</strong> Perception<br />
The will to work is widespread among persons <strong>with</strong> <strong>disability</strong> and it is <strong>of</strong>ten a major claim they express.<br />
Opportunities <strong>of</strong> work are limited in an economy dominated by the agricultural sector, especially for the<br />
severely disabled and women <strong>with</strong> <strong>disability</strong>. Yet, the sector <strong>of</strong> services is rapidly growing stimulated by the<br />
reconstruction effort. Two major orientations could be followed in order to improve the situation. The fi rst one<br />
is the fi ght against stereotypes that lead to the belief that persons <strong>with</strong> <strong>disability</strong>, and especially women,<br />
cannot work due to their impairment. Sensitisation can also be achieved by mainstreaming persons <strong>with</strong><br />
<strong>disability</strong> in the workplace; this is a fi rst step towards their inclusion on the labour market. Changing social<br />
attitudes and beliefs is the only way to enable persons <strong>with</strong> <strong>disability</strong> to participate in the labour market.<br />
Because sensitisation is not enough, a second set <strong>of</strong> action, complementary to the sensitisation process, is<br />
the passing and implementing <strong>of</strong> the law <strong>with</strong> a requirement for employment <strong>of</strong> persons <strong>with</strong> <strong>disability</strong>. This<br />
obligation imposed to all employers, both <strong>with</strong>in the state administration and the private sector, is proactive<br />
and might decisively help persons <strong>with</strong> <strong>disability</strong> in their struggle for the right to employment.<br />
The Way Forward: Mainstreaming, Empowerment,<br />
Participation <strong>of</strong> Persons <strong>with</strong> Disability<br />
Gathering <strong>of</strong> knowledge on livelihood, <strong>vulnerability</strong>, risks and poverty provides <strong>understanding</strong>, information and<br />
insights necessary for policy formulation and strategic planning in the area <strong>of</strong> <strong>disability</strong>. A national <strong>disability</strong><br />
strategy framework based on such principles as empowerment and mainstreaming aims at increasing access<br />
for persons <strong>with</strong> <strong>disability</strong> to social and economic opportunities. Designs <strong>of</strong> policies and strategies have to rely<br />
on scientifi c based knowledge and on participation <strong>of</strong> persons <strong>with</strong> <strong>disability</strong> themselves in the elaboration<br />
process.<br />
This view, which has been put forward by a number <strong>of</strong> disabled persons’ organisations, tends to look at<br />
the barriers that exist <strong>with</strong>in the social context and that prevent a person from achieving the same level <strong>of</strong><br />
functioning as that <strong>of</strong> a non-disabled person. In this perspective it is society that needs to be redesigned in<br />
order to take into account the disabled persons’ needs. Mainstreaming persons <strong>with</strong> <strong>disability</strong> is a progressive<br />
way <strong>of</strong> reshaping society in order to better include them. Equalization <strong>of</strong> opportunities is a major goal put<br />
forward by the new United Nations Convention on the Rights <strong>of</strong> Persons <strong>with</strong> Disabilities adopted by the<br />
General Assembly on the 13th December 2006.<br />
44 DUPREE N. H. (2004), The Family during Crisis in Afghanistan, Journal <strong>of</strong> Comparative Family Studies, Vol. 35, 311:332, 2004.<br />
60 Understanding Vulnerability <strong>of</strong> Afghans <strong>with</strong> Disability
Bibliography<br />
ALDEN W., L. (2004), “Looking for Peace in the Pastures: Rural Land Relations in Afghanistan”, Afghanistan<br />
Research and Evaluation Unit, AREU, December 2004, 125 pp.<br />
ALLEN, J. C. & BARNES, D. F. (1985), “The Causes <strong>of</strong> Deforestation in Developing Countries”, Annals <strong>of</strong> the<br />
Association <strong>of</strong> American Geographers 75 (2), 163-184.<br />
BAKHSHI P., NOOR A. and TRANI J.F. (2006), “Towards Well-Being For Afghans With Disability: The Health<br />
Challenge”, Report to the Government <strong>of</strong> Afghanistan, Volume 2, <strong>Handicap</strong> International, Lyon and Kabul.<br />
BAKHSHI P., TRANI J.F., ROLLAND C. (2006b), “Conducting Surveys on Disability: a Comprehensive Toolkit”,<br />
<strong>Handicap</strong> International and Government <strong>of</strong> Afghanistan, Lyon and Kabul.<br />
BECKER G. S., (1976) “Social Interactions”, in The Economic Approach <strong>of</strong> Human Behavior, Part 7, Chicago<br />
and London, The University <strong>of</strong> Chicago Press, 1976, pp. 251-282.<br />
COLLIER P. (1998), « Social Capital and Poverty », Social Capital Initiative, Working Paper n°4, the World<br />
Bank, Washington.<br />
DEATON A. (1997), chapter 3: «Welfare, poverty and distribution», The Analysis <strong>of</strong> Household Surveys. A<br />
Microeconometric Approach to Development Policy, Baltimore and London, the Johns Hopkins University<br />
Press, pp. 133-202.<br />
DUBOIS J.L., ROUSSEAU S., (2001), “Reinforcing Household’s Capabilities as a Way to Reduce Vulnerability<br />
and Prevent Poverty in Equitable Terms”, paper presented at the fi rst Conference on the Capability Approach,<br />
Justice and Poverty: Examining Sen’s Capability Approach, June 5th-7th 2001, Von Hugel Institute, St<br />
Edmund’s College, Cambridge University, http://www.st-edmunds.cam.ac.uk/vhi/.<br />
DUCLOS J.-Y., ARAAR A. and FORTIN C., “DAD: a s<strong>of</strong>tware for Distributive Analysis / Analyse Distributive”,<br />
MIMAP programme, International Development Research Centre, Government <strong>of</strong> Canada, and CIRPÉE,<br />
University <strong>of</strong> Laval.<br />
DUPREE N. H. (2004), The Family during Crisis in Afghanistan, Journal <strong>of</strong> Comparative Family Studies, Vol.<br />
35, 2004.<br />
ELWAN, A. (1999), “Poverty and Disability, A Survey <strong>of</strong> the Literature”, Social Protection Discussion Paper<br />
Series, No. 9932, Social Protection Unit, Human Development Network, the World Bank, December 1999.<br />
EMADI H. (2002), Repression, Resistance, and Women in Afghanistan, Praeger/Greenwood, August 2002,<br />
216 p.<br />
ERB S. and HARRIS-WHITE B. (2001), Outcast from Social Welfare: Adult Disability and Incapacity in Rural<br />
South India, Books for Change, Bangalore.<br />
FOSTER J., GREER J. and THORBECKE E. (1984), « A class <strong>of</strong> decomposable poverty measures », Econometrica,<br />
1984, vol. 52, n°3, may, pp. 761-766.<br />
Bibliography<br />
61
HOOGEVEEN J. G. (2005), “Measuring Welfare for Small but Vulnerable Groups: Poverty and Disability in<br />
Uganda”, Journal <strong>of</strong> African Economies, 2005 14(4):603-631.<br />
INTERNATIONAL LABOR OFFICE (2006a), Out Of Work and in School: Our Development Challenge, Asia-Pacifi c<br />
Economic Cooperation, Publication <strong>of</strong> Project Experiences, 2001-2006 http://www.ilo.org/public/english/<br />
region/asro/bangkok/apec/download/book.pdf.<br />
INTERNATIONAL LABOR OFFICE (2006b), The end <strong>of</strong> child labour: Within reach, International Labour Conference<br />
95th Session 2006 Report I (B), Geneva, http://www.ilo.org/public/english/standards/relm/ilc/ilc95/pdf/repi-b.pdf.<br />
METS R. L. (2000), “Disability Issues, Trends And Recommendations For The World Bank”, World Bank,<br />
Washington D.C.<br />
RAVALLION M. (1998), “Poverty Lines in Theory and Practice, Living Standards Measurement Study”, Working<br />
Paper 133, World Bank, Washington DC, 1998.<br />
RAVALLION M. (1994), “Poverty Comparisons”, Fundamentals <strong>of</strong> Pure and Applied Economics, volume 56,<br />
Harwood Academic Publishers, Switzerland, 1994.<br />
SCHUTTE S. (2006), “Poverty amid Prosperity: Urban Livelihood in Herat”, Afghanistan Research and<br />
Evaluation Unit, AREU, May 2006, 61 pp.<br />
TZEMACH G.(2006), Women Entrepreneurs in post-confl ict economies: A Look at Rwanda and Afghanistan,<br />
Washington D.C., Center fro International Private Entreprise, www.cipe.org.<br />
UNITED NATIONS, DEPARTMENT OF INTERNATIONAL ECONOMIC AND SOCIAL AFFAIRS, STATISTICAL<br />
OFFICE (1990), “Disability Statistics Compendium”, Statistics on Special Population Groups, Series Y, No. 4,<br />
New York, 1990.<br />
VULNERABILITY ANALYSIS AND MAPPING UNIT OF THE WORLD FOOD PROGRAMME AND THE<br />
VULNERABILITY ANALYSIS UNIT OF THE MINISTRY OF RURAL REHABILITATION AND DEVELOPMENT<br />
(2004), Reports on Findings from the 2003 National Risk and Vulnerability Assessment (NRVA) in Rural<br />
Afghanistan, December 2004, 123 p., http://www.mrrd.gov.af/vau/.<br />
WOOD, W. B. (1989), “Long Time Coming: The Repatriation <strong>of</strong> Afghan Refugees”, Annals <strong>of</strong> the Association <strong>of</strong><br />
American Geographers, 79 (3), 345-369.<br />
WORLD BANK (2005), “Poverty, Vulnerability and Social Protection: an Initial Assessment.”, Afghanistan<br />
Report 29694-AF, 7 March 2005.<br />
62 Understanding Vulnerability <strong>of</strong> Afghans <strong>with</strong> Disability
Annexure<br />
Tables Related to Water Supply<br />
Table 12. Distribution <strong>of</strong> Households according to the Location <strong>of</strong> Drinking Water<br />
Location <strong>of</strong> Drinking Water Source†<br />
Within the compound/house<br />
Number<br />
% in location<br />
HH <strong>with</strong>out<br />
Person <strong>with</strong><br />
Disability†<br />
HH <strong>with</strong> at<br />
least One<br />
Person <strong>with</strong><br />
Disability<br />
Total<br />
5428 556 5984<br />
25.2** (1) 30.9** (1) 25.7<br />
Number<br />
16070 1244 17314<br />
Outside the compound/house<br />
% in location 74.8 69.1 74.3<br />
Total Number 21498 1800 23298<br />
Source: NDSA. Note: † Weighted by the number <strong>of</strong> household in the cluster <strong>with</strong>out Persons <strong>with</strong> Disabilities living there. (1)Test <strong>of</strong> comparison<br />
<strong>of</strong> proportion between households <strong>with</strong> and <strong>with</strong>out a Person <strong>with</strong> Disability. ** Signifi cant at p
Table 14. Distribution <strong>of</strong> Households according to Types <strong>of</strong> Water Supply<br />
Available<br />
Types <strong>of</strong> Water Supply<br />
Piped into residence/compound/plot<br />
Public tap<br />
Hand pump in residence/compound<br />
Public hand-pump<br />
Well in residence/compound<br />
Covered well<br />
Open well and kariz<br />
Spring<br />
River/stream<br />
Pond/lake<br />
Still water/dam<br />
Rain water<br />
Tanker, truck or other<br />
HH <strong>with</strong>out<br />
Person <strong>with</strong><br />
Disability†<br />
HH <strong>with</strong> at least<br />
One Person <strong>with</strong><br />
Disability<br />
Total<br />
Number 1193 105 1298<br />
% in Type <strong>of</strong> water supply 4.4 4.7 4.4<br />
Number 817 54 871<br />
% in Type <strong>of</strong> water supply 3.0 2.4 3.0<br />
Number 1387 131 1518<br />
% in Type <strong>of</strong> water supply 5.1 5.9 5.2<br />
Number 5038 418 5456<br />
% in Type <strong>of</strong> water supply 18.6 18.9 18.6<br />
Number 3566 349 3915<br />
% in Type <strong>of</strong> water supply 13.2** (1) 15.8** (1) 13.4<br />
Number 1808 153 1961<br />
% in Type <strong>of</strong> water supply 6.7 6.9 6.7<br />
Number 2560 192 2752<br />
% 9.5 8.7 9.4<br />
Number 3976 262 4238<br />
% in Type <strong>of</strong> water supply 14.7** (1) 11.8** (1) 14.5<br />
Number 5692 430 6122<br />
% 21.0 19.4 20.9<br />
Number 563 57 620<br />
% in Type <strong>of</strong> water supply 2.1 2.6 2.1<br />
Number 102 12 114<br />
% in Type <strong>of</strong> water supply 0.4 0.5 0.4<br />
Number 346 38 384<br />
% in Type <strong>of</strong> water supply 1.3 1.7 1.3<br />
Number 9 11 20<br />
% in Type <strong>of</strong> water supply 0.0 0.5 0.1<br />
Total Number 27057 2212 29269** (2)<br />
Source: NDSA. Note: Up to three answers were possible. † Weighted by the number <strong>of</strong> household in the cluster <strong>with</strong>out Persons <strong>with</strong><br />
Disabilities living there. (1)Test <strong>of</strong> comparison <strong>of</strong> proportion between households <strong>with</strong> and <strong>with</strong>out a Person <strong>with</strong> Disability. ** Signifi cant at<br />
p
Table 16. Distribution <strong>of</strong> Households according to Location <strong>of</strong> Drinking Water<br />
Available in Urban and Rural Areas and Gender <strong>of</strong> the Head <strong>of</strong> Household.<br />
Gender <strong>of</strong> Head <strong>of</strong> Household† Urban Rural Total<br />
Man<br />
Woman<br />
Within the compound/house<br />
Number 2991 2683 5674<br />
% in location<br />
category<br />
56.2** (1) 15.9 25.6<br />
Number 2332 14155 16487<br />
Outside the compound/house % in location<br />
category<br />
43.8 84.1 74.4<br />
Total Number 5323 16838 22161<br />
Within the compound/house<br />
Number 270 40 310<br />
% in location<br />
category<br />
63.2** (1) 5.8 27.9<br />
Number 157 645 802<br />
Outside the compound/house % in location<br />
category<br />
36.8 94.2 72.1<br />
Total Number 427 685 1112** (2)<br />
Source: NDSA. Note: † Weighted by the number <strong>of</strong> household in the cluster <strong>with</strong>out Persons <strong>with</strong> Disabilities living there. (1)Test <strong>of</strong> comparison<br />
<strong>of</strong> proportion between households headed by men or women. ** Signifi cant at p
Table 18. Distribution <strong>of</strong> Households according to Sources <strong>of</strong> Light Supply<br />
Available in Urban and Rural Areas<br />
Sources <strong>of</strong> Light Supply Urban Rural Total<br />
Main power<br />
Generator/battery/invertors<br />
Kerosene/petrol/gas<br />
Candles<br />
Number 337 95 432<br />
% in source <strong>of</strong> light 27.9** (1) 4.3** (1) 12.6<br />
Number 165 140 305<br />
% in source <strong>of</strong> light 13.7** (1) 6.3** (1) 8.9<br />
Number 669 1812 2481<br />
% in source <strong>of</strong> light 55.4** (1) 81.8** (1) 72.5<br />
Number 15 141 156<br />
% in source <strong>of</strong> light 1.2** (1) 6.4** (1) 4.6<br />
Number 21 25 46<br />
Other<br />
% in source <strong>of</strong> light 1.7 1.1 1.3<br />
Total Number 1207 2215 3422** (2)<br />
Source: NDSA. Note: Two answers were possible. (1)Test <strong>of</strong> comparison <strong>of</strong> proportion between households <strong>with</strong> and <strong>with</strong>out a Person <strong>with</strong><br />
Disability. ** Signifi cant at p
Tables Related to Cooking Energy Supply<br />
Table 20. Distribution <strong>of</strong> Households according to Sources <strong>of</strong> Energy for<br />
Cooking<br />
Sources <strong>of</strong> Energy for Cooking<br />
Gas<br />
Stove <strong>with</strong> kerosene/petrol<br />
Firewood<br />
Dung<br />
Charcoal<br />
Electricity<br />
HH <strong>with</strong>out<br />
Person <strong>with</strong><br />
Disability†<br />
HH <strong>with</strong> at least<br />
One Person<br />
<strong>with</strong> Disability<br />
Total<br />
Number 3908 317 4262<br />
% in source <strong>of</strong> energy 10.3 10.2 10.4<br />
Number 668 38 706<br />
% in source <strong>of</strong> energy 1.8 1.2 1.7<br />
Number 18181 1476 19657<br />
% in source <strong>of</strong> energy 47.9 47.6 47.9<br />
Number 12975 998 13973<br />
% in source <strong>of</strong> energy 34.2 32.2 34.1<br />
Number 433 54 487<br />
% in source <strong>of</strong> energy 1.1 1.7 1.2<br />
Number 355 27 382<br />
% in source <strong>of</strong> energy 0.9 0.9 0.9<br />
Number 1407 150 1557<br />
Other<br />
% in source <strong>of</strong> energy 3.7 4.8 3.8<br />
Total Number 37927 3099 41026<br />
Source: NDSA. Note: Two answers were possible. † Weighted by the number <strong>of</strong> household in the cluster <strong>with</strong>out Persons <strong>with</strong> Disabilities<br />
living there. (1)Test <strong>of</strong> comparison <strong>of</strong> proportion between households <strong>with</strong> and <strong>with</strong>out a Person <strong>with</strong> Disability. ** Signifi cant at p
Tables Related to Toilet Facilities<br />
Table 22. Distribution <strong>of</strong> Households according to Access to Types <strong>of</strong> Toilet<br />
Facilities<br />
Kind <strong>of</strong> Toilet Facility<br />
Private fl ush inside<br />
Private fl ush outside<br />
Shared fl ush<br />
Traditional pit<br />
Open backed<br />
Open defecation fi eld outside the<br />
house<br />
HH <strong>with</strong>out<br />
Person <strong>with</strong><br />
Disability†<br />
HH <strong>with</strong> at least<br />
One Person <strong>with</strong><br />
Disability<br />
Total<br />
Number 658 96 754<br />
% in type <strong>of</strong> toilet facility 3.1** (1) 5.3** (1) 3.2<br />
Number 300 18 318<br />
% in type <strong>of</strong> toilet facility 1.4 1.0 1.4<br />
Number 292 34 326<br />
% in type <strong>of</strong> toilet facility 1.4 1.9 1.4<br />
Number 3704 170 3874<br />
% in type <strong>of</strong> toilet facility 17.3** (1) 9.4** (1) 16.6<br />
Number 10103 1006 11109<br />
% in type <strong>of</strong> toilet facility 47.1** (1) 55.8** (1) 47.7<br />
Number 6368 473 6841<br />
% in type <strong>of</strong> toilet facility 29.7** (1) 26.2** (1) 29.4<br />
Number 43 5 48<br />
Other<br />
% in type <strong>of</strong> toilet facility 0.2 0.3 0.2<br />
Total Number 21468 1802 23270** (2)<br />
Source: NDSA. Note: † Weighted by the number <strong>of</strong> household in the cluster <strong>with</strong>out Persons <strong>with</strong> Disabilities living there. (1)Test <strong>of</strong> comparison<br />
<strong>of</strong> proportion between households <strong>with</strong> and <strong>with</strong>out a Person <strong>with</strong> Disability. ** Signifi cant at p
Tables Related to Housing<br />
Table 24. Distribution <strong>of</strong> Households by Number <strong>of</strong> Rooms in the House<br />
Number <strong>of</strong> Rooms<br />
1or 2 rooms<br />
3 rooms<br />
4 rooms<br />
5 rooms<br />
6 rooms<br />
HH <strong>with</strong>out<br />
Person <strong>with</strong><br />
Disability†<br />
HH <strong>with</strong> at least<br />
One Person <strong>with</strong><br />
Disability<br />
Total<br />
Number 3188 307 3495<br />
% in number <strong>of</strong> rooms 15.0 17.2 15.2<br />
Number 4610 351 4961<br />
% in number <strong>of</strong> rooms 21.7 19.6 21.5<br />
Number 4134 373 4507<br />
% in number <strong>of</strong> rooms 19.4 20.9 19.6<br />
Number 3400 287 3687<br />
% in number <strong>of</strong> rooms 16.0 16.1 16.0<br />
Number 3129 178 3307<br />
% in number <strong>of</strong> rooms 14.7** (1) 10.0** (1) 14.3<br />
Number 2804 292 3096<br />
7 rooms and more<br />
% in number <strong>of</strong> rooms 13.2** (1) 16.3** (1) 13.4<br />
Total Number 21265† 1788 23053<br />
Source: NDSA. Note: † Weighted by the number <strong>of</strong> household in the cluster <strong>with</strong>out Persons <strong>with</strong> Disabilities living there. (1)Test <strong>of</strong> comparison<br />
<strong>of</strong> proportion between households <strong>with</strong> and <strong>with</strong>out a Person <strong>with</strong> Disability. ** Signifi cant at p
Table 26. Distribution <strong>of</strong> People according to Number <strong>of</strong> Rooms in the House by<br />
Urban and Rural Settings<br />
Number <strong>of</strong> Rooms† Urban Rural Total<br />
1or 2 rooms<br />
3 rooms<br />
4 rooms<br />
5 rooms<br />
6 rooms<br />
Number 458 3037 3495<br />
% in number <strong>of</strong> rooms 8.0** (1) 17.6** (1) 15.2<br />
Number 875 4086 4961<br />
% in number <strong>of</strong> rooms 15.2** (1) 23.6** (1) 21.5<br />
Number 921 3586 4507<br />
% in number <strong>of</strong> rooms 16.0** (1) 20.7** (1) 19.6<br />
Number 1074 2613 3687<br />
% in number <strong>of</strong> rooms 18.7** (1) 15.1** (1) 16.0<br />
Number 1042 2265 3307<br />
% in number <strong>of</strong> rooms 18.1** (1) 13.1** (1) 14.3<br />
Number 1381 1715 3096<br />
7 rooms and more<br />
% in number <strong>of</strong> rooms 24.0** (1) 9.9** (1) 13.4<br />
Total Number 5751 17302 23053** (2)<br />
Source: NDSA. Note: † Weighted by the number <strong>of</strong> household in the cluster <strong>with</strong>out Persons <strong>with</strong> Disabilities living there. (1)Test <strong>of</strong> comparison<br />
<strong>of</strong> proportion between households <strong>with</strong> and <strong>with</strong>out a Person <strong>with</strong> Disability. ** Signifi cant at p
Tables Related to Food Supply<br />
Table 28. Distribution <strong>of</strong> Households according to Sources for Supply <strong>of</strong> Food<br />
Types <strong>of</strong> Supply <strong>of</strong> Food<br />
Market/bazaar<br />
Self provided/farm<br />
Combination <strong>of</strong> market/farm<br />
Food aid<br />
HH <strong>with</strong>out<br />
Person <strong>with</strong><br />
Disability†<br />
HH <strong>with</strong> at least<br />
One Person<br />
<strong>with</strong> Disability<br />
Total<br />
Number 14198 1166 15364<br />
% in type <strong>of</strong> supply 60.3 60.2 60.3<br />
Number 1899 134 2033<br />
% in type <strong>of</strong> supply 8.1 6.9 8.0<br />
Number 7290 614 7904<br />
% in type <strong>of</strong> supply 30.9 31.7 31.0<br />
Number 75 2 77<br />
% in type <strong>of</strong> supply 0.3 0.1 0.3<br />
Number 75 16 91<br />
From family, other relatives<br />
% in type <strong>of</strong> supply 0.3 0.8 0.4<br />
Total Number 23564 1936 25500<br />
Source: NDSA. Note: Two answers were possible. † Weighted by the number <strong>of</strong> household in the cluster <strong>with</strong>out Persons <strong>with</strong> Disabilities<br />
living there. (1)Test <strong>of</strong> comparison <strong>of</strong> proportion between households <strong>with</strong> and <strong>with</strong>out a Person <strong>with</strong> Disability. ** Signifi cant at p
Table 30. Distribution <strong>of</strong> Households according to Sufficiency <strong>of</strong> Food<br />
Food Sufficiency†<br />
Always enough<br />
Sometimes not enough<br />
Frequently not enough<br />
Always not enough<br />
Always enough but <strong>with</strong> poor quality<br />
HH <strong>with</strong>out<br />
Person <strong>with</strong><br />
Disability†<br />
HH <strong>with</strong> a<br />
Persons <strong>with</strong><br />
Disability<br />
Total<br />
Number 3498 227 3725<br />
% in quantity <strong>of</strong> food 16.4** (1) 12.6** (1) 16.1<br />
Number 3522 291 3813<br />
% in quantity <strong>of</strong> food 16.5 16.2 16.4<br />
Number 4267 350 4617<br />
% in quantity <strong>of</strong> food 20.0 19.5 19.9<br />
Number 3425 294 3719<br />
% in quantity <strong>of</strong> food 16.0 16.3 16.0<br />
Number 6671 636 7307<br />
% in quantity <strong>of</strong> food 31.2** (1) 35.4** (1) 31.5<br />
Total Number 21383 1799 23182** (2)<br />
Source: NDSA. Note: † Weighted by the number <strong>of</strong> household in the cluster <strong>with</strong>out Persons <strong>with</strong> Disabilities living there. (1)Test <strong>of</strong> comparison<br />
<strong>of</strong> proportion between households <strong>with</strong> and <strong>with</strong>out a Person <strong>with</strong> Disability. ** Signifi cant at p
Table 32. Distribution <strong>of</strong> Households according to Gender <strong>of</strong> the Head <strong>of</strong> the<br />
Household and Sufficiency <strong>of</strong> Food<br />
Food Sufficiency†<br />
Always enough<br />
Sometimes not enough<br />
Frequently not enough<br />
Always not enough<br />
Always enough but <strong>with</strong> poor quality<br />
Man Head <strong>of</strong><br />
the HH<br />
Woman Head<br />
<strong>of</strong> the HH<br />
Total<br />
Number 3588 137 3725<br />
% in quantity <strong>of</strong> food 16.3** (1) 12.3** (1) 16.1<br />
Number 3591 222 3813<br />
% in quantity <strong>of</strong> food 16.3** (1) 20.0** (1) 16.4<br />
Number 4449 144 4593<br />
% in quantity <strong>of</strong> food 20.2 13.0 19.8<br />
Number 3444 305 3749<br />
% in quantity <strong>of</strong> food 15.6** (1) 27.5** (1) 16.2<br />
Number 7005 303 7308<br />
% in quantity <strong>of</strong> food 31.7** (1) 27.3** (1) 31.5<br />
Total Number 22078 1111 23189** (2)<br />
Source: NDSA. Note:. † Weighted by the number <strong>of</strong> household in the cluster <strong>with</strong>out Persons <strong>with</strong> Disabilities living there. (1)Test <strong>of</strong> comparison<br />
<strong>of</strong> proportion between households headed by a man or a woman. ** Signifi cant at p
Table 34. Distribution <strong>of</strong> Households according to the Ratio <strong>of</strong> Employed<br />
Members<br />
Share <strong>of</strong> Members in the HH Who Work †<br />
No one<br />
Less than 25%<br />
25 to 50%<br />
50% to 75%<br />
HH <strong>with</strong>out<br />
Person <strong>with</strong><br />
Disability<br />
HH <strong>with</strong> a Person<br />
<strong>with</strong> Disability<br />
Total<br />
Number 868451 288401 1156852<br />
% in ratio category 4.4 5.8 4.6<br />
Number 11736107 3132790 14868897<br />
% in ratio category 59.0** (1) 62.6** (1) 59.7<br />
Number 6196077 1355615 7551692<br />
% in ratio category 31.2** (1) 27.1** (1) 30.3<br />
Number 993165 221497 1214662<br />
% in ratio category 5.0 4.4 4.9<br />
Number 92236 6496 98732<br />
More than 75%<br />
% in ratio category 0.5 0.1 0.4<br />
Total Number 19886036** (2) 5004799** (2) 24890835<br />
Source: NDSA. Note: † Weighted by the population <strong>of</strong> the province. (1) Test <strong>of</strong> comparison <strong>of</strong> proportion between Persons <strong>with</strong> Disabilities<br />
and Non-Disabled. ** Signifi cant at p
Table 36. Distribution <strong>of</strong> Persons <strong>with</strong> Disability and Non-Disabled Between 14<br />
and 65 according to the Employment Situation and Gender (analysis on series<br />
<strong>of</strong> questions)<br />
Gender Employment Situation† Non-disabled<br />
Males<br />
Females<br />
Working<br />
Persons <strong>with</strong><br />
<strong>disability</strong><br />
Total<br />
Number 5055204 125364 5180568<br />
% in Employment situation 82.6** (1) 57.6** (1) 81.7<br />
Number 1064356 92236 1156592<br />
Not Working<br />
% in Employment situation 17.4 42.4 18.3<br />
Total Number 6119560** (2) 217600** (2) 6337160<br />
Working<br />
Number 598887 14290 613177<br />
% in Employment situation 13.2 9.5 13.1<br />
Number 3948627 135756 4084383<br />
Not Working<br />
% in Employment situation 86.8 90.5 86.9<br />
Total Number 4547514* (2) 150046* (2) 4697560<br />
Source: NDSA. Note: † Weighted by the population <strong>of</strong> the province. (1) Test <strong>of</strong> comparison <strong>of</strong> proportion between Persons <strong>with</strong> Disabilities<br />
and Non-Disabled. ** Signifi cant at p
76 Understanding Vulnerability <strong>of</strong> Afghans <strong>with</strong> Disability<br />
Table 38. Distribution <strong>of</strong> People according to Pr<strong>of</strong>ession<br />
Code Pr<strong>of</strong>ession† Number %<br />
Animal husbandry, shepherd, animal keeper 203309 3.8<br />
Architect/mohandes 14290 0.3<br />
Artist/singer/danser/writer/painter/rangmal 8444 0.2<br />
Baker/nalwa 16238 0.3<br />
Banker 4546 0.1<br />
Bookshop 1948 0.0<br />
Butcher/kassab 12991 0.2<br />
Carpenter 31178 0.6<br />
Carpet weaver, rag weaver 285802 5.3<br />
Car salesman 12991 0.2<br />
Cashier/ sharaf/ munshi/ clerk/ accountant 7794 0.1<br />
Chemist 5846 0.1<br />
Cleaner 388432 7.3<br />
Computer specialist/motakhasis computer 4546 0.1<br />
Cook 12341 0.2<br />
Doctor 25982 0.5<br />
Driver/pilot 215651 4.0<br />
Editor(newspaper, books) 3247 0.1<br />
Electrician/barki 3897 0.1<br />
Farmer 2126633 39.7<br />
Shopkeeper/dehkandar 347510 6.5<br />
Fortune tailor, palm reader(Kafbin) 1299 0.0<br />
Fruit and vegetables salesman 31828 0.6<br />
Gelkar/building worker 513146 9.6<br />
Guard/tchukidor 34426 0.6<br />
Hairdresser/barber/salmon 8444 0.2<br />
Hotelshi 10392 0.2<br />
Ingenior 13640 0.3<br />
Iron worker meldar/ahiingar 12341 0.2<br />
Jeweler/zargar 2598 0.0<br />
Journalist 649 0.0<br />
Judge 649 0.0<br />
Khatat/painter <strong>of</strong> banners 1299 0.0<br />
Lawyer 3247 0.1<br />
Lender <strong>of</strong> money/sutrur 649 0.0<br />
Mechanic/mestari 98082 1.8<br />
Megaran/work <strong>with</strong> driver, make people pay bus 3897 0.1<br />
Mullah, religious leader 51314 1.0<br />
Nurse 17537 0.3<br />
Other service provider 8444 0.2<br />
Plumber/naldawa 2598 0.0<br />
Policeman 58459 1.1<br />
Pr<strong>of</strong>essor at the university 3247 0.1<br />
Public employee/military <strong>of</strong>fi cer 157191 2.9<br />
Public announcer(jar zan) 1299 0.0<br />
Real estate agent /rahnamaia mamalat 3247 0.1<br />
Repairer/khabarnagar 1948 0.0<br />
Shoemaker/muchi 9743 0.2<br />
(Table 38 contd. on next page)
(Table 38 contd. from previous page)<br />
Code Pr<strong>of</strong>ession† Number %<br />
Businessman 34426 0.6<br />
Soldier/mudjahidin 38973 0.7<br />
Stone mason 3247 0.1<br />
Street vendor (newspaper, shoe cleaner, etc.) 44169 0.8<br />
Tailor/khayat, fl ower sewer/hat maker 108475 2.0<br />
Tch<strong>of</strong>rosh/wood-cutter 16238 0.3<br />
Teacher 170182 3.2<br />
Translator 4546 0.1<br />
Waiter/garsun 5846 0.1<br />
Macon/steel maker 21435 0.4<br />
Repair man for electronics 7794 0.1<br />
De-miner 2598 0.0<br />
Owner <strong>of</strong> industry 1299 0.0<br />
Renter <strong>of</strong> houses and other services and goods 4546 0.1<br />
Coolie/porter 31828 0.6<br />
Little jobs not mentioned elsewhere 54562 1.0<br />
Veterinarian 2598 0.0<br />
Surveyor 4546 0.1<br />
Other 649 0.0<br />
Total 5343215 99.9<br />
Source: NDSA. † Weighted by the population <strong>of</strong> the province.<br />
Table 39. Distribution <strong>of</strong> Persons <strong>with</strong> Disability and Non-Disabled Above 14<br />
according to the Activity Status<br />
Status <strong>of</strong> Activity†<br />
Landowner/mortgager<br />
Daily/weekly wage worker<br />
Contract worker<br />
Occasional worker<br />
Apprentice<br />
Family helper<br />
Self employed<br />
Employer<br />
Non-Disabled<br />
Persons <strong>with</strong><br />
Disability<br />
Total<br />
Number 1760286 38324 1798610<br />
% in status 35.9* (1) 28.9* (1) 35.7<br />
Number 982123 27281 1009404<br />
% in status 20.0 20.6 20.0<br />
Number 761275 22085 783360<br />
% in status 15.5 16.7 15.6<br />
Number 133808 8444 142252<br />
% in status 2.7** (1) 6.4** (1) 2.8<br />
Number 63007 650 63657<br />
% in status 1.3 0.5 1.3<br />
Number 285153 5196 290349<br />
% in status 5.8 3.9 5.8<br />
Number 908723 27931 936654<br />
% in status 18.5 21.1 18.6<br />
Number 5196 0 5196<br />
% in status 0.1 0.0 0.1<br />
Number 3897 2598 6495<br />
Other status<br />
% in status 0.1 2.0 0.1<br />
Total Number 4903468 132509 5035977<br />
Source: NDSA. Note: † Weighted by the population <strong>of</strong> the province. (1) Test <strong>of</strong> comparison <strong>of</strong> proportion between Person <strong>with</strong> Disability and<br />
Non-Disabled. ** Signifi cant at p
Table 40. Distribution <strong>of</strong> Persons <strong>with</strong> Disability and Non-Disabled Above 14<br />
according to the Farmer Status<br />
Status <strong>of</strong> Farmers †<br />
Landlord/khan<br />
Landowner/malik/zamindar/mulkdar<br />
Farmer/sharecropper/mortgager<br />
Tenant/khistmand<br />
Labourer/worker/kargar<br />
Non-Disabled<br />
Persons <strong>with</strong><br />
Disability<br />
Total<br />
Number 187201 1949 189150<br />
% in status 5.7 2.7 5.6<br />
Number 551859 12341 564200<br />
% in status 16.8 17.0 16.8<br />
Number 1562043 27281 1589324<br />
% in status 47.5 37.5 47.3<br />
Number 192138 6496 198634<br />
% in status 5.8 8.9 5.9<br />
Number 733344 20786 754130<br />
% in status 22.3 28.6 22.5<br />
Number 59759 3897 63656<br />
Family helper<br />
% in status 1.8 5.4 1.9<br />
Total Number 3286344 72750 3359094<br />
Source: NDSA. Note: † Weighted by the population <strong>of</strong> the province. (1) Test <strong>of</strong> comparison <strong>of</strong> proportion between Person <strong>with</strong> Disability and<br />
Non-Disabled. ** Signifi cant at p
Table 42. Distribution <strong>of</strong> Children <strong>with</strong> Disability and Non-Disabled Children<br />
Aged 7 to 15 according to Activity and Gender<br />
Type <strong>of</strong> Activity Gender† Non-Disabled<br />
Household tasks<br />
Fieldwork<br />
Other work<br />
Male<br />
Female<br />
Male<br />
Female<br />
Male<br />
Female<br />
Children <strong>with</strong><br />
Disability<br />
Total<br />
Number 5361403 39623 5401026<br />
% in activity type 75.2** (1) 42.4** (1) 74.8<br />
Number 5088461 40922 5129383<br />
% in activity type 91.5** (1) 61.2** (1) 91.2<br />
Number 1757168 13641 1770809<br />
% in activity type 24.7** (1) 14.6** (1) 24.5<br />
Number 423248 1299 424547<br />
% in activity type 7.6** (1) 1.9** (1) 7.5<br />
Number 470406 7145 477551<br />
% in activity type 6.6 7.6 6.6<br />
Number 119647 0 119647<br />
% in activity type 2.2 0.0 2.1<br />
Source: NDSA. Note: † Weighted by the population <strong>of</strong> the province. (1)Test <strong>of</strong> comparison <strong>of</strong> proportion between Non-Disabled and Person<br />
<strong>with</strong> Disability. ** Signifi cant at p
Table 44. Distribution <strong>of</strong> Children <strong>with</strong> Disability and Non-Disabled Children<br />
Aged 7 to 15 according to Types <strong>of</strong> Household Tasks and Gender<br />
Gender<br />
Boys<br />
Girls<br />
Types <strong>of</strong> Tasks†<br />
Cooking<br />
Cleaning<br />
Fetching water/fi ll tanker<br />
Taking care <strong>of</strong> other member <strong>of</strong> family<br />
Laundry<br />
Doing the grocery shopping<br />
Non-<br />
Disabled<br />
Persons <strong>with</strong><br />
Disability<br />
Total<br />
Number 71061 0 71061<br />
% in task type 1.3 0.0 1.3<br />
Number 1275591 5197 1280788<br />
% in task type 23.8 13.1 23.7<br />
Number 4750044 30530 4780574<br />
% in task type 88.6 77.1 88.5<br />
Number 1228953 8444 1237397<br />
% in task type 22.9 21.3 22.9<br />
Number 108864 1299 110163<br />
% in task type 2.0 3.3 2.0<br />
Number 3835735 22085 3857820<br />
% in task type 71.5 55.7 71.4<br />
Number 505871 5197 511068<br />
Other<br />
% in task type 9.4 13.1 9.5<br />
Total Number 5361403 39623 5401026<br />
Cooking<br />
Cleaning<br />
Fetching water/fi ll tanker<br />
Taking care <strong>of</strong> other member <strong>of</strong> family<br />
Laundry<br />
Doing the grocery shopping<br />
Number 1597509 8445 1605954<br />
% in task type 31.4 20.6 31.3<br />
Number 4036186 29880 4066066<br />
% in task type 79.3 73.0 79.3<br />
Number 3448992 24033 3473025<br />
% in task type 67.8 58.7 67.7<br />
Number 643576 7145 650721<br />
% in task type 12.6 17.5 12.7<br />
Number 2026212 11043 2037255<br />
% in task type 39.8 27.0 39.7<br />
Number 582907 5197 588104<br />
% in task type 11.5 12.7 11.5<br />
Number 87170 650 87820<br />
Other<br />
% in task type 1.7 1.6 1.7<br />
Total Number 5088461 40922 5129383<br />
Source: NDSA. Note: † Weighted by the population <strong>of</strong> the province. Some fi gures should be considered <strong>with</strong> caution due to low number <strong>of</strong><br />
observations.<br />
80 Understanding Vulnerability <strong>of</strong> Afghans <strong>with</strong> Disability
Table 45. Distribution <strong>of</strong> Boys <strong>with</strong> Disability and Non-Disabled Boys Aged 7 to<br />
15 according to Types <strong>of</strong> Field Work<br />
Types <strong>of</strong> Field Work†<br />
Work the soil, harvest<br />
Look after animals<br />
Fetch and carry things<br />
Guarding the products<br />
Non-disabled<br />
Persons <strong>with</strong><br />
Disability<br />
Total<br />
Number 1060069 9743 1069812<br />
% in task type 60.2 71.4 60.3<br />
Number 1259872 12342 1272214<br />
% in task type 71.6 90.5 71.7<br />
Number 1109564 5847 1115411<br />
% in task type 63.1 42.9 62.9<br />
Number 732955 1950 734905<br />
% in task type 41.7 14.3 41.4<br />
Number 176288 1300 177588<br />
Other, specify<br />
% in task type 10.0 9.5 10.0<br />
Total Number 1759766 13641 1773407<br />
Source: NDSA. Note: † Weighted by the population <strong>of</strong> the province. 3 Responses possible.<br />
Table 46. Distribution <strong>of</strong> Boys <strong>with</strong> Disability and Non-Disabled Boys Aged 7 to<br />
15 according to Types <strong>of</strong> Jobs<br />
Types <strong>of</strong> Jobs†<br />
Odd jobs (rag-picking, bottle collecting...)<br />
Help someone we know in his/her work<br />
Employed in a fi xed job<br />
Employed in occasional job<br />
Independent small job (shoe polish,<br />
newspaper vendor...)<br />
Non-Disabled<br />
Persons <strong>with</strong><br />
Disability†<br />
Total<br />
Number 7145 0 7145<br />
% in job type 1.5 0.0 1.5<br />
Number 70411 650 71061<br />
% in job type 15.0 9.1 14.9<br />
Number 86261 650 86911<br />
% in job type 18.3 9.1 18.2<br />
Number 80415 2599 83014<br />
% in job type 17.1 36.4 17.4<br />
Number 76647 0 76647<br />
% in job type 16.3 0.0 16.0<br />
Number 149527 3897 153424<br />
Other, apprentice<br />
% in job type 31.8 54.5 32.1<br />
Total Number 470406 7146 477552<br />
Source: NDSA. Note: † Weighted by the population <strong>of</strong> the province. Some fi gures should be considered <strong>with</strong> caution due to low number <strong>of</strong><br />
observations.<br />
Annexure<br />
81
Tables Related to Income<br />
Table 47. Monthly Activity Income <strong>of</strong> Active People<br />
For Adults 15-64<br />
Classes <strong>of</strong> Income† Number % by Class Valid %<br />
Cumulate<br />
%<br />
For All Population<br />
Number % by Class Valid %<br />
Cumulate<br />
%<br />
0 AFAs 329063 2.9 6.0 6.0 2252906 8.7 26.5 26.5<br />
100 to 1000 AFAs 561863 5.0 10.3 16.3 946267 3.7 11.1 37.6<br />
1100 to 2000 AFAs 924053 8.2 16.9 33.1 1134378 4.4 13.3 51.0<br />
2100 to 3000 AFAs 1241554 11.0 22.7 55.8 1321189 5.1 15.5 66.5<br />
3050 to 4000 AFAs 846886 7.5 15.5 71.3 867022 3.3 10.2 76.7<br />
4050AFAs to 5500 AFAs 686966 6.1 12.5 83.8 691513 2.7 8.1 84.9<br />
6000 AFAs and more 824671 7.3 15.1 98.9 840261 3.2 9.9 94.7<br />
Refuse or don’t know 60278 0.5 1.1 100.0 447282 1.7 5.3 100.0<br />
Total 5475334 48.5 100.0 8500818 32.8 100.0<br />
Do not work 5825573 51.5 17424105 67.2<br />
Total 11300907 100.0 25924922 100.0<br />
Source: NDSA. Note: Some fi gures should be considered <strong>with</strong> caution due to low number <strong>of</strong> observations.† Weighted by the number <strong>of</strong> inhabitants in the province.<br />
Table 48. Distribution <strong>of</strong> Active Persons Aged 15-64 <strong>with</strong> Disability and<br />
Non-Disabled according to the Monthly Pr<strong>of</strong>essional Income<br />
Classes <strong>of</strong> Income<br />
0 AFAs<br />
100 to 1000 AFAs<br />
1100 to 2000 AFAs<br />
2100 to 3000 AFAs<br />
3050 to 4000 AFAs<br />
4050AFAs to 5500 AFAs<br />
6000 AFAs and more<br />
0 AFAs<br />
Persons <strong>with</strong><br />
Disability<br />
Non-Disabled†<br />
Total<br />
Number 12341 316722 329063<br />
% in income 9.3 5.9 6.0<br />
Number 20786 541077 561863<br />
% in income 15.6 10.1 10.3<br />
Number 35725 888327 924052<br />
% in income 26.8** 16.6** 16.9<br />
Number 25982 1215572 1241554<br />
% in income 19.5 22.8 22.7<br />
Number 12341 834545 846886<br />
% in income 9.3 15.6 15.5<br />
Number 8444 678522 686966<br />
% in income 6.3* 12.7* 12.5<br />
Number 14940 809732 824672<br />
% in income 11.2 15.2 15.1<br />
Number 2598 57680 60278<br />
Refuse or don’t know<br />
% <strong>of</strong> income 2.0 1.1 1.1<br />
Total Number 133157 5342177 5475334<br />
Source: NDSA. Note: † Weighted by the population <strong>of</strong> the province. (1) Test <strong>of</strong> comparison <strong>of</strong> proportion between Persons <strong>with</strong> Disabilities<br />
and Non-Disabled. ** Signifi cant at p
Table 49. Distribution <strong>of</strong> Active Males Aged 15-64 <strong>with</strong> Disability and Non-<br />
Disabled according to the Monthly Pr<strong>of</strong>essional Income<br />
Classes <strong>of</strong> Income<br />
Males <strong>with</strong><br />
<strong>disability</strong><br />
Non-disabled<br />
Males †<br />
Total<br />
0 AFAs Number 12341 249428 261769<br />
% in income 9.9 5.2 5.3<br />
100 to 1000 AFAs Number 15589 401813 417402<br />
% in income 12.5 8.4 8.5<br />
1100 to 2000 AFAs Number 33127 781801 814928<br />
% in income 26.6** (1) 16.3** (1) 16.5<br />
2100 to 3000 AFAs Number 25982 1090728 1116710<br />
% in income 20.8 22.7 22.6<br />
3050 to 4000 AFAs Number 11692 809082 820774<br />
% in income 9.4* (1) 16.8* (1) 16.6<br />
4050AFAs to 5500 AFAs Number 8444 645655 654099<br />
% in income 6.8* (1) 13.4* (1) 13.3<br />
6000 AFAs and more<br />
0 AFAs<br />
Refuse or don’t know<br />
Number 14940 773357 788297<br />
% in income 12.0 16.1 16.0<br />
Number 2598 57680 60278<br />
% <strong>of</strong> income 2.1 1.2 1.2<br />
Total Number 124713 4809544 4934257<br />
Source: NDSA. Note: Some fi gures should be considered <strong>with</strong> caution due to low number <strong>of</strong> observations.† Weighted by the population <strong>of</strong><br />
the province. (1) Test <strong>of</strong> comparison <strong>of</strong> proportion between Persons <strong>with</strong> Disabilities and Non-Disabled. ** Signifi cant at p
(Table 50 Contd. from previous page)<br />
List <strong>of</strong> Goods<br />
Tractor<br />
Generator<br />
Kerosene lamp<br />
Sewing machine<br />
House or apartment<br />
Non-Disabled<br />
Persons <strong>with</strong><br />
Disability†<br />
Total<br />
Number 37 16 53<br />
% in type <strong>of</strong> good 2.1 1.7 1.9<br />
Number 192 86 278<br />
% in type <strong>of</strong> good 11.1 9.1 10.1<br />
Number 1674 926 2600<br />
% in type <strong>of</strong> good 97.0 97.6 97.3<br />
Number 839 411 1250<br />
% in type <strong>of</strong> good 48.6** (1) 43.3** (1) 46.0<br />
Number 1346 727 2073<br />
% in type <strong>of</strong> good 78.0 76.7 77.4<br />
Source: NDSA. Note: †Some fi gures should be considered <strong>with</strong> caution due to low number <strong>of</strong> observations. (1) Test <strong>of</strong> comparison <strong>of</strong> proportion<br />
between Persons <strong>with</strong> Disabilities and Non-Disabled. ** Signifi cant at p
Table 52. Distribution <strong>of</strong> Households according to the Ownership <strong>of</strong> Goods and<br />
Equipments by Urban and Rural Settings<br />
List <strong>of</strong> Goods and Equipments† Urban Rural Total<br />
Radio<br />
Television<br />
Pressure cooker<br />
Oven, hotplate<br />
Refrigerator<br />
Bukhari<br />
Bicycle<br />
Motorbike<br />
Car<br />
Tractor<br />
Generator<br />
Kerosene lamp<br />
Sewing machine<br />
House or apartment<br />
Number 4949 11831 16780<br />
% in type <strong>of</strong> good 86.1** (1) 67.7** (1) 76.9<br />
Number 3383 1712 5095<br />
% in type <strong>of</strong> good 58.6** (1) 9.8** (1) 34.2<br />
Number 4783 8827 13610<br />
% in type <strong>of</strong> good 83.5** (1) 50.5** (1) 67.0<br />
Number 514 968 1482<br />
% in type <strong>of</strong> good 8.9** (1) 5.5** (1) 7.2<br />
Number 1190 60 1250<br />
% in type <strong>of</strong> good 20.6** (1) 0.3** (1) 10.5<br />
Number 3503 7929 11432<br />
% in type <strong>of</strong> good 60.7** 45.4** 53.0<br />
Number 3104 4284 7388<br />
% in type <strong>of</strong> good 53.8** (1) 24.6** (1) 39.2<br />
Number 907 1431 2338<br />
% in type <strong>of</strong> good 15.7** (1) 8.2** (1) 12.0<br />
Number 623 382 1005<br />
% in type <strong>of</strong> good 10.8** (1) 2.2** (1) 6.5<br />
Number 111 487 598<br />
% in type <strong>of</strong> good 1.9** (1) 2.8** (1) 2.4<br />
Number 1604 1220 2824<br />
Percent 27.8** (1) 7.0** (1) 17.4<br />
Number 5527 16911 22438<br />
% in type <strong>of</strong> good 95.7 96.7 96.2<br />
Number 3698 8076 11774<br />
% in type <strong>of</strong> good 64.3** (1) 46.2** (1) 55.3<br />
Number 3846 14396 18242<br />
% in type <strong>of</strong> good 66.6** (1) 82.3** (1) 74.5<br />
Source: NDSA. Note: † Weighted by the number <strong>of</strong> household in the cluster <strong>with</strong>out Persons <strong>with</strong> Disabilities living there. (1) Test <strong>of</strong> comparison<br />
<strong>of</strong> proportion between Persons <strong>with</strong> Disabilities and Non-Disabled. ** Signifi cant at p
Table 53. Distribution <strong>of</strong> Households according to Gender <strong>of</strong> the Head <strong>of</strong><br />
Household and Ownership <strong>of</strong> Goods and Equipments<br />
Goods and Equipments<br />
Radio<br />
Television<br />
Pressure cooker<br />
Oven, hotplate<br />
Refrigerator<br />
Bukhari<br />
Bicycle<br />
Motorbike<br />
Car<br />
Tractor<br />
Generator<br />
Kerosene lamp<br />
Sewing machine<br />
House or apartment<br />
Man Head <strong>of</strong><br />
the HH<br />
Woman Head<br />
<strong>of</strong> the HH<br />
Total<br />
Number 16186 569 16755<br />
% in type <strong>of</strong> good 73.2** (1) 52.5** (1) 62.9<br />
Number 4863 207 5070<br />
% in type <strong>of</strong> good 22.0 19.1 20.6<br />
Number 13045 540 13585<br />
% in type <strong>of</strong> good 59.0** (1) 50.8** (1) 54.9<br />
Number 1422 60 1482<br />
% in type <strong>of</strong> good 6.4 5.5 6.0<br />
Number 1220 30 1250<br />
% in type <strong>of</strong> good 5.5** (1) 2.8** (1) 4.1<br />
Number 10984 423 11407<br />
% in type <strong>of</strong> good 49.6** (1) 39.1** (1) 44.3<br />
Number 7109 254 7363<br />
% in type <strong>of</strong> good 32.2** (1) 23.5** (1) 27.8<br />
Number 2213 100 2313<br />
% in type <strong>of</strong> good 10.0 9.2 9.6<br />
Number 1005 0 1005<br />
% in type <strong>of</strong> good 4.5** (1) 0.0** (1) 2.3<br />
Number 596 2 598<br />
% in type <strong>of</strong> good 2.7 0.2 1.4<br />
Number 2677 147 2824<br />
% in type <strong>of</strong> good 12.1 13.6 12.8<br />
Number 21379 1034 22413<br />
% in type <strong>of</strong> good 96.5 95.5 96.0<br />
Number 11197 577 11774<br />
% in type <strong>of</strong> good 50.6 53.3 51.9<br />
Number 17462 780 18242<br />
% in type <strong>of</strong> good 78.8** (1) 72.0** (1) 75.4<br />
Source: NDSA. Note: † Weighted by the number <strong>of</strong> household in the cluster <strong>with</strong>out Persons <strong>with</strong> Disabilities living there. (1) Test <strong>of</strong> comparison<br />
<strong>of</strong> proportion between Persons <strong>with</strong> Disabilities and Non-Disabled. ** Signifi cant at p
Table 55. Distribution <strong>of</strong> Households according to Ownership <strong>of</strong> Livestock<br />
Ownership <strong>of</strong> Livestock<br />
Owns livestock<br />
HH <strong>with</strong>out<br />
Person <strong>with</strong><br />
Disability†<br />
HH <strong>with</strong> a<br />
Persons <strong>with</strong><br />
Disabilities<br />
Total<br />
Number 15413 1297 16710<br />
% in ownership category 73.6 73.2 73.5<br />
Number 5536 475 6011<br />
Do not own livestock<br />
% in ownership category 26.4 26.8 26.5<br />
Total Number 20949 1772 22721<br />
Source: NDSA. Note:† Weighted by the number <strong>of</strong> household in the cluster <strong>with</strong>out Persons <strong>with</strong> Disabilities living there. (1)Test <strong>of</strong> comparison<br />
<strong>of</strong> proportion between households <strong>with</strong> and <strong>with</strong>out a Person <strong>with</strong> Disability. ** Signifi cant at p
(Table 58 contd. from previous page)<br />
Types <strong>of</strong> Animals<br />
No cow<br />
1 cows<br />
2 cows<br />
3 cows<br />
Non-<br />
Disabled<br />
Persons<br />
<strong>with</strong><br />
Disability<br />
Total<br />
Number 987 573 1560<br />
% in animal category 56.8 59.8 57.9<br />
Number 330 172 502<br />
% in animal category 19.0 18.0 18.6<br />
Number 272 141 413<br />
% in animal category 15.7 14.7 15.3<br />
Number 73 36 109<br />
% in animal category 4.2 3.8 4.0<br />
Number 76 36 112<br />
4 Cows and more<br />
% in animal category 4.4 3.8 4.2<br />
Total Number 1738 958 2696<br />
No goats<br />
1 to 5 Goats<br />
Number 1345 760 2105<br />
% in animal category 77.4 79.3 78.1<br />
Number 313 156 469<br />
% in animal category 18.0 16.3 17.4<br />
Number 80 42 122<br />
6 Goats and more<br />
% in animal category 4.6 4.4 4.5<br />
Total Number 1738 958 2696<br />
No horses<br />
1 horse<br />
Number 1672 931 2603<br />
% in animal category 96.2 97.2 96.6<br />
Number 49 23 72<br />
% in animal category 2.8 2.4 2.7<br />
Number 17 4 21<br />
2 Horses and more<br />
% in animal category 1.0 0.4 0.8<br />
Total Number 1738 958 2696<br />
No donkey<br />
1 donkey<br />
Number 1158 654 1812<br />
% in animal category 66.6 68.3 67.2<br />
Number 441 237 678<br />
% in animal category 25.4 24.7 25.1<br />
Number 139 67 206<br />
2 donkeys and more<br />
% in animal category 8.0 7.0 7.6<br />
Total Number 1738 958 2696<br />
No chicken<br />
1 to 3 chickens<br />
4 to 6 chickens<br />
Number 785 451 1236<br />
% in animal category 45.2 47.1 45.8<br />
Number 382 197 579<br />
% in animal category 22.0 20.6 21.5<br />
Number 300 162 462<br />
% in animal category 17.3 16.9 17.1<br />
Number 271 148 419<br />
7 chickens and more<br />
% in animal category 15.6 15.4 15.5<br />
Total Number 1738 958 2696<br />
No rooster<br />
Number 1656 924 2580<br />
% in animal category 95.3 96.5 95.7<br />
(Table 60 contd. on next page)<br />
88 Understanding Vulnerability <strong>of</strong> Afghans <strong>with</strong> Disability
(Table 58 contd. from previous page)<br />
Types <strong>of</strong> Animals<br />
1 rooster<br />
Non-<br />
Disabled<br />
Persons<br />
<strong>with</strong><br />
Disability<br />
Total<br />
Number 62 28 90<br />
% in animal category 3.6 2.9 3.3<br />
Number 20 6 26<br />
2 roosters and more<br />
% in animal category 1.2 0.6 1.0<br />
Total Number 1738 958 2696<br />
No camel<br />
Number 1715 951 2666<br />
% in animal category 98.7 99.3 98.9<br />
Number 23 7 30<br />
1 camels and more<br />
% in animal category 1.3 0.7 1.1<br />
Total Number 1738 958 2696<br />
Source: NDSA.<br />
Table 59. Distribution <strong>of</strong> Households according to Ownership <strong>of</strong> Different Types<br />
<strong>of</strong> Animals<br />
Types <strong>of</strong> Animals<br />
0 sheep<br />
1 to 5 sheep<br />
HH <strong>with</strong>out Person<br />
<strong>with</strong> Disability†<br />
HH <strong>with</strong> a<br />
Persons <strong>with</strong><br />
Disabilities<br />
Total<br />
Number 16370 1409 17779<br />
% in animal category 76.0* (1) 78.0* (1) 76.1<br />
Number 3735 264 3999<br />
% in animal category 17.3** (1) 14.6** (1) 17.1<br />
Number 1437 133 1570<br />
6 sheep and more<br />
% in animal category 6.7 7.4 6.7<br />
Total Number 21542 1806 23348<br />
0 cow<br />
1 cows<br />
2 cows<br />
3Cows<br />
Number 11907 1056 12963<br />
% in animal category 55.3** (1) 58.5** (1) 55.5<br />
Number 4206 330 4536<br />
% in animal category 19.5 18.3 19.4<br />
Number 3351 281 3632<br />
% in animal category 15.6 15.6 15.6<br />
Number 1018 69 1087<br />
% in animal category 4.7 3.8 4.7<br />
Number 1060 70 1130<br />
4 cows and more<br />
% in animal category 4.9* (1) 3.9* (1) 4.8<br />
Total Number 21542 1806 23348<br />
0 goats<br />
1 to 5 goats<br />
Number 16101 1434 17535<br />
% in animal category 74.7** (1) 79.4** (1) 75.1<br />
Number 4343 293 4636<br />
% in animal category 20.2** (1) 16.2** (1) 19.9<br />
Number 1098 79 1177<br />
6 goats and more<br />
% in animal category 5.1 4.4 5.0<br />
Total Number 21542 1806 23348<br />
(Table 59 contd. on next page)<br />
Annexure<br />
89
(Table 59 contd. from previous page)<br />
Types <strong>of</strong> Animals<br />
0 horses<br />
1 horse<br />
HH <strong>with</strong>out Person<br />
<strong>with</strong> Disability†<br />
HH <strong>with</strong> a<br />
Persons <strong>with</strong><br />
Disabilities<br />
Total<br />
Number 20581 1752 22333<br />
% in animal category 95.5** (1) 97.0** (1) 95.7<br />
Number 628 46 674<br />
% in animal category 2.9 2.5 2.9<br />
Number 333 8 341<br />
2 horses and more<br />
% in animal category 1.5** (1) 0.4** (1) 1.5<br />
Total Number 21542 1806 23348<br />
0 donkey<br />
1 donkey<br />
Number 14237 1218 15455<br />
% in animal category 66.1 67.4 66.2<br />
Number 5457 458 5915<br />
% in animal category 25.3 25.4 25.3<br />
Number 1848 130 1978<br />
2 donkeys and more<br />
% in animal category 8.6* (1) 7.2* (1) 8.5<br />
Total Number 21542 1806 23348<br />
0 chicken<br />
1 to 3 chickens<br />
4 to 6 chickens<br />
Number 9884 823 10707<br />
% in animal category 45.9 45.6 45.9<br />
Number 4549 386 4935<br />
% in animal category 21.1 21.4 21.1<br />
Number 3809 311 4120<br />
% in animal category 17.7 17.2 17.6<br />
Number 3300 286 3586<br />
7 chickens and more<br />
% in animal category 15.3 15.8 15.4<br />
Total Number 21542 1806 23348<br />
0 Rooster<br />
1 Rooster<br />
Number 20498 1734 22232<br />
% in animal category 95.2 96.0 95.2<br />
Number 668 61 729<br />
% in animal category 3.1 3.4 3.1<br />
Number 376 11 387<br />
2 Roosters and More<br />
% in animal category 1.7** (1) 0.6** (1) 1.7<br />
Total Number 21542 1806 23348<br />
0 Camel<br />
Number 21109 1793 22902<br />
% in animal category 98.0** (1) 99.3** (1) 98.1<br />
Number 433 13 446<br />
1 Camels and More<br />
% in animal category 2.0 0.7 1.9<br />
Total Number 21542 1806 23348<br />
Source: NDSA. Note:† Weighted by the number <strong>of</strong> household in the cluster <strong>with</strong>out persons <strong>with</strong> disabilities living there. (1)Test <strong>of</strong> comparison<br />
<strong>of</strong> proportion between households <strong>with</strong> and <strong>with</strong>out a persons <strong>with</strong> <strong>disability</strong>. ** Signifi cant at p
Table 60. Distribution <strong>of</strong> People according to Gender <strong>of</strong> the Head <strong>of</strong> the Household<br />
and Ownership <strong>of</strong> Animals by Types <strong>of</strong> Animals<br />
Types <strong>of</strong> Animals Man Head <strong>of</strong> the HH Woman Head <strong>of</strong> the HH Total<br />
0 sheep<br />
1 to 5 sheep<br />
Number 16776 978 17754<br />
% in animal category 75.5** (1) 87.9** (1) 76.1<br />
Number 3865 134 3999<br />
% in animal category 17.4** (1) 12.1** (1) 17.1<br />
Number 1570 0 1570<br />
6 sheep and more<br />
% in animal category 7.1** (1) 0.0** (1) 6.7<br />
Total Number 22211 1112 23323<br />
0 cow<br />
1 cows<br />
2 cows<br />
3cows<br />
Number 12064 874 12938<br />
% in animal category 54.3** (1) 78.6** (1) 55.5<br />
Number 4409 127 4536<br />
% in animal category 19.9** (1) 11.4** (1) 19.4<br />
Number 3550 82 3632<br />
% in animal category 16.0** (1) 7.4** (1) 15.6<br />
Number 1085 2 1087<br />
% in animal category 4.9** (1) 0.2** (1) 4.7<br />
Number 1103 27 1130<br />
4 cows and more<br />
% in animal category 5.0** (1) 2.4** (1) 4.8<br />
Total Number 22211 1112 23323<br />
0 Goats<br />
1 to 5 goats<br />
Number 16606 904 17510<br />
% in animal category 74.8** (1) 81.3** (1) 75.1<br />
Number 4503 133 4636<br />
% in animal category 20.3** (1) 12.0** (1) 19.9<br />
Number 1102 75 1177<br />
6 goats and more<br />
% in animal category 5.0** (1) 6.7** (1) 5.0<br />
Total Number 22211 1112 23323<br />
0 horses<br />
1 horse<br />
Number 21196 1112 22308<br />
% in animal category 95.4** (1) 100.0** (1) 95.6<br />
Number 674 0 674<br />
% in animal category 3.0** (1) 0.0** (1) 2.9<br />
Number 341 0 341<br />
2 horses and more<br />
% in animal category 1.5** (1) 0.0** (1) 1.5<br />
Total Number 22211 1112 23323<br />
0 donkey<br />
1 donkey<br />
Number 14482 948 15430<br />
% in animal category 65.2** (1) 85.3** (1) 66.2<br />
Number 5751 164 5915<br />
% in animal category 25.9** (1) 14.7** (1) 25.4<br />
Number 1978 0 1978<br />
2 donkeys and more<br />
% in animal category 8.9** (1) 0.0** (1) 8.5<br />
Total Number 22211 1112 23323<br />
0 chicken<br />
1 to 3 chickens<br />
Number 10239 468 10707<br />
% in animal category 46.1** (1) 42.1** (1) 45.9<br />
Number 4567 343 4910<br />
% in animal category 20.6** (1) 30.8** (1) 21.1<br />
(Table 60 contd. on next page)<br />
Annexure<br />
91
(Table 60 contd. from previous page)<br />
Types <strong>of</strong> Animals Man Head <strong>of</strong> the HH Woman Head <strong>of</strong> the HH Total<br />
4 to 6 chickens<br />
Number 3932 188 4120<br />
% in animal category 17.7 16.9 17.7<br />
Number 3473 113 3586<br />
7 chickens and more<br />
% in animal category 15.6** (1) 10.2** (1) 15.4<br />
Total Number 22211 1112 23323<br />
0 rooster<br />
1 rooster<br />
Number 21122 1085 22207<br />
% in animal category 95.1** (1) 97.6** (1) 95.2<br />
Number 702 27 729<br />
% in animal category 3.2 2.4 3.1<br />
Number 387 0 387<br />
2 roosters and more<br />
% in animal category 1.7** (1) 0.0** (1) 1.7<br />
Total Number 22211 1112 23323<br />
0 camel<br />
Number 21765 1112 22877<br />
% in animal category 98.0 100.0 98.1<br />
Number 446 0 446<br />
1 camels and more<br />
% in animal category 2.0** (1) 0.0** (1) 1.9<br />
Total Number 22211 1112 23323** (2)<br />
Source: NDSA. Note: (1)Test <strong>of</strong> comparison <strong>of</strong> proportion between households <strong>with</strong> and <strong>with</strong>out a persons <strong>with</strong> disabilities. ** Signifi cant at<br />
p
Table 63. Distribution <strong>of</strong> Households according to Ownership <strong>of</strong> Land by Urban<br />
and Rural Areas<br />
Ownership <strong>of</strong> Land† Urban Rural Total<br />
Own land<br />
Number 1766 11010 12776<br />
% in ownership category 30.8** (1) 63.3** (1) 55.2<br />
Number 3964 6393 10357<br />
Do not own land<br />
% in ownership category 69.2 36.7 44.8<br />
Total Number 5730 17403 23133** (2)<br />
Source: NDSA. Note:† Weighted by the number <strong>of</strong> household in the cluster <strong>with</strong>out persons <strong>with</strong> disabilities living there. (1) Test <strong>of</strong> comparison<br />
<strong>of</strong> proportion between Urban and Rural. ** Signifi cant at p
Table 67. Distribution <strong>of</strong> Households according to the Size <strong>of</strong> the Land which is<br />
Cultivable<br />
Size <strong>of</strong> the Land Belonging to the Family†<br />
HH <strong>with</strong>out<br />
Person <strong>with</strong><br />
Disability<br />
HH <strong>with</strong> a Persons<br />
<strong>with</strong> Disability<br />
Total<br />
No land<br />
0.01 to 0.5 jerib<br />
Number 9466182 2250048 11716230<br />
% in land size 45.2 46.4 45.4<br />
Number 1243113 246180 1489293<br />
% in land size 5.9 5.1 5.8<br />
0.51 to 1 jerib<br />
Number 1867982 461182 2329164<br />
% in land size 8.9 9.5 9.0<br />
1.05 to 2 jerib Number 2108576 538479 2647055<br />
% in land size 10.1 11.1 10.3<br />
2.1 to 4 jerib<br />
Number 2808014 546273 3354287<br />
% in land size 13.4 11.3 13.0<br />
Number 3466010 809991 4276001<br />
4 to 140 jerib<br />
% in land size 16.5 16.7 16.6<br />
Total Number 20959877 4852153 25812030<br />
Source: NDSA. Note: † Weighted by the population <strong>of</strong> the province. (1) Test <strong>of</strong> comparison <strong>of</strong> proportion between household <strong>with</strong> and <strong>with</strong>out<br />
Persons <strong>with</strong> Disabilities. ** Signifi cant at p
Table 69. Distribution <strong>of</strong> Households according to Gender <strong>of</strong> the Head <strong>of</strong> the<br />
Household and to the Size <strong>of</strong> the Land <strong>of</strong> the Family which is Cultivable<br />
Size <strong>of</strong> the Land Belonging to the Family†<br />
No land cultivable<br />
0.01 to 0.5 jerib<br />
0.51 to 1 jerib<br />
1.05 to 2 jerib<br />
2.1 to 4 jerib<br />
Man Head <strong>of</strong><br />
the HH<br />
Woman Head<br />
<strong>of</strong> the HH<br />
Total<br />
Number 11190223 493530 11683753<br />
% in land size 44.8** (1) 60.1** (1) 45.3<br />
Number 1467988 21305 1489293<br />
% in land size 5.9 2.6 5.8<br />
Number 2286034 43130 2329164<br />
% in land size 9.2 5.3 9.0<br />
Number 2485186 161868 2647054<br />
% in land size 10.0** (1) 19.7** (1) 10.3<br />
Number 3278289 75998 3354287<br />
% in land size 13.1 9.3 13.0<br />
Number 4251059 24943 4276002<br />
4 to 140 jerib<br />
% in land size 17.0** (1) 3.0** (1) 16.6<br />
Total Number 24958779** (2) 820774** (2) 25779553<br />
Source: NDSA. Note: † Weighted by the population <strong>of</strong> the province. (1) Test <strong>of</strong> comparison <strong>of</strong> proportion between Men and women head <strong>of</strong><br />
household. ** Signifi cant at p
Table 71. Distribution <strong>of</strong> Persons <strong>with</strong> Disability and Non-Disabled above 14<br />
Having Taken a Loan in the Last 5 Years according to Gender and Age<br />
Disability† Gender Loan Less than 25 26 or More Total<br />
Non-Disabled<br />
Persons <strong>with</strong> Disability<br />
Males<br />
Females<br />
Males<br />
Females<br />
Loan<br />
Number 1015510 2071681 3087191<br />
% in category 38.7** (1) 51.4** (1) 46.4<br />
Number 1608421 1959179 3567600<br />
No Loan<br />
% in category 61.3 48.6 53.6<br />
Total Number 2623931 4030860 6654791<br />
Loan<br />
Number 225265 701127 926392<br />
% in category 9.8** (1) 30.1** (1) 20.0<br />
Number 2079476 1628557 3708033<br />
No Loan<br />
% in category 90.2 69.9 80.0<br />
Total Number 2304741** (2) 2329684 4634425<br />
Loan<br />
Number 20786 108475 129261<br />
% in category 32.7** (1) 55.3** (1) 49.8<br />
Number 42870 87690 130560<br />
No Loan<br />
% in category 67.3 44.7 50.2<br />
Total Number 63656 196165 259821<br />
Loan<br />
Number 8444 37674 46118<br />
% in category 18.8** (1) 29.4** (1) 26.7<br />
Number 36375 90288 126663<br />
No Loan<br />
% in category 81.2 70.6 73.3<br />
Total Number 44819** (2) 127962 172781<br />
Source: NDSA. Note: † Weighted by the population <strong>of</strong> the province. (1) test <strong>of</strong> comparison <strong>of</strong> proportion between Persons <strong>with</strong> Disabilities<br />
and Non-Disablities. ** Signifi cant at p
Table 73. Distribution <strong>of</strong> Persons <strong>with</strong> Disability and Non-Disabled Above 14 Having Taken a Loan in the<br />
Last 5 Years according to the Major Geographical Areas<br />
Disability†<br />
Non-Disabled<br />
Persons <strong>with</strong><br />
Disability<br />
Loan<br />
Loan<br />
Central<br />
Region<br />
Western<br />
Region<br />
Eastern<br />
Region<br />
Southern<br />
Region<br />
North Western<br />
Region<br />
North Eastern<br />
Region<br />
Number 1143991 691903 631105 389471 531983 667350 4055803<br />
% in category 34.4** (1) 42.6 35.9 34.7** (1) 32.0* (1) 37.0** (1) 35.9<br />
No Number 2178857 930418 1125544 732435 1131650 1134508 7233412<br />
Loan % in category 65.6 57.4 64.1 65.3 68.0 63.0 64.1<br />
Total Number 3322848** (2) 1622321 1756649 1121906 1663633 1801858 11289215<br />
Loan<br />
Number 65605 32478 20136 17538 20136 19487 175380<br />
% in category 45.1** (1) 40.7 35.2 35.5** (1) 35.2* (1) 42.9** (1) 40.4<br />
No Number 79245 46768 37024 31828 37024 25333 257222<br />
Loan % in category 54.5 58.5 64.8 64.5 64.8 55.7 59.2<br />
Total Number 145500** (2) 79896 57160 49366 57160 45470 434552<br />
Total<br />
Source: NDSA. Note: † Weighted by the population <strong>of</strong> the province. (1) test <strong>of</strong> comparison <strong>of</strong> proportion between Persons <strong>with</strong> Disabilities and Non-Disablities by region. ** Signifi cant at<br />
p
Table 75. Distribution <strong>of</strong> Persons <strong>with</strong> Disability and Non-Disabled above 14<br />
according to the Amounts <strong>of</strong> Loans and Age Groups<br />
Disability† Amount <strong>of</strong> Loan Less than 25 26 or More Total<br />
Non-Disabled<br />
Persons <strong>with</strong><br />
Disability<br />
30 to 5000 AFAs<br />
5100 to 12000 AFAs<br />
12100 to 30000 AFAs<br />
Number 429224 726589 1155813<br />
% in amount category 34.6** (1) 26.2** (1) 28.8<br />
Number 366867 682030 1048897<br />
% in amount category 29.6 24.6 26.2<br />
Number 371674 587195 958869<br />
% in amount category 30.0 21.2 23.9<br />
Number 73010 774396 847406<br />
31000 AFAs and above<br />
% in amount category 5.9** (1) 28.0** (1) 21.1<br />
Total Number 1240775** (2) 2770210** (2) 4010985<br />
30 to 5000 AFAs<br />
5100 to 12000 AFAs<br />
12100 to 30000 AFAs<br />
Number 11692 34426 46118<br />
% in amount category 40.0** (1) 23.6** (1) 26.3<br />
Number 6496 35076 41572<br />
% in amount category 22.2 24.0 23.7<br />
Number 8444 37024 45468<br />
% in amount category 28.9 25.3 25.9<br />
Number 2598 39623 42221<br />
31000 AFAs and above<br />
% in amount category 8.9** (1) 27.1** (1) 24.1<br />
Total Percent 29230* (2) 146149* (2) 175379<br />
Source: NDSA. Note: † Weighted by the population <strong>of</strong> the province. (1) test <strong>of</strong> comparison <strong>of</strong> proportion between less and more than 25<br />
years old. ** Signifi cant at p
Table 77. Distribution <strong>of</strong> Persons <strong>with</strong> Disability and Non-Disabled above 14<br />
according to the Amounts <strong>of</strong> Loans and Living Area<br />
Disability† Amount <strong>of</strong> Loan Urban Rural Total<br />
Non-Disabled<br />
Persons <strong>with</strong><br />
Disability<br />
30 to 5000 AFAs<br />
5100 to 12000 AFAs<br />
12100 to 30000 AFAs<br />
Number 279827 875986 1155813<br />
% in amount category 28.3 29.0 28.8<br />
Number 214482 837662 1052144<br />
% in amount category 21.7* (1) 27.7* (1) 26.2<br />
Number 255274 703595 958869<br />
% in amount category 25.8 23.3 23.9<br />
Number 239165 604993 844158<br />
31000 AFAs and above<br />
% in amount category 24.2 20.0 21.0<br />
Total Number 988748 3022236 4010984<br />
30 to 5000 AFAs<br />
5100 to 12000 AFAs<br />
12100 to 30000 AFAs<br />
Number 11692 34426 46118<br />
% in amount category 20.0* 29.4* 26.3<br />
Number 13641 27931 41572<br />
% in amount category 23.3 23.9 23.7<br />
Number 14940 30529 45469<br />
% in amount category 25.6 26.1 25.9<br />
Number 18187 24033 42220<br />
31000 AFAs and above<br />
% in amount category 31.1** (1) 20.6** (1) 24.1<br />
Total Number 58460 116919 175379<br />
Source: NDSA. Note: † Weighted by the population <strong>of</strong> the province. (1) test <strong>of</strong> comparison <strong>of</strong> proportion between urban and rural areas. **<br />
Signifi cant at p
Table 79. Distribution <strong>of</strong> Persons <strong>with</strong> Disability and Non-Disabled above 14<br />
according to the Level <strong>of</strong> Debt by Age Group<br />
Disability or Not Debt in Quartiles† Less than 25 26 or More Total<br />
Non-Disabled<br />
Persons <strong>with</strong><br />
Disability<br />
0 to 1500 AFAs<br />
1800 to 7800 AFAs<br />
8000 to 20000<br />
AFAs<br />
Number 428964 702685 1131649<br />
% in debt amount category 34.6** (1) 25.3** (1) 28.2<br />
Number 295936 611618 907554<br />
% in debt amount category 23.9 22.1 22.6<br />
Number 430393 738411 1168804<br />
% in debt amount category 34.7 26.6 29.1<br />
20500 AFAs and Number 85481 720093 805574<br />
above<br />
% in debt amount category 6.9** (1) 26.0** (1) 20.1<br />
Total Number 1240774* (2) 2772807* (2) 4013581<br />
0 to 1500 AFAs<br />
1800 to 7800 AFAs<br />
8000 to 20000<br />
AFAs<br />
Number 4547 20786 25333<br />
% in debt amount category 15.6 14.2 14.4<br />
Number 9743 35725 45468<br />
% in debt amount category 33.3** (1) 24.4** (1) 25.9<br />
Number 9094 40922 50016<br />
% in debt amount category 31.1 28.0 28.5<br />
20500 AFAs and Number 5846 48716 54562<br />
above<br />
% in debt amount category 20.0** (1) 33.3** (1) 31.1<br />
Total Number 29230 146149 175379<br />
Source: NDSA. Note: † Weighted by the population <strong>of</strong> the province. (1) test <strong>of</strong> comparison <strong>of</strong> proportion between less and more than 25<br />
years old. ** Signifi cant at p
Table 81. Distribution <strong>of</strong> Persons <strong>with</strong> <strong>disability</strong> and Non-disabled Above 14<br />
according to the Level <strong>of</strong> Debt by Living Area<br />
Disability or Not Debt in Quartiles† Urban Rural Total<br />
Non-Disabled<br />
Persons <strong>with</strong><br />
Disability<br />
0 to 1500 AFAs<br />
1800 to 7800<br />
AFAs<br />
8000 to 20000<br />
AFAs<br />
Number 370115 761535 1131650<br />
% in debt amount category 37.3** (1) 25.2** (1) 28.2<br />
Number 84961 822593 907554<br />
% in debt amount category 8.6** (1) 27.2** (1) 22.6<br />
Number 213962 954842 1168804<br />
% in debt amount category 21.6** (1) 31.6** (1) 29.1<br />
20500 AFAs Number 322308 483267 805575<br />
and above % in debt amount category 32.5** (1) 16.0** (1) 20.1<br />
Total Number 991346** (2) 3022237** (2) 4013583<br />
0 to 1500 AFAs<br />
1800 to 7800<br />
AFAs<br />
8000 to 20000<br />
AFAs<br />
Number 7795 17538 25333<br />
% in debt amount category 13.3 15.0 14.4<br />
Number 12991 32478 45469<br />
% in debt amount category 22.2 27.8 25.9<br />
Number 14940 35076 50016<br />
% in debt amount category 25.6 30.0 28.5<br />
20500 AFAs Number 22734 31828 54562<br />
and above % in debt amount category 38.9** (1) 27.2** (1) 31.1<br />
Total Number 58460 116920 175380<br />
Source: NDSA. Note: † Weighted by the population <strong>of</strong> the province. (1) test <strong>of</strong> comparison <strong>of</strong> proportion between urban and rural areas. **<br />
Signifi cant at p
Table 83. Distribution <strong>of</strong> Persons <strong>with</strong> Disability and Non-Disabled above 14<br />
according to the Purpose <strong>of</strong> Loan<br />
Purpose <strong>of</strong> Loan†<br />
Food<br />
School expenditure<br />
Health expenditure<br />
Pr<strong>of</strong>essional equipment<br />
House equipment<br />
Ceremony<br />
Dowry<br />
Land purchase/rent<br />
Property purchase<br />
Good purchase<br />
Other purpose<br />
Non-Disabled<br />
Persons <strong>with</strong><br />
Disability<br />
Total<br />
Number 1597249 82493 1679742<br />
% in purpose <strong>of</strong> loan category 39.8** (1) 47.0** (1) 40.1<br />
Number 181225 1949 183174<br />
% in purpose <strong>of</strong> loan category 4.5 1.1 4.4<br />
Number 829868 81194 911062<br />
% in purpose <strong>of</strong> loan category 20.7** (1) 46.3** (1) 21.7<br />
Number 634353 11692 646045<br />
% in purpose <strong>of</strong> loan category 15.8* (1) 6.7* (1) 15.4<br />
Number 880923 29879 910802<br />
% in purpose <strong>of</strong> loan category 21.9 17.0 21.7<br />
Number 670598 13641 684239<br />
% in purpose <strong>of</strong> loan category 16.7** (1) 7.8** (1) 16.3<br />
Number 35595 1949 37544<br />
% in purpose <strong>of</strong> loan category 0.9 1.1 0.9<br />
Number 137445 6496 143941<br />
% in purpose <strong>of</strong> loan category 3.4 3.7 3.4<br />
Number 82363 3897 86260<br />
% in purpose <strong>of</strong> loan category 2.1 2.2 2.1<br />
Number 88469 5196 93665<br />
% in purpose <strong>of</strong> loan category 2.2 3.0 2.2<br />
Number 199153 9743 208896<br />
% in purpose <strong>of</strong> loan category 5.0 5.6 5.0<br />
Source: NDSA. Note: † Weighted by the population <strong>of</strong> the province. (1) Test <strong>of</strong> comparison <strong>of</strong> proportion between Persons <strong>with</strong> Disabilities<br />
and Non-Disabled. ** Signifi cant at p
Tables Related to Social Income<br />
Table 85. Distribution <strong>of</strong> Persons <strong>with</strong> Disability and Non-Disabled above 14<br />
Having Received Money according to Gender<br />
Disability or Not Gender† Received Not Received Total<br />
Non-Disabled<br />
Persons <strong>with</strong> Disability<br />
Males<br />
Females<br />
Total<br />
Males<br />
Females<br />
Total<br />
Number 1820565 4780184 6600749<br />
% in gender 27.6** (1) 72.4 100.0<br />
Number 2533513 2044530 4578043<br />
% in gender 55.3 44.7 100.0<br />
Number 4354078 6824714 11178792<br />
% in Non-Disabled 38.9** (2) 61.1** (2) 100.0<br />
Number 111723 148098 259821<br />
% in gender 43.0** (1) 57.0 100.0<br />
Number 85091 88339 173430<br />
% in gender 49.1 50.9 100.0<br />
Number 196814 236437 433251<br />
% in Persons <strong>with</strong><br />
Disabilities<br />
45.4** (2) 54.6** (2) 100.0<br />
Source: NDSA. Note: † Weighted by the population <strong>of</strong> the province. (1) Test <strong>of</strong> comparison <strong>of</strong> proportion between Persons <strong>with</strong> Disabilities and<br />
Non-Disabled. ** Signifi cant at p
Table 87. Distribution <strong>of</strong> Persons <strong>with</strong> Disability and Non-Disabled above 14 Having Received Money<br />
according to the 3 Main Donors<br />
Donors†<br />
Husband/wife<br />
Father/mother<br />
Brother/sister<br />
Child or other<br />
family member<br />
Non-<br />
Disabled<br />
First Answer Second Answer Third Answer<br />
Persons<br />
<strong>with</strong><br />
Disability<br />
Total<br />
Non-<br />
Disabled<br />
Persons<br />
<strong>with</strong><br />
Disability<br />
Total<br />
Non-<br />
Disabled<br />
Persons<br />
<strong>with</strong><br />
Disability<br />
Number 1596339 43520 1639859 334000 10393 344393 230981 3248 234229<br />
% in donor category 36.7 21.9 36.0 22.3 14.0 21.9 66.6 18.5 64.3<br />
Number 1126583 42221 1168804 214872 6496 221368 20786 3248 24034<br />
% in donor category 25.9 21.2 25.7 14.3 8.8 14.1 6.0 18.5 6.6<br />
Number 848185 40272 888457 513926 21435 535361 19616 3897 23513<br />
% in donor category 19.5 20.3 19.5 34.3 28.9 34.1 5.7 22.2 6.5<br />
Number 403632 42221 445853 276449 24033 300482 57290 5196 62486<br />
% in donor category 9.3 21.2 9.8 18.5 32.5 19.1 16.5 29.6 17.1<br />
Friends<br />
Number 254495 9743 264238 72230 5846 78076 8444 0 8444<br />
% in donor category 5.8 4.9 5.8 4.8 7.9 5.0 2.4 0.0 2.3<br />
State pension<br />
Number 13641 1949 15590 0 0 0 0 650 650<br />
% in donor category 0.3 1.0 0.3 0 0 0 0.0 3.7 0.2<br />
Local leader<br />
Number 0 3897 3897 7145 1949 9094 0 1299 1299<br />
% in donor category 0.0 2.3 0.1 0.5 2.6 0.6 0.0 7.4 0.4<br />
NGOs, Number 111203 14290 125493 79375 3897 83272 9743 0 9743<br />
employer<br />
or other % in donor category 2.6 7.2 2.8 5.3 5.3 5.3 2.8 0.0 2.7<br />
Total Number 4354078 198763 4552841 1497997 74049 1572046 346860 17538 364398<br />
Source: NDSA. † Weighted by the population <strong>of</strong> the province.<br />
Table 88. Distribution <strong>of</strong> Persons <strong>with</strong> Disability and Non-Disabled above 14 Having Received Money<br />
according to the Donors and Gender<br />
Total<br />
Disability<br />
Gender†<br />
Husband/<br />
Wife<br />
Father<br />
/Mother<br />
Brother/<br />
Sister<br />
Child<br />
Friends<br />
State<br />
Pension<br />
Local or<br />
Religious<br />
Leader<br />
NGO or<br />
Other<br />
Total<br />
Non-Disabled<br />
Persons <strong>with</strong><br />
Disability<br />
Males<br />
Females<br />
Total<br />
Males<br />
Females<br />
Number 76647 909113 648773 355044 260989 13641 43520 638249 2945976<br />
% in gender 2.6 30.9 22.0 12.1 8.9 0.5 1.5 21.7 100.0<br />
Number 2084673 453128 732955 382326 74179 7145 35855 980694 4750955<br />
% in gender 43.9 9.5 15.4 8.0 1.6 0.2 0.8 20.6 100.0<br />
Number 2161320 1362241 1381728 737370 335168 20786 79375 1618943 7696931<br />
% in Non-<br />
Disabled<br />
28.1 17.7 18.0 9.6 4.4 0.3 1.0 21.0 100.0<br />
Number 6496 34426 44170 39623 13640 3898 7795 50665 200713<br />
% in gender 3.2 17.2 22.0 19.7 6.8 1.9 3.9 25.2 100.0<br />
Number 50665 17537 21435 31827 1949 650 1950 37675 163688<br />
% in gender 31.0 10.7 13.1 19.4 1.2 0.4 1.2 23.0 100.0<br />
Number 57161 51963 65605 71450 15589 4548 9745 88340 364401<br />
Total % in Person<br />
<strong>with</strong> Disability<br />
15.7 14.3 18.0 19.6 4.3 1.2 2.7 24.2 100.0<br />
Total Number 2218481 1414204 1447333 808820 350757 25334 89120 1707283 8061332<br />
Source: NDSA. † Weighted by the population <strong>of</strong> the province.<br />
104 Understanding Vulnerability <strong>of</strong> Afghans <strong>with</strong> Disability
Table 89. Distribution <strong>of</strong> Persons <strong>with</strong> Disability and Non-Disabled above 14<br />
Having Received Money according to Amounts<br />
Money Received by Year in Quartiles†<br />
Less than 700 AFAs<br />
710 to 3200 AFAs<br />
3300 to 12000 AFAs<br />
Non-Disabled<br />
Persons <strong>with</strong><br />
Disability<br />
Total<br />
Number 1110214 50665 1160879<br />
% in amount category 25.7 27.1 25.8<br />
Number 1048377 48716 1097093<br />
% in amount category 24.3 26.0 24.4<br />
Number 1147629 46118 1193747<br />
% in amount category 26.6 24.7 26.5<br />
Number 1007715 41571 1049286<br />
12030 AFAs and above<br />
% in amount category 23.4 22.2 23.3<br />
Total Number 4313935 187070 4501005<br />
Source: NDSA. Note: † Weighted by the population <strong>of</strong> the province. (1) Test <strong>of</strong> comparison <strong>of</strong> proportion between Persons <strong>with</strong> Disabilities<br />
and Non-Disabled. ** Signifi cant at p
The National Disability Survey in Afghanistan was carried out in 2005. It is the fi rst study that covered the entire<br />
territory. Based on the International Classifi cation <strong>of</strong> Functioning, Disability and Health <strong>of</strong> the World Health<br />
Organization, and the Capabilities Approach <strong>of</strong> Amartya Sen, the NDSA aims to provide insight into the living<br />
conditions, needs and hopes <strong>of</strong> Afghans <strong>with</strong> <strong>disability</strong> and their families.<br />
The present volume <strong>of</strong> the NDSA results looks more closely at employment, income and livelihoods <strong>of</strong> persons <strong>with</strong><br />
<strong>disability</strong>. A common belief is that persons <strong>with</strong> <strong>disability</strong>, suffering from discrimination and exclusion, are unable<br />
to access existing resources and are more at risk <strong>of</strong> poverty than non-disabled people. Comparing the situation<br />
<strong>of</strong> families living <strong>with</strong> persons <strong>with</strong> <strong>disability</strong> to those composed only <strong>of</strong> persons considered as non-disabled; the<br />
present report examines <strong>vulnerability</strong> <strong>of</strong> Afghans to shocks, and tries to identify signs and indicators <strong>of</strong> poverty.<br />
A major result is that access to basic commodities, adequate housing conditions, labour market or even social<br />
participation is not inevitably worse for households <strong>with</strong> a person <strong>with</strong> <strong>disability</strong>. The situation concerning livelihood<br />
dimensions is particularly diffi cult for families headed by a woman.<br />
European Union<br />
United Nations