download-report
download-report
download-report

You also want an ePaper? Increase the reach of your titles
YUMPU automatically turns print PDFs into web optimized ePapers that Google loves.
Section 02 | The Global Top 100<br />
Overview<br />
Overview<br />
Value of BrandZ Top 100<br />
up 98 percent since 2006<br />
All components of brand equity strengthen,<br />
technology leads in total brands and value<br />
Technology brands have led the growth in brand value<br />
since the introduction of the BrandZ Top 100 Most<br />
Valuable Global Brands in 2006. The technology brands<br />
ranked in the BrandZ Global Top 100 totaled $826.9 billion<br />
in value in 2014, an increase of 141 percent since 2006.<br />
The 12 percent brand value increase in<br />
the BrandZ Top 100 Most Valuable<br />
Global Brands 2014 represents a<br />
resurgence of growth following the<br />
financial downturn in 2008, and a 98<br />
percent increase in value since the<br />
ranking was introduced in 2006.<br />
The technology category, which rose 16<br />
percent in the 2014 BrandZ Global 100,<br />
represents nearly a third of the total<br />
brand value and almost a fifth of the<br />
brands. The technology category has<br />
grown 141 percent in brand value since<br />
the ranking began.<br />
Of the Top 10 brands that grew most in<br />
brand value since 2006, five are in the<br />
technology category. During those eight<br />
years, Apple increased in value by $131.9<br />
billion or 826 percent, followed by<br />
Google with a 324 percent or $121.4<br />
billion rise in brand value.<br />
The Top 100 are resilient. Since the<br />
financial crisis, the BrandZ Global Top<br />
100 brands have strengthened in each<br />
component of brand equity, which is<br />
the consumer’s predisposition to select<br />
a brand.<br />
The components are: meaningful<br />
(generating appeal or “love”), different<br />
(setting trends that benefit the<br />
consumer) and salient (coming to mind<br />
spontaneously). The BrandZ Top 100<br />
Most Valuable Global Brands<br />
significantly outscore other brands<br />
in each component.<br />
Difference and salience<br />
drive and sustain value<br />
In the telecom provider category, where<br />
brands are struggling to differentiate and<br />
be viewed as more than a conduit of<br />
data, UK-based BT rose 61 percent in<br />
brand value and moved up 30 positions<br />
in the ranking.<br />
The brand value rise was driven in part<br />
by acquiring rights to English Premier<br />
Football, adding over two million<br />
new subscribers, a successful<br />
Olympic sponsorship and increasing<br />
revenue. The added value helped justify<br />
premium pricing.<br />
Being different was a key driver for<br />
Amazon, which continued to grow its<br />
consumer share of life, expanding into<br />
food and other businesses, while also<br />
disrupting business-to-business<br />
technology pricing with its Cloud<br />
computing services.<br />
With a 41 percent brand value increase<br />
to $64.3 billion, Amazon entered the<br />
BrandZ Global Top 10 for the first time.<br />
Brand salience helped sustain Coca-Cola.<br />
Because of consumer health concerns<br />
the sale of CSDs (Carbonated Soft<br />
Drinks) declined for the ninth consecutive<br />
year in the US. The Coca-Cola brand rose<br />
3 percent, however.<br />
Coca-Cola slipped one spot in the<br />
BrandZ Global Top 10, as did<br />
McDonald’s, another salient brand in a<br />
category impacted by consumer health<br />
concerns. At the same time, Microsoft,<br />
a salient technology brand, gained three<br />
places in the ranking on a 29 percent<br />
increase in brand value.<br />
Brands gain in trust and<br />
value metrics<br />
Two other BrandZ metrics, TrustR and<br />
ValueD, also help explain brand value<br />
increases. TrustR measures how much<br />
consumers trust a brand (because it<br />
consistently has met its promises in the<br />
past) and the likelihood consumers would<br />
recommend a brand (because it<br />
consistently keeps its promises today).<br />
The three logistics companies ranked in<br />
the BrandZ Global Top 100 score high in<br />
TrustR. Each increased significantly in<br />
brand value, led by DHL with a rise of 53<br />
percent, followed by Fedex, 24 percent,<br />
and UPS, 12 percent.<br />
ValueD measures the gap between a<br />
consumer’s desire for a brand and the<br />
consumer’s perception of the price.<br />
The measurement is important because,<br />
coming out of the recession, consumers<br />
are significantly more concerned about<br />
obtaining good value for money.<br />
Responding to this change in consumers<br />
attitude, the BrandZ Global Top 100<br />
have improved their desire and price<br />
scores. A high desire score gives a<br />
brand flexibility to be premium priced<br />
or good value.<br />
How brands manage the desire/price<br />
balance depends on the product<br />
category and brand proposition. Some<br />
brands with high desirability, like<br />
Pampers, are able to command a<br />
premium. Consumers view IKEA as<br />
good value for money. IKEA improved<br />
61 percent in brand value.<br />
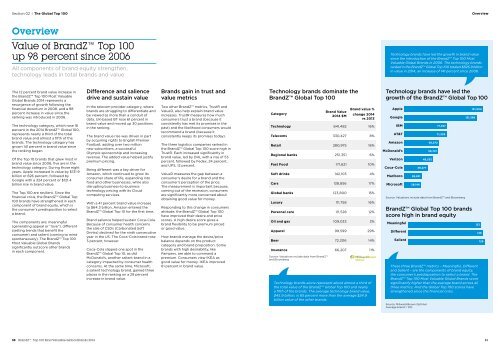
Technology brands dominate the<br />
BrandZ Global Top 100<br />
Category<br />
Brand Value<br />
2014 $M<br />
Brand value %<br />
change 2014<br />
vs 2013<br />
Technology 841,482 16%<br />
Telecoms 330,427 8%<br />
Retail 280,975 16%<br />
Regional banks 251,351 6%<br />
Fast Food 171,621 10%<br />
Soft drinks 142,103 4%<br />
Cars 138,856 17%<br />
Global banks 123,800 15%<br />
Luxury 111,758 16%<br />
Personal care 111,528 12%<br />
Oil and gas 109,033 3%<br />
Apparel 99,599 29%<br />
Beer 72,306 14%<br />
Insurance 66,207 11%<br />
Source: Valuations include data from BrandZ<br />
and Bloomberg<br />
Technology brands alone represent about almost a third of<br />
the total value of the BrandZ Global Top 100 and nearly<br />
a fifth of the brands. The average technology brand value,<br />
$45.9 billion, is 85 percent more than the average $24.9<br />
billion value of the other brands.<br />
Technology brands have led the<br />
growth of the BrandZ Global Top 100<br />
Apple<br />
Google<br />
IBM<br />
AT&T<br />
Amazon<br />
McDonald’s<br />
Verizon<br />
Coca-Cola<br />
Marlboro<br />
Microsoft<br />
Meaningful<br />
Different<br />
Salient<br />
28,831<br />
28,146<br />
39,277<br />
48,552<br />
58,272<br />
56,721<br />
71,457<br />
71,203<br />
Source: Valuations include data from BrandZ and Bloomberg<br />
121,398<br />
BrandZ Global Top 100 brands<br />
score high in brand equity<br />
131,904<br />
These three BrandZ metrics – Meaningful, Different<br />
and Salient – are the components of brand equity,<br />
the consumer’s predisposition to select a brand. The<br />
BrandZ Top 100 Most Valuable Global Brands score<br />
significantly higher than the average brand across all<br />
three metrics. And the Global Top 100 scores have<br />
strengthened since the financial crisis.<br />
Source: Millward Brown Optimor<br />
Average brand = 100<br />
123<br />
126<br />
129<br />
30 BrandZ Top 100 Most Valuable Global Brands 2014 31