Keizer Station FCn.pub - HSM Pacific
Keizer Station FCn.pub - HSM Pacific
Keizer Station FCn.pub - HSM Pacific

You also want an ePaper? Increase the reach of your titles
YUMPU automatically turns print PDFs into web optimized ePapers that Google loves.
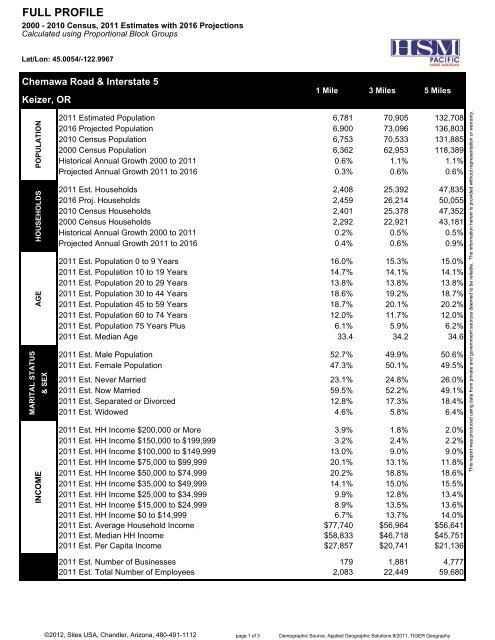
FULL PROFILE<br />
2000 - 2010 Census, 2011 Estimates with 2016 Projections<br />
Calculated using Proportional Block Groups<br />
Lat/Lon: 45.0054/-122.9967<br />
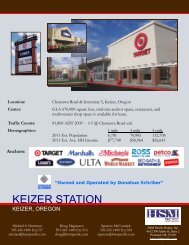
Chemawa Road & Interstate 5<br />
<strong>Keizer</strong>, OR<br />
1 Mile 3 Miles 5 Miles<br />
AGE<br />
HOUSEHOLDS POPULATION<br />
MARITAL STATUS<br />
INCOME<br />
& SEX<br />
2011 Estimated Population 6,781 70,905 132,708<br />
2016 Projected Population 6,900 73,096 136,803<br />
2010 Census Population 6,753 70,533 131,885<br />
2000 Census Population 6,362 62,953 118,389<br />
Historical Annual Growth 2000 to 2011 0.6% 1.1% 1.1%<br />
Projected Annual Growth 2011 to 2016 0.3% 0.6% 0.6%<br />
2011 Est. Households 2,408 25,392 47,835<br />
2016 Proj. Households 2,459 26,214 50,055<br />
2010 Census Households 2,401 25,378 47,352<br />
2000 Census Households 2,292 22,921 43,181<br />
Historical Annual Growth 2000 to 2011 0.2% 0.5% 0.5%<br />
Projected Annual Growth 2011 to 2016 0.4% 0.6% 0.9%<br />
2011 Est. Population 0 to 9 Years 16.0% 15.3% 15.0%<br />
2011 Est. Population 10 to 19 Years 14.7% 14.1% 14.1%<br />
2011 Est. Population 20 to 29 Years 13.8% 13.8% 13.8%<br />
2011 Est. Population 30 to 44 Years 18.6% 19.2% 18.7%<br />
2011 Est. Population 45 to 59 Years 18.7% 20.1% 20.2%<br />
2011 Est. Population 60 to 74 Years 12.0% 11.7% 12.0%<br />
2011 Est. Population 75 Years Plus 6.1% 5.9% 6.2%<br />
2011 Est. Median Age 33.4 34.2 34.6<br />
2011 Est. Male Population 52.7% 49.9% 50.6%<br />
2011 Est. Female Population 47.3% 50.1% 49.5%<br />
2011 Est. Never Married 23.1% 24.8% 26.0%<br />
2011 Est. Now Married 59.5% 52.2% 49.1%<br />
2011 Est. Separated or Divorced 12.8% 17.3% 18.4%<br />
2011 Est. Widowed 4.6% 5.8% 6.4%<br />
2011 Est. HH Income $200,000 or More 3.9% 1.8% 2.0%<br />
2011 Est. HH Income $150,000 to $199,999 3.2% 2.4% 2.2%<br />
2011 Est. HH Income $100,000 to $149,999 13.0% 9.0% 9.0%<br />
2011 Est. HH Income $75,000 to $99,999 20.1% 13.1% 11.8%<br />
2011 Est. HH Income $50,000 to $74,999 20.2% 18.8% 18.6%<br />
2011 Est. HH Income $35,000 to $49,999 14.1% 15.0% 15.5%<br />
2011 Est. HH Income $25,000 to $34,999 9.9% 12.8% 13.4%<br />
2011 Est. HH Income $15,000 to $24,999 8.9% 13.5% 13.6%<br />
2011 Est. HH Income $0 to $14,999 6.7% 13.7% 14.0%<br />
2011 Est. Average Household Income $77,740 $56,964 $56,641<br />
2011 Est. Median HH Income $58,833 $46,718 $45,751<br />
2011 Est. Per Capita Income $27,857 $20,741 $21,136<br />
This report was produced using data from private and government sources deemed to be reliable. The information herein is provided without representation or warranty.<br />
2011 Est. Number of Businesses 179 1,881 4,777<br />
2011 Est. Total Number of Employees 2,083 22,449 59,680<br />
©2012, Sites USA, Chandler, Arizona, 480-491-1112 page 1 of 3 Demographic Source: Applied Geographic Solutions 8/2011, TIGER Geography