Keizer Station FCn.pub - HSM Pacific
Keizer Station FCn.pub - HSM Pacific
Keizer Station FCn.pub - HSM Pacific

Create successful ePaper yourself
Turn your PDF publications into a flip-book with our unique Google optimized e-Paper software.
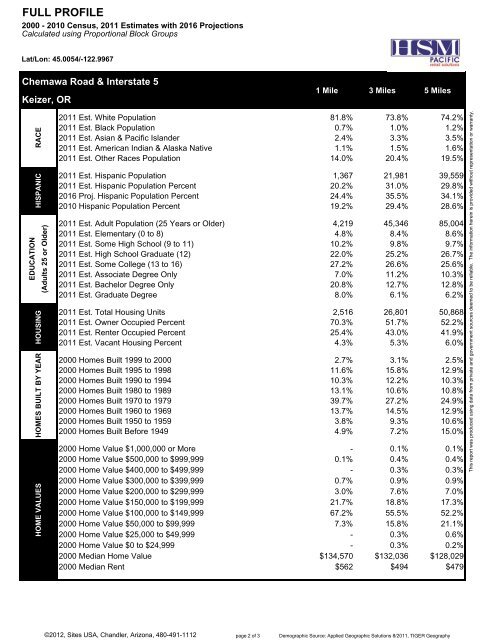
FULL PROFILE<br />
2000 - 2010 Census, 2011 Estimates with 2016 Projections<br />
Calculated using Proportional Block Groups<br />
Lat/Lon: 45.0054/-122.9967<br />
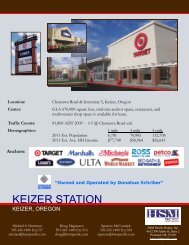
Chemawa Road & Interstate 5<br />
<strong>Keizer</strong>, OR<br />
1 Mile 3 Miles 5 Miles<br />
HISPANIC RACE<br />
EDUCATION<br />
(Adults 25 or Older)<br />
HOME VALUES<br />
HOMES BUILT BY YEAR HOUSING<br />
2011 Est. White Population 81.8% 73.8% 74.2%<br />
2011 Est. Black Population 0.7% 1.0% 1.2%<br />
2011 Est. Asian & <strong>Pacific</strong> Islander 2.4% 3.3% 3.5%<br />
2011 Est. American Indian & Alaska Native 1.1% 1.5% 1.6%<br />
2011 Est. Other Races Population 14.0% 20.4% 19.5%<br />
2011 Est. Hispanic Population 1,367 21,981 39,559<br />
2011 Est. Hispanic Population Percent 20.2% 31.0% 29.8%<br />
2016 Proj. Hispanic Population Percent 24.4% 35.5% 34.1%<br />
2010 Hispanic Population Percent 19.2% 29.4% 28.6%<br />
2011 Est. Adult Population (25 Years or Older) 4,219 45,346 85,004<br />
2011 Est. Elementary (0 to 8) 4.8% 8.4% 8.6%<br />
2011 Est. Some High School (9 to 11) 10.2% 9.8% 9.7%<br />
2011 Est. High School Graduate (12) 22.0% 25.2% 26.7%<br />
2011 Est. Some College (13 to 16) 27.2% 26.6% 25.6%<br />
2011 Est. Associate Degree Only 7.0% 11.2% 10.3%<br />
2011 Est. Bachelor Degree Only 20.8% 12.7% 12.8%<br />
2011 Est. Graduate Degree 8.0% 6.1% 6.2%<br />
2011 Est. Total Housing Units 2,516 26,801 50,868<br />
2011 Est. Owner Occupied Percent 70.3% 51.7% 52.2%<br />
2011 Est. Renter Occupied Percent 25.4% 43.0% 41.9%<br />
2011 Est. Vacant Housing Percent 4.3% 5.3% 6.0%<br />
2000 Homes Built 1999 to 2000 2.7% 3.1% 2.5%<br />
2000 Homes Built 1995 to 1998 11.6% 15.8% 12.9%<br />
2000 Homes Built 1990 to 1994 10.3% 12.2% 10.3%<br />
2000 Homes Built 1980 to 1989 13.1% 10.6% 10.8%<br />
2000 Homes Built 1970 to 1979 39.7% 27.2% 24.9%<br />
2000 Homes Built 1960 to 1969 13.7% 14.5% 12.9%<br />
2000 Homes Built 1950 to 1959 3.8% 9.3% 10.6%<br />
2000 Homes Built Before 1949 4.9% 7.2% 15.0%<br />
2000 Home Value $1,000,000 or More - 0.1% 0.1%<br />
2000 Home Value $500,000 to $999,999 0.1% 0.4% 0.4%<br />
2000 Home Value $400,000 to $499,999 - 0.3% 0.3%<br />
2000 Home Value $300,000 to $399,999 0.7% 0.9% 0.9%<br />
2000 Home Value $200,000 to $299,999 3.0% 7.6% 7.0%<br />
2000 Home Value $150,000 to $199,999 21.7% 18.8% 17.3%<br />
2000 Home Value $100,000 to $149,999 67.2% 55.5% 52.2%<br />
2000 Home Value $50,000 to $99,999 7.3% 15.8% 21.1%<br />
2000 Home Value $25,000 to $49,999 - 0.3% 0.6%<br />
2000 Home Value $0 to $24,999 - 0.3% 0.2%<br />
2000 Median Home Value $134,570 $132,036 $128,029<br />
2000 Median Rent $562 $494 $479<br />
This report was produced using data from private and government sources deemed to be reliable. The information herein is provided without representation or warranty.<br />
©2012, Sites USA, Chandler, Arizona, 480-491-1112 page 2 of 3 Demographic Source: Applied Geographic Solutions 8/2011, TIGER Geography