Abaqus Technology Brief Automotive Brake Squeal Analysis Using ...
Abaqus Technology Brief Automotive Brake Squeal Analysis Using ...
Abaqus Technology Brief Automotive Brake Squeal Analysis Using ...

You also want an ePaper? Increase the reach of your titles
YUMPU automatically turns print PDFs into web optimized ePapers that Google loves.
4<br />
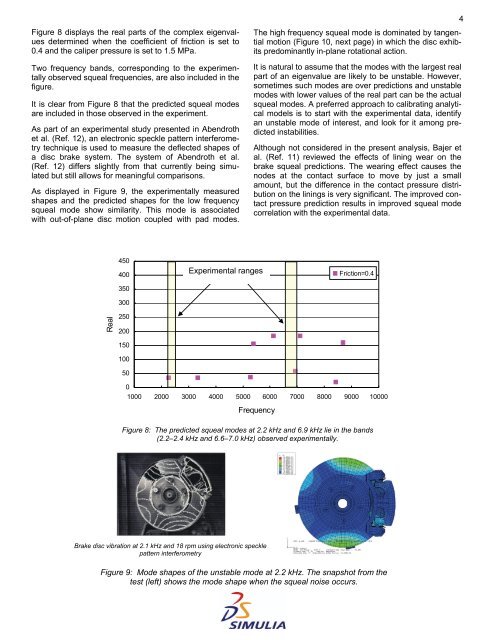
Figure 8 displays the real parts of the complex eigenvalues<br />
determined when the coefficient of friction is set to<br />
0.4 and the caliper pressure is set to 1.5 MPa.<br />
Two frequency bands, corresponding to the experimentally<br />
observed squeal frequencies, are also included in the<br />
figure.<br />
It is clear from Figure 8 that the predicted squeal modes<br />
are included in those observed in the experiment.<br />
As part of an experimental study presented in Abendroth<br />
et al. (Ref. 12), an electronic speckle pattern interferometry<br />
technique is used to measure the deflected shapes of<br />
a disc brake system. The system of Abendroth et al.<br />
(Ref. 12) differs slightly from that currently being simulated<br />
but still allows for meaningful comparisons.<br />
As displayed in Figure 9, the experimentally measured<br />
shapes and the predicted shapes for the low frequency<br />
squeal mode show similarity. This mode is associated<br />
with out-of-plane disc motion coupled with pad modes.<br />
The high frequency squeal mode is dominated by tangential<br />
motion (Figure 10, next page) in which the disc exhibits<br />
predominantly in-plane rotational action.<br />
It is natural to assume that the modes with the largest real<br />
part of an eigenvalue are likely to be unstable. However,<br />
sometimes such modes are over predictions and unstable<br />
modes with lower values of the real part can be the actual<br />
squeal modes. A preferred approach to calibrating analytical<br />
models is to start with the experimental data, identify<br />
an unstable mode of interest, and look for it among predicted<br />
instabilities.<br />
Although not considered in the present analysis, Bajer et<br />
al. (Ref. 11) reviewed the effects of lining wear on the<br />
brake squeal predictions. The wearing effect causes the<br />
nodes at the contact surface to move by just a small<br />
amount, but the difference in the contact pressure distribution<br />
on the linings is very significant. The improved contact<br />
pressure prediction results in improved squeal mode<br />
correlation with the experimental data.<br />
450<br />
400<br />
350<br />
300<br />
Experimental ranges<br />
Friction=0.4<br />
Real<br />
250<br />
200<br />
150<br />
100<br />
50<br />
0<br />
1000 2000 3000 4000 5000 6000 7000 8000 9000 10000<br />
Frequency<br />
Figure 8: The predicted squeal modes at 2.2 kHz and 6.9 kHz lie in the bands<br />
(2.2–2.4 kHz and 6.6–7.0 kHz) observed experimentally.<br />
<strong>Brake</strong> disc vibration at 2.1 kHz and 18 rpm using electronic speckle<br />
pattern interferometry<br />
Figure 9: Mode shapes of the unstable mode at 2.2 kHz. The snapshot from the<br />
test (left) shows the mode shape when the squeal noise occurs.