Long Term Community Plan 2012-2022 - Hurunui District Council
Long Term Community Plan 2012-2022 - Hurunui District Council
Long Term Community Plan 2012-2022 - Hurunui District Council

Create successful ePaper yourself
Turn your PDF publications into a flip-book with our unique Google optimized e-Paper software.
ft <strong>Long</strong> <strong>Term</strong> <strong>Plan</strong> <strong>2012</strong>-<strong>2022</strong><br />
<strong>Hurunui</strong> <strong>Community</strong> <strong>Long</strong> <strong>Term</strong> <strong>Plan</strong> - <strong>2012</strong>-<strong>2022</strong>
www.hurunui.govt.nz<br />
66 Carters Road<br />
PO Box 13<br />
Amberley 7441<br />
Phone: 03 314 8816<br />
Fax: 03 314 9181<br />
email: info@hurunui.govt.nz<br />
web: hurunui.govt.nz<br />
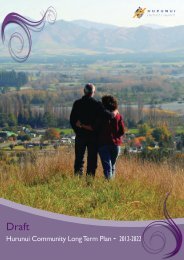
Front Cover - Overlooking the Waiau Township from the Leader Road.<br />
2
<strong>Hurunui</strong> <strong>Community</strong> <strong>Long</strong> <strong>Term</strong> <strong>Plan</strong> <strong>2012</strong> - <strong>2022</strong><br />
Contents<br />
Introduction<br />
5 Welcome from the Mayor and CEO<br />
9 About the <strong>Plan</strong><br />
11 How Your Rates are Spent<br />
12 Key Issues<br />
20 Financial Strategy<br />
32 Statement Concerning Balancing<br />
of the Budget<br />
34 <strong>Community</strong> Outcomes<br />
36 Aligning Our <strong>Long</strong> <strong>Term</strong> <strong>Plan</strong> with the<br />
Government’s Drivers for Economic<br />
Growth<br />
40 Water Management<br />
43 Sustainability<br />
Township Profiles<br />
46 <strong>Hurunui</strong> <strong>District</strong> Profile<br />
52 Amberley Ward Profile<br />
55 Amuri-<strong>Hurunui</strong> Ward Profile<br />
60 Cheviot Ward Profile<br />
62 Glenmark Ward Profile<br />
65 Hanmer Springs Ward Profile<br />
<strong>Council</strong> Activities<br />
69 Introduction<br />
71 Water Supply<br />
79 Sewerage<br />
84 Stormwater and Drainage<br />
88 Roads and Footpaths<br />
94 <strong>Community</strong> Services and Facilities<br />
96 <strong>Community</strong> Services<br />
102 Property<br />
108 Reserves<br />
112 Environment and Safety<br />
115 Emergency Services<br />
119 Resource Management<br />
122 Compliance and Regulatory<br />
Functions<br />
126 Waste Minimisation<br />
130 <strong>District</strong> Promotion<br />
135 Hanmer Springs Thermal Pools and Spa<br />
141 Governance<br />
Financial Information<br />
146 Financial Introduction<br />
148 Forecasting Assumptions<br />
153 Statement of Accounting Policies<br />
171 Funding Impact Statement (and Rates<br />
System)<br />
182 Rates System<br />
193 Reserve Funds<br />
198 <strong>Council</strong> Controlled Organisations<br />
<strong>Council</strong> Policies<br />
200 Policy Introduction<br />
201 Development Contributions Policy<br />
217 External Liability Management Policy<br />
219 Investment Policy<br />
221 Rates Remission for Biodiversity<br />
Policy<br />
222 Rates Remissions on Land Affected by<br />
Natural Calamity Policy<br />
223 Reserves Funding Policy<br />
224 Revenue and Funding Policy<br />
251 Significance Policy<br />
258 Treasury Risk Management Policy<br />
262 Internal Financing Policy<br />
Appendices<br />
265 Representatives of our <strong>District</strong><br />
266 Waste Management and<br />
Minimisation <strong>Plan</strong> Summary<br />
268 <strong>Hurunui</strong> Waiau Zone Implimentation<br />
Programme<br />
270 Water and Sanitary Services<br />
Assessment Summary<br />
272 Levels of Service Water and Sewer<br />
275 Rates: Sample Properties<br />
281 Independent Auditor’s Report<br />
3
www.hurunui.govt.nz<br />
Introduction<br />
5 Welcome from the Mayor and CEO<br />
9 About the <strong>Plan</strong><br />
11 How Your Rates are Spent<br />
12 Key Issues<br />
20 Financial Strategy<br />
32 Statement Concerning Balancing<br />
of the Budget<br />
34 <strong>Community</strong> Outcomes<br />
36 Aligning Our <strong>Long</strong> <strong>Term</strong> <strong>Plan</strong> with the<br />
Government’s Drivers for Economic<br />
Growth<br />
40 Water Management<br />
43 Sustainability<br />
4
<strong>Hurunui</strong> <strong>Community</strong> <strong>Long</strong> <strong>Term</strong> <strong>Plan</strong> <strong>2012</strong> - <strong>2022</strong><br />
Winton Dalley<br />
Mayor<br />
Welcome from the Mayor and CEO<br />
Andrew Dalziel<br />
Chief Executive Officer<br />
Hello everyone and welcome to <strong>Council</strong>’s <strong>Long</strong> <strong>Term</strong> <strong>Plan</strong> <strong>2012</strong><br />
- <strong>2022</strong>. In our introduction, we summarise some important<br />
themes and points to help you gain an overall understanding of<br />
what is in this ten year plan and what it may mean for you and<br />
for our district.<br />
We review our 10 year plan every three years and in the two<br />
in-between years, we prepare Annual <strong>Plan</strong>s based on the 10<br />
year plan. We do our best to plan appropriately for the coming<br />
years, but things will and do happen that are beyond our control,<br />
hence the need for regular reviews. For example, no amount<br />
of planning would have prepared us totally for the devastating<br />
earthquakes that hit the Canterbury Region. Although the<br />
<strong>Hurunui</strong> <strong>District</strong> suffered comparably less direct damage than<br />
Christchurch City, Waimakariri and Selwyn <strong>District</strong>s, the impact<br />
on us has still been huge and had a major influence on this<br />
plan. When we last reviewed our plan three years ago, we were<br />
optimistic about the economy picking up more quickly than it<br />
has done. We were optimistic that our district would grow<br />
at a much faster pace than has actually been the case. Our<br />
recent updated population estimate of 11,330 residents shows<br />
low growth. With the census being postponed because of the<br />
earthquakes, we will not be able to confirm our population<br />
and district statistics until the results of the 2013 census are<br />
released in 2014.<br />
One of the most challenging aspects of planning is finding the<br />
right balance between delivering expected levels of service at an<br />
affordable cost. We invited you, our residents and ratepayers, to<br />
submit on our proposals in March and April <strong>2012</strong>. About 130<br />
of you did just this and as a result of your input, we were able<br />
to confirm many of our proposals and include other matters<br />
we had not considered previously. We constantly challenge<br />
ourselves over what is reasonable, what is sustainable into the<br />
5
www.hurunui.govt.nz<br />
future, who should pay, and how to meet the expectations of<br />
our communities. The Government has expressed concern<br />
over high rating increases and expects councils to be restrained.<br />
Whereas we agree, unfortunately dramatic increases in our<br />
insurance costs, the new legislative requirement to meet New<br />
Zealand drinking water standards, and funding sewer and<br />
stormwater improvements, mean that we too have higher rating<br />
increases than we would have preferred.<br />
As a result of the <strong>Council</strong>’s decisions after considering public<br />
submissions, the increase in the <strong>2012</strong>/2013 year has reduced<br />
from 6.94% (what we said in the draft <strong>Long</strong> <strong>Term</strong> <strong>Plan</strong>), down to<br />
5.83%. The downside is the flow on effect to the 2013/2014 and<br />
2014/2015 years’ rates which will increase from 4.80% to 5.77%<br />
for 2013/2014 and from 4.62% to 5.37% in the 2014/2015 year.<br />
The primary causes for the increases in our rate projections<br />
can be attributed to the following items, all of which are further<br />
explained in the ‘key issues’ section of this plan.<br />
• Insurance has significantly risen as a direct result of the<br />
Canterbury earthquakes and other natural disasters,<br />
such as the Queensland floods. We have traditionally had<br />
comprehensive insurance cover, and we have budgeted to<br />
continue to do so.<br />
• We face huge capital outlay to become compliant with the<br />
legislated New Zealand Drinking Water Standards. The<br />
good news is that we will no longer have any of our water<br />
schemes on permanent boil water notices; but it comes at a<br />
price. We will be treating the water of our at-risk drinking<br />
water intakes in the <strong>2012</strong>/13 year. This will enable us to be<br />
compliant in the short term but this is only an interim step.<br />
In the long term we will need to upgrade our schemes by<br />
2027. To make this affordable, we will commence rating<br />
for the estimated $14 million (in today’s dollars), in the<br />
2015/2016 year.<br />
• In recent years, we have incurred significant costs in<br />
upgrading some of our water supplies, sewer schemes and<br />
stormwater systems. The work undertaken has resulted<br />
in increased debt for those activities and we are at a stage<br />
where the interest and debt repayments need to be made<br />
and these have to be funded through rates.<br />
There are a number of other aspects that influenced the<br />
development of this <strong>Plan</strong>. We were guided by our proposed new<br />
vision of <strong>Community</strong> partnership in growth and wellbeing,<br />
as well as our core principles:<br />
• Focus on core services<br />
• Financial responsibility and affordability<br />
• Continuous improvement in service to everyone in our<br />
district<br />
• Facilitate appropriate growth in the district<br />
We have confirmed this new vision through the long term<br />
plan consultation process. It builds upon our previous vision<br />
which was based on a ‘wellness’ concept (<strong>Hurunui</strong> Wellness:<br />
“In <strong>Hurunui</strong>, we live the lives the rest of the world would<br />
love to live”). We wanted to further define it and convey that<br />
everything we do, we do in partnership with our communities.<br />
With your support for our plan and the services, infrastructure<br />
and facilities we provide and you pay for, we have confidence<br />
that we will be meeting the aspirations or expectations of our<br />
communities, which contribute to wellness and wellbeing.<br />
Important contributors to this <strong>Plan</strong> have been the many people<br />
in our district who are members of our boards and committees.<br />
In particular, we have taken into account the views of the Ward<br />
Committees and the Hanmer Springs <strong>Community</strong> Board on the<br />
submissions received affecting each of their respective wards.<br />
These groups, having been chosen by their local communities,<br />
provide valuable insight into what is considered important<br />
locally.<br />
All submissions were considered in the context of affordability,<br />
priorities for the district and Government’s new bill, ‘Better<br />
Local Government’. This bill, expected to be passed around<br />
September <strong>2012</strong>, aims to provide better clarity about council’s<br />
roles, stronger governance, improved efficiency and more<br />
responsible fiscal management. The Government is concerned<br />
about increased public spending and debt levels and is requiring<br />
both central and local government to improve the efficiency<br />
of delivering public services and take a prudent approach to<br />
public debt. The new bill proposes that councils will have a new<br />
purpose -“providing good quality local infrastructure, public<br />
services and regulatory functions at the least possible cost to<br />
households and business”. This will replace the current purpose<br />
which references a responsibility to the social, economic,<br />
environmental and cultural well-being of communities. In<br />
addition, the Government is proposing to introduce legislation<br />
around fiscal responsibility to limit council expenditure growth<br />
to no faster than inflation and population growth. A strong<br />
<strong>Hurunui</strong> 10-Year Timeline<br />
<strong>2012</strong>/13<br />
Representation Review<br />
Nine New Miox Water Treatment Installations<br />
Targeted Tourism Rate and<br />
<strong>District</strong> Promotion Review<br />
Earthquake Prone Building Assessments<br />
Cheviot Library Relocation<br />
Local Government Elections<br />
Earthquake Prone Building Assessments<br />
Review of the <strong>District</strong> <strong>Plan</strong> completed<br />
2013/14<br />
2014/15<br />
Central Government Elections<br />
Earthquake Prone Building Assessments<br />
Hanmer Springs <strong>Community</strong> Hall Extension<br />
<strong>Long</strong> <strong>Term</strong> <strong>Plan</strong> Review<br />
Drinking Water upgrade<br />
Hanmer Springs Sewerage Treatment<br />
<strong>Plan</strong>t Upgrade<br />
Hanmer Springs Sports Stadium<br />
2015/16<br />
2016/17<br />
Local Government Elections<br />
Cheviot Medical Centre Upgrade or<br />
Rebuild<br />
6
<strong>Hurunui</strong> <strong>Community</strong> <strong>Long</strong> <strong>Term</strong> <strong>Plan</strong> <strong>2012</strong> - <strong>2022</strong><br />
message coming through is for council’s to stick to core business.<br />
All this has an impact on what we decided to provide for now<br />
and into the future.<br />
Thanks to your support, we have confirmed a number of the<br />
proposals that we put to you. For example, we will proceed<br />
with our intent to review our method of rating for tourism<br />
and general district promotion in <strong>2012</strong>/13. This is one example<br />
of where your views and suggestions have confirmed that it is<br />
timely to review our rating model. You also told us that you<br />
agree with our plan to assess earthquake prone commercial<br />
and public buildings in the district sooner rather than later in<br />
the interests of public safety, despite not being required to do<br />
this. Likewise, through your submissions, we have been able to<br />
confirm our direction to provide funds for legal advice relating<br />
to resource consents, district plan changes and policy matters;<br />
and to do our best to maintain our roading levels of service<br />
despite there being less funding available.<br />
Many of you submitted on local issues affecting your areas.<br />
Through hearing from you, we have been able to confirm our<br />
intent to: provide for a new or upgraded medical centre in<br />
Cheviot in 2016/17; move the Cheviot community library from<br />
the school into the Cheviot service centre in <strong>2012</strong>/13; continue<br />
to work with you to finalise any proposal for a swimming pool<br />
in Amberley; enhance a number of facilities in Hanmer Springs<br />
(eg: the sports ground and community hall); and continue our<br />
work to secure access to the Hanmer Heritage Forest. We<br />
also confirmed our proposal to fund the Hanmer Springs<br />
<strong>Community</strong> Board through Hanmer Springs ratepayers (rather<br />
than district wide rates). Few people mentioned the proposal<br />
to build a public toilet in Rotherham in 2017/18 funded through<br />
the district rate, but we agreed to retain the budget for this in<br />
the meantime but will retest the need for this again in 2015<br />
before going ahead. More information about all of these items is<br />
in the ‘Key Issues’ section of this plan.<br />
We received a large number of submissions about access to<br />
the <strong>Hurunui</strong> lakes (Lake Sumner, Lake Taylor and Loch Katrine).<br />
Although this was not something we highlighted in our draft<br />
<strong>Plan</strong>, it was clearly of importance to many of you. Through the<br />
submission process, we were able to confirm our intention to<br />
continue working with other groups as well as the Department<br />
of Conservation to help resolve the common issues affecting<br />
access. Potentially this is a complex situation requiring not only<br />
significant funding, but resolving issues over public and private<br />
land ownership.<br />
We have included into this plan, a number of other items that<br />
came to our attention through submissions, such as: a $5,000<br />
contribution toward the roof repair of the Balcairn Public Hall<br />
(via Amberley amenity rates); to continue contributing $5,000<br />
per annum via a district wide rate toward the Sport NZ Rural<br />
Travel Fund; approved expenditure of $45,000 toward the septic<br />
tank replacement at the Gore Bay Camp; to spend $80,000<br />
over two years to upgrade or replace the Cheviot Hills Reserve<br />
public toilets; to extend our Smokefree Policy to include more<br />
outdoor areas gradually and within existing budgets; to spend<br />
$5,000 to promote responsible dog owner behaviour later this<br />
year; to adjust our wording in our Waste Minimisation <strong>Plan</strong> to<br />
show our desire to work toward zero waste to landfill.<br />
In light of the restrictions we face, we also had to say ‘no’ to a<br />
lot of people who requested money or initiatives that required<br />
money. Whereas these submissions had merit, they were<br />
either out of our scope or unaffordable, particularly given the<br />
Government’s bill, or we did not consider them to be essential<br />
at this time. Some of the requests we declined included: $25,000<br />
toward the Wellbeing North Canterbury’s manager’s salary;<br />
assistance toward the aquisition of a doctor’s house in Hanmer<br />
Springs; $7,500 per year to develop a sister city relationship<br />
with Honghu City, China; employing a full time forest ranger<br />
in Hanmer Springs; introducing a $5 bounty fee for possums;<br />
contributing $25,000 toward a men’s support programme to<br />
reduce suicide; introducing an eagle breeding programme.<br />
As a result of the continuing downturn in the tourism industry in<br />
Canterbury, the <strong>Council</strong> has reforecast the revenue projections<br />
for the Hanmer Springs Thermal Pools & Spa. As a result, the<br />
revenue derived from the Thermal Pools operation was reduced<br />
from $6.671 million to 6.4 million. There was also a reduction<br />
of $65,000 in surplus forecast from the cafe operation and a<br />
$31,000 reduction in other revenue sources.<br />
With the benefit of some quantity survey estimates, there was<br />
a reassessment of the capital expenditure for the changing<br />
rooms and administration building for the pools operation from<br />
$1 million to $2 million.<br />
For the first three years, the reduction in the revenue has<br />
resulted in the <strong>Council</strong> spending more on reserve - based<br />
expenditure than it is earning from the surpluses derived from<br />
the Hanmer Springs Thermal Pools & Spa. but the <strong>Council</strong> is<br />
comfortable in funding this from utilising some of the existing<br />
reserve balance that has been generated by the surpluses in the<br />
past.<br />
CentralGovernment Elections<br />
Rotherham public Toilets<br />
Local Government Elections<br />
2018/19<br />
2017/18 2019/20<br />
Representation Review<br />
<strong>Long</strong> <strong>Term</strong> <strong>Plan</strong> Review<br />
2020/21<br />
Central Government Elections<br />
<strong>Long</strong> <strong>Term</strong> <strong>Plan</strong> Review<br />
2021/22<br />
7
www.hurunui.govt.nz<br />
How <strong>Council</strong> services are rated can be contentious and difficult<br />
to understand. We use a variety of different rating methods,<br />
for example, we rate some services across the district and<br />
others across wards only. We also fund some activities through<br />
targeting particular users (as how tourism is currently funded).<br />
The Financial Strategy and Revenue and Funding Policy in this<br />
<strong>Plan</strong> both provide information to give a better understanding of<br />
how activities and service are funded and the rationale behind<br />
that. The Financial Strategy is a new requirement under the<br />
Local Government Act.<br />
Full details of the rate movements year by year are shown in<br />
the Funding Impact Statement in this <strong>Plan</strong>. We must emphasise<br />
that amenity and targeted rate increases vary considerably<br />
across the district according to the projects planned for each<br />
ward. For example, there are differing levels of expenditure for<br />
upgrades and debt repayment for each water scheme; there is a<br />
new medical centre proposed for Cheviot; a number of projects<br />
planned for Hanmer Springs; and so on. The sample property<br />
analysis in the appendices at the back of this document, gives a<br />
picture of the impact of rates for the <strong>2012</strong>/2013 year for the<br />
various rating areas. You can find out what the rates are for your<br />
property for any year up to year 10 of this plan by contacting us<br />
directly or going onto our website.<br />
Despite the increase to our rates, we have taken a conservative<br />
approach to this plan. We assure you, as ratepayers and<br />
residents, that we have applied our best efforts to develop this<br />
long term plan diligently, to create what we believe is a robust<br />
and comprehensive strategic framework for <strong>Hurunui</strong> for the<br />
next ten years, notwithstanding the challenges and uncertainties<br />
we all presently face. Finally, a sincere thank you to those of<br />
you who took the time to write a submission to the draft plan<br />
and to those of you who presented their submission personally<br />
to the <strong>Council</strong>. As a result of your efforts, you have helped us<br />
determine this final long term plan.<br />
8
About the <strong>Plan</strong><br />
Introduction<br />
The Local Government Act 2002 requires all councils to have a<br />
<strong>Long</strong> <strong>Term</strong> <strong>Plan</strong> (LTP). The <strong>Hurunui</strong> <strong>Community</strong> <strong>Long</strong> <strong>Term</strong> <strong>Plan</strong><br />
is our LTP.<br />
This plan is the combined effort of <strong>Council</strong> and the district’s<br />
community. Many of our sub committees have been actively<br />
involved in preparing plans for their townships and wards<br />
and their efforts are reflected in this plan. So are the views<br />
of the many individuals who told us what they consider to be<br />
important for the future of our district. Many people have put<br />
considerable numbers of hours into the development of this<br />
plan. The plan covers a 10 year period from 1 July <strong>2012</strong> to 30<br />
June <strong>2022</strong>.<br />
Updating the <strong>Plan</strong><br />
This plan will be updated and revised every 3 years. The plan is<br />
one of the main ways you can influence what the <strong>Council</strong> does<br />
every 3 years.<br />
In the years between each <strong>Hurunui</strong> <strong>Community</strong> <strong>Long</strong> <strong>Term</strong> <strong>Plan</strong><br />
review, we will prepare an Annual <strong>Plan</strong> which will focus on the<br />
budgets of the particular year of publication. This information<br />
will be taken from the <strong>Hurunui</strong> <strong>Community</strong> <strong>Long</strong> <strong>Term</strong> <strong>Plan</strong>.<br />
Guide to the <strong>Plan</strong><br />
The following is a brief guide about the information contained in<br />
each section of the plan.<br />
Introduction - This section sets out key issues that we want<br />
to bring to your attention and want to hear from you on.<br />
This section also contains a new and important piece of this<br />
plan – the Financial Strategy. This will tell you about our main<br />
financial challenges and what our financial position is – how we<br />
can afford the services that we provide and how we intend to<br />
continue to fund these. You will find out how your rates are<br />
spent, and the community outcomes we consider important to<br />
our communities.<br />
Township Profiles – Here you will find key information about<br />
the district each ward and community rating area, including,<br />
demographic data, key priorities and amenity rates.<br />
<strong>Hurunui</strong> <strong>Community</strong> <strong>Long</strong> <strong>Term</strong> <strong>Plan</strong> <strong>2012</strong> - <strong>2022</strong><br />
well as financial statements required by law.<br />
Policies – Provides the key <strong>Council</strong> policies (including financial<br />
policies and principles) to assist with decision making and<br />
planning.<br />
Appendices – This section contains various summaries of<br />
strategies and plans that are important to include to provide<br />
more context and information relating to our services.<br />
Monitoring the <strong>Plan</strong><br />
At the end of each financial year, we complete an Annual Report.<br />
In this report, we will state how we have performed against<br />
what we said we were going to do in this plan and at what cost.<br />
Changing the <strong>Plan</strong><br />
If any significant changes need to be made to the <strong>Hurunui</strong><br />
<strong>Community</strong> <strong>Long</strong> <strong>Term</strong> <strong>Plan</strong> before it is formally revised at<br />
each three year interval, the proposed changes will be publicly<br />
notified to give anyone affected an opportunity to have their say<br />
before <strong>Council</strong> decides whether or not to make the proposed<br />
changes.<br />
Our ‘Significance Policy’ guides us in determining the importance<br />
of an issue and the possible impact on the community. When an<br />
issue is deemed significant, we will consider how best to consult<br />
you. The significance policy is included in the Policy section.<br />
The <strong>Plan</strong> Does Not Include GST<br />
When reading this document, please be aware that all of<br />
the figures quoted in the LTP are GST exclusive except the<br />
‘Statement of Rating Policy’ and the ‘Development Contributions<br />
Policy’.<br />
Inflation<br />
The plan has been developed on an inflation adjusted basis<br />
to comply with accounting standards. Details of the inflation<br />
assumptions used are outlined on page 158.<br />
<strong>Council</strong> Activities – Gives useful information for each <strong>Council</strong><br />
activity such as water, roading, community services etc, and<br />
financial information for each activity, as well as any major<br />
priorities or projects planned.<br />
Financial Overview – This section is where financial<br />
information is summarised. It gives the 10 year capital<br />
expenditure programme and forecast financial statements as<br />
9
www.hurunui.govt.nz<br />
Relationship Between the <strong>Hurunui</strong> <strong>Community</strong> <strong>Long</strong> <strong>Term</strong> <strong>Plan</strong> and Other Documents<br />
Annual<br />
Repor t<br />
Knowing what the <strong>Council</strong><br />
has achieved<br />
<strong>Community</strong><br />
Outcomes<br />
Knowing what is important for the<br />
future wellbeing of our community<br />
Knowing how it s going<br />
to be paid for<br />
Annual<br />
<strong>Plan</strong><br />
Knowing what the <strong>Council</strong> is doing to<br />
meet community outcomes<br />
Hur unui <strong>Community</strong><br />
<strong>Long</strong> Ter m <strong>Plan</strong><br />
The LTP integrates strategies, policies and activities in the<br />
context of identified community outcomes, and in a way that<br />
promotes public accountability and integrated decision making.<br />
All planning that we do lines up with the LTP, as well as other plans,<br />
such as our asset management plans and waste management<br />
plans, and linking to other non-mandatory strategies such as<br />
the <strong>Hurunui</strong> <strong>Community</strong> Road Safety Strategy.<br />
The activities set out in this LTP contribute to the achievement<br />
of the community outcomes, and promote the <strong>District</strong>’s social,<br />
cultural, economic or environmental wellbeing.<br />
10
How Your Rates are Spent<br />
The <strong>Council</strong>’s Projected Income and Expenditure for <strong>2012</strong> / 2013<br />
<strong>Hurunui</strong> <strong>Community</strong> <strong>Long</strong> <strong>Term</strong> <strong>Plan</strong> <strong>2012</strong> - <strong>2022</strong><br />
Operating Income of $30.1 million for the <strong>2012</strong>/2013 year<br />
Hanmer Springs<br />
Thermal Pools and<br />
Spa<br />
32%<br />
Other Income<br />
10%<br />
General Rates<br />
19%<br />
Targeted Rates for<br />
Water Supplies<br />
2%<br />
NZTA Subsidies and<br />
Other Grants<br />
11%<br />
Development<br />
Contributions<br />
1%<br />
Targeted Rates for<br />
Other Services<br />
25%<br />
Operating Expenditure of $30.3 million for the <strong>2012</strong>/2013 year<br />
Governance<br />
2%<br />
Corporate Services<br />
16%<br />
Water Supplies<br />
11%<br />
Sewerage<br />
2%<br />
Stormwater and<br />
Drainage<br />
0%<br />
Roads and Footpaths<br />
19%<br />
Hanmer Springs<br />
Thermal Pools and<br />
Spa<br />
25%<br />
<strong>District</strong> Promotion<br />
2%<br />
Waste Minimisation<br />
6%<br />
Compliance and<br />
Regulations<br />
2%<br />
<strong>Community</strong><br />
Services<br />
Property<br />
3%<br />
4%<br />
Reserves<br />
4%<br />
Emergency Services<br />
1%<br />
Resource<br />
Management<br />
3%<br />
Capital Expenditure of $10.8 million for the <strong>2012</strong>/2013 year<br />
Hanmer Springs<br />
Thermal Pools and<br />
Spa<br />
25%<br />
Corporate Services<br />
5%<br />
Water Supplies<br />
19%<br />
Sewerage<br />
8%<br />
Emergency Services<br />
2%<br />
Reserves<br />
2%<br />
Property<br />
1%<br />
<strong>Community</strong> Services<br />
1%<br />
Stormwater and<br />
Drainage<br />
3%<br />
Roads and Footpaths<br />
34%<br />
11
www.hurunui.govt.nz<br />
Key Issues<br />
Introduction<br />
In the draft long term plan, we highlighted a number of issues<br />
that we wanted your view on before we came to a final decision.<br />
We received many submissions on these topics and this section<br />
sets out the decisions we made about each issue. Table 2 at the<br />
end of this section shows how each item will be funded.<br />
Drinking Water Standards<br />
In recent years, the Government has placed strong emphasis<br />
on the quality and availability of drinking water for all New<br />
Zealanders, irrespective of where they live. The standard of<br />
drinking water throughout the country has been variable and<br />
in many places, particularly rural New Zealand, below standard.<br />
New Zealand drinking water standards have been developed and<br />
recently revised, and they require all councils to make significant<br />
advancements to meet these standards.<br />
Most of the drinking water in the <strong>Hurunui</strong> <strong>District</strong> fails to meet<br />
the new drinking water standards and currently, eight of our<br />
communities are advised to boil water before they drink it.<br />
The drinking water standards are concerned mainly with three<br />
specific areas: water quality; how we will know our drinking<br />
water is meeting the standards; and what we will do about it if it<br />
doesn’t. There are substantial fines for not complying with the<br />
new legislation – up to $200,000 for an offence and $10,000 for<br />
each day of continued non-compliance for each of our 22 water<br />
supply sources.<br />
In addition, the Health (Drinking Water) Amendment Act 2007<br />
requires all drinking water suppliers to have Public Health Risk<br />
Management <strong>Plan</strong>s (PHRMP) in place outlining how to safely<br />
manage drinking water. This is significant because we have a duty<br />
to ensure the drinking water we supply is safe to drink. (The<br />
same applies for all other councils and private suppliers.) In our<br />
district, we have 22 water supply sources and each needs its own<br />
PHRMP to be completed at various times between July 2014 and<br />
July 2016, depending on how each water supply is defined (based<br />
on the number of customers each supply serves).<br />
These requirements are financially challenging. We have no<br />
option but to plan toward compliance, but the cost to do so is<br />
immense. To upgrade our water systems to be fully compliant,<br />
we have estimated that it will cost $14 million in today’s dollars,<br />
and a further $484,000 per year solely to operate the upgraded<br />
schemes. This caused us a great deal of concern and we have<br />
raised the affordability issue for a small, rural council such as<br />
ours to meet these considerable costs with the Ministry of<br />
Health. We have come to a compromise to achieve drinking<br />
water compliance no later than ten years after the final approval<br />
date for each respective PHRMP, which will be between 2024<br />
and 2027. The compromise involves two main phases to manage<br />
the affordability issue.<br />
First Phase<br />
As a minimum, we will provide drinking water to our consumers<br />
that is bacteriologically free and is safe to consume. To do this<br />
we will need to lift all permanent boil water notices on our<br />
current schemes. This will be achieved using improved interim<br />
technologies to our at risk water intakes that will subsequently<br />
meet these desired outcomes.<br />
Therefore the first phase proposes nine new Miox installations<br />
costing $758,000 for the <strong>2012</strong>/2013 financial year. The at risk<br />
drinking water intakes are: (1) Ashley Rural; (2) Waiau Rural;<br />
(3) Cheviot – Parnassus; (4) Cheviot – Blythe; (5) Cheviot –<br />
Kaiwara; (6) <strong>Hurunui</strong> Rural – No.1; (7) <strong>Hurunui</strong> Rural – Peaks;<br />
(8) <strong>Hurunui</strong> Rural – Lower Waitohi; and (9) Waipara Township.<br />
The existing MIOX plant serving the targeted Cheviot and Gore<br />
Bay Township community will be moved to the intake to serve<br />
and improve the full water reticulation pipeline.<br />
This capital costs and on-going operational costs involved<br />
is to be met by a special targeted rate for each dwelling that<br />
benefits from the water treatment. It is estimated to cost<br />
affected ratepayers approximately $100 per year to fund both<br />
the operational and capital costs. This will affect an estimated<br />
1,463 dwellings in total. We plan to stage the implementation<br />
of this funding over three years, therefore those ratepayers will<br />
be charged $33 in <strong>2012</strong>/13, $66 in 2013/14, and the full $100<br />
in 2014/15. The exception to this special targeted rate is for<br />
the consumers on the Ashley Rural water scheme. The cost of<br />
their Miox installation will be met solely by those properties<br />
connected to that scheme as part of their standard, unit rate.<br />
This is because the majority of the consumers of the Ashley<br />
Rural Water Supply reside outside the <strong>Hurunui</strong> <strong>District</strong> and<br />
already have a special rating arrangement in place.<br />
All other district-wide intakes are either safe deep source<br />
water or have not had any e-coli non-compliance over the last<br />
three years, thus perceived as safe at present. These will be<br />
continuously monitored for further improvement if the ‘safestatus’<br />
changes. This approach will unfortunately not eliminate<br />
the issue of temporary boil water notices from time to time,<br />
when tested and triggered e-coli contamination is related to<br />
post-intake drinking-water pipeline breaches, e.g. pipe breaks,<br />
etc.<br />
Second Phase<br />
The second phase involves the upgrading of the water schemes<br />
to full compliance, and will mean the end to the Miox treatments.<br />
The capital cost in today’s money is $14 million, and we plan to<br />
implement this between 2024 and 2027. To manage the cost,<br />
this will be funded through a district wide general rate. This<br />
is different to how we currently fund water supplies, which<br />
is through targeted rates for individual schemes. We do not<br />
believe the targeted method of funding is possible or a fair way of<br />
12
<strong>Hurunui</strong> <strong>Community</strong> <strong>Long</strong> <strong>Term</strong> <strong>Plan</strong> <strong>2012</strong> - <strong>2022</strong><br />
funding for any of our ratepayers to upgrade our drinking water<br />
to legislated standards. There are simply too few people on the<br />
smaller community schemes in particular, to be able to pay for<br />
these upgrades. By funding via a district wide rate, the cost is<br />
spread across all ratepayers, hence making it more affordable<br />
and achievable over all. This does mean that everyone pays,<br />
whether or not on a private water scheme.<br />
Although the capital works required won’t start being built until<br />
2024, we are going to start rating from 2015/16 to build up<br />
funds which will offset the full capital cost when it is necessary.<br />
The cost of this will be $41 per property and this rate fund,<br />
along with accumulating interest, should provide a fund of<br />
approximately $3 million to assist with meeting the capital cost.<br />
The method by which the balance of the capital work and the<br />
on-going operational costs will be met, will be refined over time.<br />
This will again be a topic for discussion when we review our<br />
long term plan again in 2015.<br />
Sewer Improvements<br />
Disposal of treated wastewater direct to waterways has been<br />
a common practice nationally in the past, but this approach is<br />
no longer considered sustainable or environmentally acceptable.<br />
In our district, we have seven wastewater treatment plants<br />
using oxidation ponds as an effluent treatment process. These<br />
treatment plants are located at Amberley, Hanmer Springs,<br />
Cheviot, Greta Valley, Motunau Beach, Hawarden and Waikari.<br />
We are going to do more work to our Hanmer Springs<br />
wastewater treatment plant so that the treated wastewater<br />
is disposed onto land instead of into the waterway (which<br />
is a resource consent condition). We are investigating the<br />
best options available to us in Hanmer Springs for both land<br />
acquisition and improved effluent treatment. The cost for this<br />
sewer land disposal work is $1,200,000 factored into year<br />
2015/16 and will be paid for by the Hanmer Springs Ward<br />
ratepayers. Other planned work includes improving dissolved<br />
oxygen levels in the treatment ponds to eliminate issues such<br />
as odour and reduced treatment efficiencies. For this work we<br />
plan to spend $220,000 in <strong>2012</strong>/13.<br />
Cheviot’s wastewater treatment plant (WWTP) disposal<br />
system is spray irrigation to land or onto the overland flow area<br />
when the land disposal area is saturated. We are investigating<br />
possible long-term treatment options (long term capacities; soil<br />
permeability and content analysis; seasonal effects, flow/water<br />
quality/ecology of Crystal Brook and neighbouring groundwater<br />
quality assessments) associated with treatment and disposal of<br />
wastewater from the Cheviot WWTP. We will work with the<br />
Canterbury Regional <strong>Council</strong> to agree on the best solution<br />
going forward in <strong>2012</strong>/13. This plant’s resource consent expires<br />
11 September 2014, when the Canterbury Regional <strong>Council</strong> will<br />
decide if improvements are required to renew this resource<br />
consent. No disposal to waterways is allowed. We are planning<br />
to pay for this through usual operating costs at no increase to<br />
ratepayers.<br />
Amberley and Waikari have existing treated effluent disposal<br />
to land, with Greta Valley and Motunau Beach using a primary<br />
option of disposal to land and secondary option to waterway<br />
when the land is saturated, for example, seasonal wet weather<br />
conditions. Hawarden’s system is disposal to waterway until<br />
changes are effected through the resource consent renewal,<br />
which will be in 2027 or subject to any new requirements under<br />
the Natural Resources Regional <strong>Plan</strong> (NRRP) review currently<br />
underway at Canterbury Regional <strong>Council</strong>. We will consider<br />
more natural methods of disposal, such as wetland filtration<br />
if proven feasible and cost effective. All systems are closely<br />
monitored and audited by the Canterbury Regional <strong>Council</strong> for<br />
compliance with stringent consent conditions to protect and<br />
enhance the environment surrounding these treatment plants.<br />
Stormwater Improvements<br />
We have been working on a programme of stormwater<br />
improvements to the Amberley township and Amberley<br />
and Leithfield Beach communities since 2008 when we had<br />
significant property flooding following high rainfall events.<br />
The improvements have taken a disappointingly long time<br />
to implement due to the resource consent process and<br />
Environment Court hearings process. So far, only two major<br />
physical works have been completed – the flood diversion<br />
from Dock Creek along Lawcocks Road, and a piped outfall of<br />
the Leithfield Outfall Drain to the sea. By the time this plan<br />
is finalised, the flood diversion works in the Amberley swamp<br />
area (to include an outlet culvert under Stanton Rd) and the<br />
area from Dry Gully to the Mimimoto Lagoon will have been<br />
completed, as well as the new pipelines in Amberley.<br />
A flood flow diversion from the Eastern Drain across to the<br />
Amberley North lagoon is planned in <strong>2012</strong>/13 to complete the<br />
flood mitigation works. Detailed design and land ownership<br />
issues still have to be finalised. $294,000 has been budgeted for<br />
this work (to do detention ponds and upgrades), with a further<br />
$84,000 in the 2016/17 budget for Chamberlain Park filters.<br />
This will be funded through a special rate across Amberley Ward.<br />
Applications for global consents to discharge stormwater from<br />
the Amberley urban area and new residential developments in<br />
Hanmer Springs will be made in the <strong>2012</strong>/13 year. Both of these<br />
will be funded via a separate rate for the Amberley Wards and<br />
Hanmer Springs as well as development contributions.<br />
We will be recruiting a stormwater engineer in 2013/2014 to<br />
manage this area of our work. This engineer will be responsible<br />
for developing district-wide stormwater catchment and<br />
management plans, and undertake the range of tasks required to<br />
ensure we have effective stormwater systems in place, inclusive<br />
of appropriate maintenance regimes.<br />
13
www.hurunui.govt.nz<br />
Targeted Tourism Rate and <strong>District</strong> Promotion<br />
Our tourism promotion and limited district promotion is<br />
currently carried out through one of our council committees<br />
called the ‘<strong>Hurunui</strong> Tourism Board’. The way we fund this is<br />
through a ‘targeted tourism rate’ which has had its share of<br />
controversy. Those who pay are ratepayers and businesses<br />
who are deemed to be involved directly in the visitor / tourism<br />
sector. From this sector, we collect $286,000 annually with an<br />
additional contribution of $45,000 from the Hanmer Springs<br />
Thermal Pools and Spa. We are concerned that we don’t yet<br />
have the funding model right and intend to review the targeted<br />
tourism rate and explore ways of funding a broader concept of<br />
‘district promotion’ or tourism in a different way.<br />
We think we can better promote the district in all aspects by<br />
adopting a broader approach, rather than just focusing only on<br />
tourism. The issue of who benefits from district promotion and<br />
who should fund it is a challenging issue and we want to develop<br />
a better way to do this. We will continue with the targeted<br />
tourism rate up to the end of the <strong>2012</strong>/13 (and have included it<br />
throughout the 10 year budget for the meantime), to allow time<br />
for a viable alternative to be developed.<br />
Having taking into account the submissions we received on<br />
this topic, we will look at how we might phase out the current<br />
targeted tourism rate in 2013/14 when a new model would take<br />
effect. We will begin working on this before the end of <strong>2012</strong><br />
around what a possible alternative model would look like. This<br />
will include looking at how to improve our promotion of the<br />
district. At this stage, we are unsure whether this new model<br />
will retain the <strong>Hurunui</strong> Tourism Board, or see the development<br />
of a new committee or board. We will continue with what we<br />
have in the meantime until an alternative is found.<br />
Cost of Insurance<br />
It will be no surprise to anyone that the cost of insurance has<br />
significantly risen as a result of the Canterbury earthquakes. The<br />
damage to Christchurch in particular and the resulting insurance<br />
liability has been unprecedented anywhere in the world before.<br />
It is now well known that globally, the insurance industry had<br />
to have a major rethink of how it could continue to provide<br />
insurance cover and still be affordable. Given that the <strong>Hurunui</strong><br />
<strong>District</strong> is tectonically active and we are periodically subjected<br />
to floods, rural fires, snow and winds, we have traditionally been<br />
well insured and cover our infrastructure and liabilities.<br />
Up until July 2011, the cost of our insurance was $212,858 per<br />
annum. This is the total bill for all <strong>Council</strong> infrastructure and<br />
liabilities, including the Hanmer Springs Thermal Pools and Spa.<br />
Our new insurance arrangement now costs $564,414 per year<br />
to cover the same infrastructure as we did in the past. This<br />
significantly contributes to our 5.84% increase in rates as the<br />
approximate increase in insurance across the organisation of<br />
$350,000 alone represents 2.73% of the total rates that were<br />
struck in the 2011/<strong>2012</strong> year.<br />
The process for renewing the insurance policies is likely to be<br />
more stringent in the future and there could be the possibility<br />
that some of our assets may not be covered by insurance, as has<br />
been the case for Christchurch City and Waimakariri <strong>District</strong><br />
<strong>Council</strong>s for the 2011/<strong>2012</strong> year. It is our intention to remain<br />
fully insured at all times.<br />
Earthquake Strengthening<br />
We have completed the first stage of a desktop review of<br />
potential earthquake prone buildings in the <strong>Hurunui</strong> district for<br />
all council owned buildings and are now currently carrying out<br />
the second stage which will include all privately owned buildings.<br />
The desk top review should be completed by December <strong>2012</strong>.<br />
The completed desk top study will show how many commercial<br />
and public buildings in the district are suspected to be earthquake<br />
prone. At this early stage we have provisional numbers of 368<br />
commercial buildings, both privately and council owned. 150<br />
are estimated to be built before 1976, and up to 90 of them are<br />
suspected to be earthquake prone, and therefore could pose a<br />
potential danger to the public. We own 68 of the commercial<br />
and public buildings built before 1976 and of these, we have<br />
confirmed 48 that are included on the first stage of the desktop<br />
study. Engineers are currently carrying out an initial evaluation<br />
procedure (IEP) of some of these buildings which will confirm<br />
whether or not they are earthquake prone.<br />
The desk top review will only provide information about<br />
buildings without looking at them in a detailed structural<br />
manner. There are certain types of building that are considered<br />
to be more earthquake prone than others and it is these that<br />
we will be focusing on. They are usually unreinforced concrete<br />
and masonry buildings, but there may be others that are also at<br />
risk. The assessment process will be carried out in accordance<br />
with the Earthquake Engineering Society of New Zealand<br />
guidelines. We will need qualified engineers to actually assess<br />
each of these buildings to confirm to us whether or not the<br />
building is potentially earthquake prone and that owners should<br />
be advised. To do this IEP assessment (without any actual repairs<br />
or remedial work), it will cost approximately $69,000 to do<br />
90 earthquake prone buildings spread evenly over the first 3<br />
years of the <strong>Long</strong> <strong>Term</strong> <strong>Plan</strong>. We are taking an active approach<br />
to identify and upgrade buildings at risk following the lessons<br />
learned from the Christchurch earthquakes. Obviously, we do<br />
not want a repeat of that disaster in our district.<br />
Once we have the IEP assessments from the independent<br />
engineers, we will then be able to inform property owners that<br />
we suspect that their building is earthquake prone. They will<br />
then be required to carry out a detailed engineering assessment<br />
to show how to remedy any risks to the building. Because most<br />
of the buildings are council owned, the same will apply to us. At<br />
this stage, we have not made a budget provision for any actual<br />
strengthening, repair or demolition work. We plan to decide<br />
on this once we have the information on a case by case basis.<br />
14
<strong>Hurunui</strong> <strong>Community</strong> <strong>Long</strong> <strong>Term</strong> <strong>Plan</strong> <strong>2012</strong> - <strong>2022</strong><br />
Other owners of buildings will need to do the same once they<br />
have information provided to them. There is of course, nothing<br />
stopping anyone getting their own independent assessment at<br />
their own cost in the meantime, or seeking a second opinion.<br />
We do not have the in-house expertise to perform this work.<br />
We do know that structural engineers are highly sought after<br />
in the Canterbury region and we are making this plan on the<br />
proviso that we will be able to contract the skills we need to<br />
undertake this work.<br />
We consider this work to be vital because of the threat to life<br />
if buildings collapse. The cost for this work will be paid for this<br />
through the general rate for three years from <strong>2012</strong>/13 because<br />
of the potential impact on the general public. The general rate is<br />
funded through a portion being assessed as a fixed charge per<br />
property and the balance assessed on the capital value of the<br />
property.<br />
Cost to Defend RMA/Court Action<br />
Each year we need to get legal advice or representa tion, or<br />
specialist advice about a variety of matters relating to resource<br />
consents, district plan changes and policy de velopment.<br />
Traditionally, we have tended to under-budget for these costs<br />
as many of them are unknown when we prepare our annual<br />
budgets. However, last year we were aware of a number of<br />
situations that were going to incur legal or consultancy costs<br />
and we did make a budget provision based on that knowledge.<br />
Although we will continue to face unexpected legal costs into<br />
the future, we have decided to continue to budget what we did<br />
last year for each year of the long term plan, that is, $105,000<br />
(adjusted for inflation) annually. This will be funded through a<br />
<strong>District</strong> Rate. There will be situations where legal costs are far<br />
in excess of our budget. The most recent example of this was<br />
the cost to defend MainPower’s Mt Cass Wind Farm resource<br />
consent. The cost to ratepayers was approximately $300,000<br />
(allowing for the successful costs award against Mainpower<br />
from the Environment Court of $136,394). Legal and specialist<br />
advice comes at a price and we do not always have in-house<br />
expertise for every scenario that comes to us.<br />
Road Funding<br />
Our roads are maintained and built using subsidy funds from<br />
New Zealand Transport Agency (NZTA) and money collected<br />
through rates. This excludes state highways which are funded<br />
and maintained solely through NZTA. Three years ago,<br />
central government deliberately cut maintenance funding to<br />
all district councils, as it decided to focus on capital works to<br />
national state highways (Roads of National Significance) and<br />
the Auckland roading network needs as priorities. Central<br />
government believes that “increased funding for State Highway<br />
construction will bring benefits for national economic growth<br />
and productivity, particularly given that State Highways carry<br />
most inter-regional freight and link major ports, airports and<br />
urban areas (Government Policy Statement <strong>2012</strong>)<br />
In 2009, all Road Controlling Agencies (RCA), of which we are<br />
one, were told by the Minister of Transport to “do more with<br />
less” in terms of road maintenance financial subsidy allocations.<br />
We were tasked to find better and smarter ways of looking<br />
after our roads without relying on the previous levels of NZTA<br />
subsidy funding. To qualify for financial subsidy assistance, all<br />
RCA’s are to use Activity Management <strong>Plan</strong>s (AMP). When up<br />
to date, our AMP provides us with a better understanding of our<br />
current assets in terms of location, age and condition. This sets<br />
our works programme for the following three years in terms<br />
of maintenance, operations, renewals and capital works. This<br />
programme is submitted to NZTA as part of the Regional Land<br />
Transport Programme (RLTP). Our funding was cut by $600,000<br />
per annum on average on our RLTP for the full funding cycle<br />
covering the years from 2009 to <strong>2012</strong>. Although the approved<br />
subsidy funding was 4.5% more than the previous year’s budget,<br />
it was substantially less than that required to maintain the<br />
levels of service we wanted for our roading infrastructure. No<br />
escalation (or inflation) was added for year 2 and 3 of this<br />
programme which placed further pressure for us to “do more<br />
with less”. In the meantime, we have restructured our road<br />
maintenance contracts to get the most we can for our money<br />
and to maintain levels of service for our local roads. Indicative<br />
budgets have been released by NZTA for the three year period<br />
from <strong>2012</strong> to 2015, which is 5% less than our RLTP submission.<br />
This will result in approximately $226,000 less funding per<br />
annum across all three years. We will continue to retain our<br />
funding as previously indicated as unsubsidised work and the<br />
rate impact for roading will continue as previously stated in the<br />
plan. We have made the assumption that the reduced level of<br />
NZTA funding will continue through the life of the LTP. This has<br />
left us with a major challenge. Our Asset Management <strong>Plan</strong>s<br />
(AMPs) tell us when, how and why we need to do work on<br />
each of our roads to ensure maximum whole-of-life for this<br />
asset (maximum return on investment approach); but we do not<br />
have the required subsidised income to maintain our roading<br />
network to the level our AMPs stipulate.<br />
We have done our best to drive greater efficiencies within<br />
our current road maintenance contracts, without affecting the<br />
current levels of service. The improved collaboration between<br />
our contractors, suppliers and us using a ‘best-for-asset/bestfor<br />
contract’ approach, has provided lower contract rates<br />
that may allow us to maintain our current service levels until<br />
2014/15 (assuming no untoward event happens that damages<br />
our infrastructure). At the end of this period, our maintenance<br />
contracts will be renewed with cost escalations included. This<br />
is where we have a problem. NZTA have declared that they<br />
will not pick up contract price escalations through their road<br />
maintenance subsidy scheme. In the meantime, we have allowed<br />
for inflation adjustments to the roading costs (using the inflation<br />
assumptions) and also assumed that NZTA will continue to<br />
meet their share of those costs that are currently subsidised,<br />
15
www.hurunui.govt.nz<br />
again based on the assumption that the financial assistance<br />
rate will not change over the ten year period.<br />
If NZTA do not include inflation in future subsidies, and maintain<br />
the levels of cuts to date we will have to pass the difference in<br />
costs to our ratepayers annually to maintain our current levels<br />
of service and keep the road asset life in check. If we don’t,<br />
this will leave us with a future financial shortfall that is further<br />
susceptible to maintenance cost increases through peak oil and<br />
bitumen cost increases in particular. We can either continue<br />
to put up our annual rates to provide more local unsubsidised<br />
funds to keep our roads in their current condition, or we can<br />
accept that there will be a marked deterioration in our road<br />
conditions (structurally, appearance and driving quality). The<br />
impact of this is that our roading assets life will reduce and will<br />
eventually devalue over time, thus not meet their initial designed<br />
criteria outcomes.<br />
The key problem that we face is that the level of cost that has<br />
been allowed for in the <strong>Long</strong> <strong>Term</strong> <strong>Plan</strong> falls significantly short<br />
of what was provided for in the AMP. The AMP was developed<br />
prior to the change in central government policy and before we<br />
were able to achieve greater efficiencies through our current<br />
road maintenance contracts. The difference over the ten years<br />
between what was scheduled in the AMP and what has been<br />
provided in the plan amounts to a total of $18 million. Based on<br />
the assumption that NZTA will provide the amount of subsides<br />
allowed for in the plan, should we incur the level of cost in<br />
the AMP, then that additional $18 million would need to be<br />
covered by rates or other funding sources . We are confident<br />
with achieving greater efficiencies in the current contracts so<br />
that the roading network can be maintained at the current level<br />
of service until 2014/15. Through submissions to the draft LTP,<br />
some of you told us that you consider it essential that we do all<br />
we can to prevent the roads deteriorating, even if that meant<br />
paying more rates. To continue to meet the current level of<br />
service, now and into the future, may require greater ratepayer<br />
funding or a change to the current accepted levels of service.<br />
This topic will be an ongoing discussion for us into future years<br />
including the next long term plan review in 2015 and AMP<br />
roading review 2014.<br />
Amberley Swimming Pool<br />
The life of the Amberley swimming pool and our awareness of<br />
the community desire for an improved pool, whether that is<br />
a major upgrade or a new facility, have been of interest to us<br />
for some years now. Through the submisssions to the draft LTP,<br />
we received 23 submissions on this subject with the majority<br />
supporting this community desire. In 2008, we did a review<br />
of the life-expectancy and replacement costs of the Amberley<br />
swimming pool and concluded that the present pool was good<br />
for at least 10 more years. In the 2009 long term plan draft,<br />
we allowed $3 million in the 2018/19 financial year to build a<br />
new heated, covered pool. The rating model to pay for the this,<br />
allocated the greater costs to the Amberley Ward, and a lesser<br />
amount to outlying areas on the basis of an assumption of usage<br />
beyond Amberley. Consultation on this matter then, gained good<br />
public support for the proposal, and it was decided to advance<br />
the project to the 2013/14 year. The budget provision was made<br />
on the basis that $1 million of the $3 million would be derived<br />
from fund raising and that the Amberley community would take<br />
the responsibility for this.<br />
Three years have since passed and no fund raising activities have<br />
taken place. Nor have we collected any rates to build up a fund<br />
for a future pool. The Amberley Ward Committee established<br />
a working group in 2011 to investigate the possibilities<br />
for the Amberley swimming pool and to come up with a<br />
recommendation to best suit the needs of the community. The<br />
working group concluded that the site of the existing pool is<br />
the best available and so commissioned a specialist engineer’s<br />
report on options to upgrade the present complex. This was<br />
undertaken in early <strong>2012</strong>. The resulting suggestions include a<br />
major upgrade of the existing pool costing just under $2 million<br />
which is well within the original $3 million budget. However, the<br />
estimated operational cost of running an all year heated pool,<br />
amounts to between $260,000 and $340,000 per year. This is<br />
after taking into account the entry fees, swimming lessons and<br />
other revenue making pool activities.<br />
Although the community desire is to have a heated indoor<br />
pool that can operate either all year round, or at least most<br />
of the year, the operational cost is significant and exceeds any<br />
previous thinking about how much it would cost to actually<br />
run the pool. Very few public swimming pools in New Zealand<br />
make a profit or break even, and they are reliant on significant<br />
subsidies from rates to operate. The Amberley ward ratepayers<br />
have traditionally met the operational cost from amenity rates.<br />
However, the estimates for running an improved, heated, all year<br />
round pool is likely to exceed Amberley ratepayers ability or<br />
desire to pay, and is substantially more than they pay now. There<br />
is more work ahead for the working group, the Amberley Ward<br />
Committee and the <strong>Council</strong> before a proper proposal with all<br />
the facts is able to be put to the community.<br />
For these reasons, we have decided to not make a budget<br />
provision in this long term plan at this stage. We have requested<br />
a report to come to a council meeting in the <strong>2012</strong>/13 year to<br />
explore options and costings for an upgraded pool. If supported,<br />
our intention is to include a proposal for an upgraded pool<br />
and funding model into the 2015/25 <strong>Long</strong> <strong>Term</strong> <strong>Plan</strong>. In the<br />
meantime, we have an expectation that those wanting an<br />
improved pool become involved and commence fund raising.<br />
The Amberley Ward Committee and the rest of the district will<br />
need to have the opportunity to say what they are prepared<br />
to fund before we can decide who should pay. We intend to<br />
properly consult with you over this matter. For us to have the<br />
confidence to make a significant budget provision, we need to<br />
be able to give you the full story on the cost, who will pay and<br />
what you will get for your money. In the meantime, we have<br />
budgeted for the continued operation of the current swimming<br />
pool on the assumption that it may still be operational up to<br />
2020, depending on what is decided before then.<br />
16
<strong>Hurunui</strong> <strong>Community</strong> <strong>Long</strong> <strong>Term</strong> <strong>Plan</strong> <strong>2012</strong> - <strong>2022</strong><br />
Cheviot Library/Service Centre<br />
We received a large number of submissions regarding moving the<br />
Cheviot community library out of the Cheviot Area School and<br />
into the Cheviot Service Centre on the main street of Cheviot.<br />
Several of you were not in favour of this option, but many of<br />
you did endorse this concept. We endorsed the Cheviot Ward<br />
Committee’s recommendation that the library is moved. This<br />
will enable the library and council services to be delivered from<br />
the one site by one person. The school library will remain in its<br />
current location.<br />
The service centre has not had an upgrade for years and<br />
therefore needs some alterations and refurbishment to create<br />
a more vibrant community space. A working group comprising<br />
of a mix of local Cheviot people has been selected to work on<br />
the detail of the move and to create a new look for the service<br />
centre / library to capture the unique essence of Cheviot and<br />
provide a service to meet the needs of the locals. Detail such<br />
as the opening hours, days of the week to be open, design of<br />
the interior and exterior of the building, etc are to be worked<br />
through. The timetable for the project will also need to be<br />
worked through, but it is planned take place in the <strong>2012</strong>/13 year.<br />
$100,000 has been set aside for the building alterations which<br />
will not incur an increase in rates.<br />
Cheviot Medical Centre<br />
We own four medical buildings in the <strong>District</strong> – in Hanmer<br />
Springs, Rotherham, Waikari and Cheviot. We originally got<br />
involved in this area years ago to help attract qualified medics<br />
into the district to take up private practices without the<br />
deterrent of capital cost, and provide health services that are<br />
of a good quality, affordable and meet the needs of our rural<br />
communities. This is an on-going challenge as attracting doctors<br />
and nurses who are prepared to work and live in rural New<br />
Zealand is an issue that <strong>Hurunui</strong> does not face alone. Times<br />
have changed and the ideal of finding General Practitioners<br />
wanting to set up practice in a rural community and stay for<br />
life (and work alone) has become unsustainable. However<br />
important considerations for future planning still include having<br />
high quality medical facilities and a strong network of medical<br />
practitioners and providers to support each other.<br />
Whereas we do not recruit medical staff for the district, we<br />
believe we do have a role to provide medical facilities and<br />
assist in facilitating good outcomes. We regularly meet with<br />
key providers of medical services for the <strong>District</strong>, including the<br />
Canterbury Rural Primary Health Organisation, Canterbury<br />
<strong>District</strong> Health Board and local practitioners, etc. These<br />
discussions help us keep up with the issues our GPs and medical<br />
centres are facing and helps us work together to find solutions.<br />
One of the areas we are able to assist is building medical centres<br />
that cater for current and future demand.<br />
Three of our current medical centres are modern, while Cheviot<br />
requires an upgrade or replacement in the near future. This<br />
upgrade has been signalled by its inadequacy to deliver modern<br />
health care into the future. We have allocated $1 million (to<br />
be inflation adjusted) in year 2016/17 to build a new one. The<br />
project will be funded by an internal loan and servicing of the<br />
loan over 20 years is proposed that this be funded through the<br />
Cheviot Medical Centre Rate which is charged to each property<br />
in the Cheviot Ward. This will result in the Cheviot Medical<br />
Centre Rate moving from approximately $30 per ratepayer<br />
to $120 per ratepayer from 2016/17. Some submissions were<br />
received on this topic and all supported improving the Cheviot<br />
Medical Centre. There is still work to be done before a rebuild<br />
or upgrade is undertaken to make sure this is good use of your<br />
money. We will want to be confident that a new building is<br />
needed as opposed to upgrading the current facility, and we also<br />
need to be sure that this is what the community needs. Further<br />
consultation will be done closer to the time before any work<br />
is done.<br />
Rotherham Public Toilet<br />
We have purchased a section on the main road through<br />
Rotherham adjacent to the new Amuri Medical Centre, for a<br />
village green. The section is ideally suited to a public toilet for<br />
motorists passing through Rotherham en-route to the Inland<br />
Road. For motorists travelling to Kaikoura from the West<br />
Coast, this would be the first public toilet since Springs Junction<br />
(i.e. without detouring into remote sites such as Boyle River<br />
or to Hanmer Springs). A toilet on this section will also be<br />
useful for local residents using the village green for picnics or<br />
recreation (playground) or on their way to or from the Health<br />
Centre. This is a long term proposal as we intend building the<br />
toilet in the 2017/18 year. Because it is a long way off and we are<br />
not certain of the demand in this location, we will seek public<br />
views on this proposal again when we review this long term<br />
plan in 2015. In the meantime, $90,000 has been included in the<br />
budget to be funded through the <strong>District</strong> Rate.<br />
Hanmer Springs Facilities<br />
1. Sports Ground<br />
The Hanmer Springs <strong>Community</strong> Board intends to upgrade the<br />
Hanmer Springs sports ground as it is out of date and will not<br />
meet the needs for future growth and demand. Before doing<br />
any work however, the Board will commission an engineer’s<br />
report on the project to determine the extent of works that<br />
can be carried out. They plan to commission this in <strong>2012</strong>/13<br />
to prepare for the physical works to be done in 2015/16. The<br />
report will more accurately scope the project including whether<br />
the project is staged over more than one year. The estimated<br />
cost involved is $30,000 for the engineers report, and $1 million<br />
for the actual development work.<br />
The engineers report will cover the feasibility of including the<br />
following facilities in the upgrade:<br />
• A full basketball size court that can cater for<br />
other indoor sports such as badminton, volleyball,<br />
bowls, netball etc<br />
• A ground floor kitchen facility able to cater for<br />
17
www.hurunui.govt.nz<br />
conferences, weddings, sports club functions, etc<br />
for up to 500 people<br />
• A bar that also provides for the above<br />
• A storage area that will hold equipment, chairs,<br />
tables, and other items used for group functions<br />
• Toilet facilities to serve people using the sports<br />
stadium inside and out<br />
• Area/s suitable for meetings, lounge and<br />
relaxation area, and an administration office<br />
• Changing facilities for sports teams including<br />
shower blocks<br />
• Two Squash courts<br />
• A gymnasium area<br />
There was a support through the submissions for an upgraded<br />
sports ground. Because the Board is not prepared to spend<br />
more than $1 million, this may mean they need to prioritise<br />
what is included in the upgrade. Affordability will be a key<br />
consideration.<br />
2. <strong>Community</strong> Hall Extension<br />
The Hanmer Springs <strong>Community</strong> Board will proceed with the<br />
previously planned extension to the Hanmer Springs community<br />
hall and has allocated $194,400 to do this in 2014/15. They will<br />
spend $10,000 in <strong>2012</strong>/13 to finish the work on the existing<br />
stage floor and frontage that users of the hall have been asking<br />
for.<br />
The extension to the community hall is planned to include:<br />
• Upgrading the existing toilets on either side of<br />
the stage<br />
• Replacing the existing changing rooms with<br />
a large, open, multipurpose space that can be<br />
partitioned off to create several changing rooms<br />
as required. The open area can also be used for<br />
art displays, meetings, etc, as well as changing<br />
rooms for performances.<br />
• A storage area for lighting, sound, stage props, etc<br />
• Entry access for wheelchairs and large items (for<br />
stage productions, etc)<br />
As with the Hanmer Springs sports ground upgrade, the Board<br />
will do its best to maximise the budget so that the extension to<br />
the hall caters for future demand as well as the current demand,<br />
but do not expect to go beyond the allocated budget. Once<br />
again, support for this project was received, particularly from<br />
Hanmer Springs residents.<br />
Funding the Hanmer Springs <strong>Community</strong> Board<br />
The Hanmer Springs <strong>Community</strong> Board members are elected<br />
every three years in line with the local authority triennial<br />
election process. There are 6 Board members, with five being<br />
elected on the Board, and the 6 th member being the appointed<br />
local <strong>Council</strong>lor.<br />
The selected members are paid an amount determined by <strong>Council</strong><br />
in consultation with the <strong>Community</strong> Board. The <strong>Council</strong>lor is<br />
not remunerated for being on the <strong>Community</strong> Board as he is<br />
paid as a <strong>Council</strong>lor through the <strong>Council</strong> remuneration pool.<br />
The selected members are paid 50% from amenity rates (from<br />
Hanmer Springs Ward ratepayers) and 50% funded as part of<br />
the cost of Governance through the Governance Rate, which<br />
is a <strong>District</strong> Wide Rate. The members, current remuneration is<br />
shown in table 1.<br />
The <strong>Community</strong> Board works for the Hanmer Springs Ward<br />
residents and ratepayers. Consequently, we think it appropriate<br />
that all of their remuneration is paid through local amenity<br />
rates from Hanmer Springs ratepayers, rather than a portion<br />
coming from the <strong>District</strong> Wide Rate. We have four Ward or<br />
<strong>Community</strong> Committees set up in other Wards that operate in<br />
a similar way to a <strong>Community</strong> Board, with similar delegations,<br />
but members are not paid. Therefore, we have decided that the<br />
Hanmer Springs community will fund the total remuneration<br />
for the <strong>Community</strong> Board. Based on the current level of<br />
remuneration paid to the <strong>Community</strong> Board Members, the total<br />
cost to the Hanmer Springs Amenities Rates will be $23,178 per<br />
annum commencing from <strong>2012</strong>/13.<br />
Security of Access to Hanmer Forest Tracks<br />
The Hanmer Forest is a significant tourism asset to the district.<br />
It is estimated that 70% of visitors to the Hanmer Springs<br />
Thermal Pools and Spa (approximately 511,000 people) visit the<br />
forest each year. Public access to the forest has been provided<br />
for since the early 1900s resulting in the development of an<br />
extensive recreational track network. Legal public access to the<br />
forest was lost when ownership of the land was transferred to<br />
Ngai Tahu. The continuance of the current informal public access<br />
depends on the goodwill of the Iwi and the forest leaseholder.<br />
The Hanmer Forest covers 9212 hectares in area and is<br />
comprised of native forest, exotic production and research<br />
forests, and public parks and reserves. The forest adjoins the<br />
Hanmer Springs urban boundary and extends north to the<br />
Hanmer Range ridgeline, Mt Isobel, Jollies Pass and Jacks Pass;<br />
east to Boundary Stream; south to the Hanmer River; and west<br />
to the Rogerson River catchment and Mt Tabletop.<br />
Ngai Tahu Forest Estates Ltd are the largest landowner at nearly<br />
55%, the Department of Conservation (DOC) manages 45%,<br />
and HDC less than 1%. Although the minor landowner, the HDC<br />
land provides critical linkages from the Hanmer Springs village<br />
via Conical Hill and the 22ha Dog Stream/Brooke Dawson/<br />
Tarndale reserves adjacent to the forest.<br />
There has been some community concern that access to the<br />
Ngai Tahu land can be closed at any time by the landowner.<br />
However, Ngai Tahu have expressed their commitment to<br />
Hanmer Springs and agree how important the tracks are. They<br />
have indicated that they want to be part of future development<br />
18
<strong>Hurunui</strong> <strong>Community</strong> <strong>Long</strong> <strong>Term</strong> <strong>Plan</strong> <strong>2012</strong> - <strong>2022</strong><br />
of the township and future planning for the <strong>Hurunui</strong> district, and<br />
are prepared to work with us over the forest’s long term use. A<br />
number of submissions were received on this matter supporting<br />
our intention to work toward securing long term use to the<br />
forest. A representative group of <strong>Council</strong>lors has been identified<br />
to progress further discussion with the owners of the forest to<br />
find a way forward. No funding has been allocated.<br />
Table 1: <strong>Community</strong> Board Members Remuneration<br />
Position<br />
Remuneration<br />
Chair of the <strong>Community</strong> Board<br />
$7,902 pa<br />
Other Members (each)<br />
$3,819 pa<br />
Table 2: Funding the Key Issues<br />
Issue Cost Method of Funding Commencement<br />
Drinking Water Standards<br />
$14,000,000 Capex<br />
$484,000 Opex<br />
<strong>District</strong> Wide 2015/16<br />
Miox & new water treatment $758,000 Targeted to Dwellings affected <strong>2012</strong>/13<br />
Hanmer Springs Sewer Improvements $220,000<br />
$1,288,560<br />
Hanmer Springs Sewer Rate <strong>2012</strong>/13<br />
2015/16<br />
Targeted Tourism Rate $286,000 Targeted Tourism Rate on-going<br />
Insurance $550,000 Spread across organisation <strong>2012</strong>/13<br />
Earthquake Strengthening $71,162 <strong>District</strong> Wide Rates <strong>2012</strong> - 2015<br />
RMA/Court Action $105,000 <strong>District</strong> Wide Rates <strong>2012</strong>/13<br />
Cheviot Library/Service Centre $100,000 <strong>District</strong> Wide funding <strong>2012</strong>/13<br />
Cheviot Medical Centre $1,150,700 Cheviot Medical Centre Rates 2016/17<br />
Hanmer Springs Sport Stadium $1,077,379 Amenity Rates and<br />
Development Contributions<br />
2015/16<br />
Hanmer Springs <strong>Community</strong> Hall Extension $194,400 Hanmer Springs Amenity Rate 2014/15<br />
Rotherham Public Toilet $90,000 <strong>District</strong> Wide funding for<br />
Public Toilets<br />
2017/18<br />
Hanmer Springs <strong>Community</strong> Board<br />
$23,178 Hanmer Springs Amenity Rate <strong>2012</strong>/13<br />
Amberley Swimming Pool<br />
$0 No budget allocated yet<br />
19
www.hurunui.govt.nz<br />
Financial Strategy<br />
Executive Summary<br />
Core Principles<br />
In reviewing the <strong>Long</strong> <strong>Term</strong> <strong>Plan</strong> (LTP), we revised our core<br />
principles and these have been used as the basis in developing<br />
our Financial Strategy. These principles are:<br />
• Focus on core services<br />
• Financial responsibility and affordability<br />
• Continuous improvement in service to everyone in our<br />
district<br />
• Facilitate appropriate growth in the district<br />
• Maximise Thermal Pools and Spa profit<br />
Key Factors in our Financial Strategy<br />
Within the context of our core principals, the following have<br />
been identified as the key factors that shape the Financial<br />
Strategy over the life of the <strong>Long</strong> <strong>Term</strong> <strong>Plan</strong>:<br />
• We want to ensure that our services remain affordable<br />
• We want to maintain or improve our current levels of<br />
service<br />
• Our key funding mechanisms are:<br />
a Rates, both <strong>District</strong> Wide and Targeted rates<br />
b Surpluses derived from the Hanmer Springs<br />
Thermal Pools and Spa<br />
c The use of the Internal Financing structure which<br />
provides internal loans for communities requiring<br />
funding and also an avenue for communities to build<br />
up funds to meet funding requirements in the future<br />
In taking care to ensure that our services remain affordable,<br />
we have had modest rate increases over the past three years.<br />
However, due to various factors facing us, particularly the<br />
increased cost of insurance and compliance with drinking water<br />
standards, rates will increase at levels well above what was<br />
anticipated when the 2009-2019 LTP was prepared. (Refer to<br />
the Key Issues section).<br />
We are carefully monitoring our levels of service for roads<br />
due to reduced government subsidies (refer to Key Issues<br />
section). With the exception of roading, we intend to maintain<br />
our levels of service in most areas. With regards to improving<br />
drinking water levels, treatment of sewage and developing some<br />
community facilities, we will be in a position to improve the<br />
levels of service that we are currently providing. We also aim<br />
for continuous improvement to our customer service.<br />
We continually review funding options available. The use of<br />
the internal financing structure allows communities to carry<br />
out required capital expenditure and manage the cost of those<br />
works over a longer period. As a result, this smoothes out the<br />
rating impact and allows communities to start setting aside<br />
funds to meet the capital projects for the future.<br />
The Hanmer Springs Thermal Pools and Spa is a successful<br />
<strong>Council</strong> owned business and we proactively use the profits to<br />
offset costs relating to the reserves in the <strong>District</strong> which results<br />
in lessening the rating burden. For the first three years of the<br />
<strong>Long</strong> <strong>Term</strong> <strong>Plan</strong> the <strong>Council</strong> is funding more reserve based costs<br />
than it is earning from the surpluses from the Hanmer Springs<br />
Thermal Pools & Spa and by doing so, is utilising some of the<br />
reserve balance that has been generated by the surpluses in<br />
the past.<br />
Our Financial Position at the Start of the LTP<br />
Period<br />
Our financial position at the start of the <strong>Long</strong> <strong>Term</strong> <strong>Plan</strong> period<br />
is set out in the 2011/<strong>2012</strong> Annual <strong>Plan</strong> which shows:<br />
• The total rates were set at $12.8 million; of which $5.3<br />
million are in <strong>District</strong> Wide rates and $7.5 million are<br />
in targeted rates.<br />
• Total income from non-rate sources was $16.9 million,<br />
which includes $9.6 million in gross revenue derived<br />
from the Hanmer Springs Thermal Pools and Spa.<br />
• Total Operating Expenditure is forecast at $23.5 million<br />
and Capital expenditure for the 2011/<strong>2012</strong> year is<br />
expected to be $9.2 million (which includes a level of<br />
Capital that has been carried over from the 2010/2011<br />
year).<br />
• External Debt was expected to be $13.5 million at<br />
the end of June <strong>2012</strong>; however, the forecast has been<br />
reduced to $12.5 million due to deferring some projects<br />
as part of the LTP budget preparation.<br />
• Internal Financed Debt is expected to total $16.6<br />
million as at 30 June <strong>2012</strong>.<br />
• Total Assets as at 30 June 2011 was $335 million, of<br />
which $253 million related to our infrastructure.<br />
Our Financial Position at the End of the LTP Period<br />
As at the end of June <strong>2022</strong>, the key components of our financial<br />
position are forecast as follows:<br />
• Total rates revenue will increase by 55% over the ten<br />
years to reach $19.9 million in the 2021/<strong>2022</strong> year.<br />
• Total income from non-rate sources will be $22.3<br />
million (including $13.8 million in gross revenue derived<br />
from the Hanmer Springs Thermal Pools and Spa).<br />
• Total Operating Expenditure will be set at $39.6 million.<br />
• Capital expenditure over the ten years will amount to<br />
$77.3 million with the amount expected to be required<br />
in the 2021/<strong>2022</strong> year at $7.7 million.<br />
• External Debt will peak at $22.5 million in the 2015/2016<br />
and 2016/2017 years, but will reduce to $12 million by<br />
June <strong>2022</strong>.<br />
20
<strong>Hurunui</strong> <strong>Community</strong> <strong>Long</strong> <strong>Term</strong> <strong>Plan</strong> <strong>2012</strong> - <strong>2022</strong><br />
• Total Assets as at 30 June <strong>2022</strong> is expected to reach<br />
$494 million.<br />
Rates, Increases and Limits<br />
The overall rates increases for the next three years are as<br />
follows:<br />
• In <strong>2012</strong>/2013, the increase is 5.83% (this is one of the<br />
largest increases required for some years and is primarily<br />
due to factors outlined earlier such as insurance and<br />
drinking water, and funding some significant capital<br />
expenditure projects over the last few years).<br />
• In 2013/2014, the increase is 5.77%<br />
• In 2014/2015, the increase is 5.37%<br />
The Local Government Act now requires <strong>Council</strong>s to set limits<br />
on rate increases. Because a simple inflation target as the basis<br />
for setting a rate increase limit does not reflect the forecast<br />
costs that will be imposed on us, we have opted to set the<br />
rates increase limits at 2% above the forecast increases. As a<br />
result, the limit for the 2013/2014 year will be 7.77% and for the<br />
2014/2015 year, the limit will be 7.37%<br />
Because of our rating structure, the overall increase in rates<br />
will not be consistent for each property throughout the district.<br />
It will depend on the targeted rates that are charged to that<br />
particular property and also the capital value of the property.<br />
External Debt and Limits<br />
1. The Local Government Act also requires us to set a limit on<br />
our external debt levels. These debt levels are set out in our<br />
External Liability Management policy on page 222 and the<br />
limits are based on ratios centred on the level of income.<br />
These ratios are considered standard for the sector and the<br />
maximum debt is set at 100% of our Total Income and 10%<br />
of our Total Equity. This means that for the <strong>2012</strong>/2013 year,<br />
where total income is forecast at $30.3 million and Total<br />
Equity forecast at $341.7 million, that the maximum level of<br />
debt is $30.3 million. For <strong>2012</strong>/2013, the anticipated level<br />
of debt is $18.5 million. We plan to be well within prudent<br />
limits for the period of the plan.<br />
Implications of the <strong>Council</strong>’s Financial Strategy<br />
The Local Government Act requires us to assess whether we<br />
have the ability to provide and maintain existing levels of services<br />
and meet additional demands for services within the rates and<br />
debt limits as set out within the financial strategy.<br />
We face potential issues in the future regarding the level of<br />
funding for roading expected from the New Zealand Transport<br />
Agency (NZTA). We estimate that there is a $15 million<br />
difference over the ten year period of the LTP between what<br />
our Asset Management <strong>Plan</strong>s tell us is needed to maintain our<br />
roading network and what we have built into this draft LTP<br />
taking into account the NZTA funding. (See the Roads and<br />
Footpaths Activity section on page 89).<br />
We are not contemplating taking on debt greater than $22.5<br />
million and the maximum amount of interest expected to be<br />
charged on the external debt is budgeted at less than $1.3<br />
million. Therefore, with the exception of the Roading Network<br />
due to circumstances outlined earlier, we believe we have the<br />
ability to maintain existing target levels of service and to meet<br />
additional demands for service within those debt limits.<br />
Core Principles<br />
Our revised core principles have provided the base in developing<br />
our Financial Strategy for this LTP. These are further explained<br />
in this section.<br />
1. Focus on Core Services<br />
The focus on core services is consistent with the intent of the<br />
Local Government Act. As a rural district, our focus has always<br />
been on key infrastructure – roading, water and sewerage. Since<br />
2008 after sever flood events, we have undertaken significant<br />
work to improve our stormwater and drainage assets. While<br />
community services and facilities (eg: halls, libraries, public<br />
toilets, reserves etc), may not be seen as essential services, they<br />
do form an important part of the community infrastructure.<br />
We have undertaken significant community projects in the last<br />
three years including the town centre upgrades in both Hanmer<br />
Springs and Amberley, as well as constructing a new Medical<br />
Centre in Rotherham.<br />
2. Financial Responsibility and Affordability<br />
Affordability of rates was a key aspect in the preparation of the<br />
2009-2019 LTP and in that respect; we managed to maintain<br />
modest increases in the rates over the subsequent three year<br />
period. In preparing the <strong>2012</strong>/22 LTP, affordability is still an<br />
important factor as well as spending responsibly to minimise<br />
rate increases. Costs do increase and we are ever mindful of the<br />
need to ensure that these costs are appropriately funded, while<br />
ensuring our debt levels remain manageable.<br />
3. Continuous Improvement in Service to Everyone<br />
in Our <strong>District</strong><br />
In the context of affordability, we aim to improve our customer<br />
service to everyone who needs our services. This includes<br />
our residents and ratepayers, as well as visitors to our district.<br />
Our annual resident satisfaction survey provides us with good<br />
information to gauge how we are doing and where to improve.<br />
Whereas actual levels of service in most cases are intended on<br />
being maintained, our aim for continuous improvement relates<br />
21
www.hurunui.govt.nz<br />
to getting the best out of our contracts for service, having<br />
helpful friendly staff, being responsive to complaints and service<br />
requests by getting back to customers quickly, etc. Regarding<br />
actual levels of service, these are discussed under the ‘Key<br />
Factors for Our Financial Strategy’ part of this section.<br />
4. Facilitate Appropriate Growth in the <strong>District</strong><br />
We want our district to continue to grow and that not only will<br />
more people want to live in the <strong>Hurunui</strong>, but that those who are<br />
here already, will want to stay. Growth in our population helps<br />
spread rates across a wider number of ratepayers and helps to<br />
retain key services, such as medical services, schools and shops,<br />
etc.<br />
We are mindful that growth needs to be sympathetic toward<br />
the environment and the district’s rural values which is why<br />
we talk about “appropriate growth”. Accordingly, we need to<br />
ensure that our planning rules (as we review our <strong>District</strong> <strong>Plan</strong>)<br />
do meet the objectives of the <strong>District</strong> as a whole.<br />
5. Maximise Thermal Pools Profit<br />
We are in the envious position of owning one of New Zealand’s<br />
key tourist facilities - the Hanmer Springs Thermal Pools and<br />
Spa (HSTP&S). The success of the HSTP&S has had a flow on<br />
effect to other businesses that service the tourist industry. The<br />
HSTP&S is sited on a reserve vested to the <strong>Hurunui</strong> <strong>District</strong><br />
<strong>Council</strong> in accordance with the Reserves Act. Because of this,<br />
we are able to use the profits from the HSTP&S to fund other<br />
reserves that we administer. This includes the <strong>Hurunui</strong> Memorial<br />
Library (also known as the “<strong>District</strong> Library”), the public toilets<br />
and cemeteries throughout the district, as well as a wide range<br />
of recreational reserves. This is a particular point of difference<br />
from other Local Authorities in New Zealand who will generally<br />
have to fund these types of functions through rates.<br />
Key Factors for our Financial Strategy<br />
Within the context of our core principals, we have identified the<br />
following key factors that shape our Financial Strategy over the<br />
life of this LTP:<br />
• We want to ensure that our services remain affordable<br />
• We want to maintain or improve our current levels of<br />
service<br />
Our key funding mechanisms are:<br />
a. Rates, both <strong>District</strong> Wide and Targeted rates<br />
b. Surpluses derived from the Hanmer Springs Thermal<br />
Pools and Spa<br />
c. The use of the Internal Financing structure which<br />
provides internal loans for communities requiring funding<br />
and also an avenue for communities to build up funds to<br />
meet funding requirements in the future<br />
We Want to Ensure that Our Services Remain<br />
Affordable<br />
The concept of affordability is one of our core principles. Our<br />
modest overall rate increases in the past three years have been:<br />
• 2009/2010 - 4.20%<br />
• 2010/2011 - 3.04%<br />
• 2011/<strong>2012</strong> - 3.60%<br />
We considered all of these increases to be affordable and<br />
deemed that, the community agreed going by their submissions<br />
when we consulted the public on these. However, there are<br />
various factors facing us that will require us to increase rates<br />
at levels well above what we anticipated when we prepared the<br />
last LTP (the 2009-2019).<br />
As outlined in the Mayor and CEO’s introduction we are<br />
experiencing the on-going financial impact of the Canterbury<br />
Earthquakes. In particular, there has been a significant increase<br />
in the cost of insurance for everyone. While the increase is large<br />
and affects the overall rates increases, we consider it necessary<br />
and responsible to insure our keys assets.<br />
Meeting drinking water compliance is a costly issue (see the Key<br />
Issues section). We consider the cost of complying with the<br />
standards to be unaffordable to communities on the individual<br />
water supplies affected. Because of that, we have developed<br />
a two stage approach where we will aim for Ecoli compliance<br />
immediately and start to build a fund to meet some of the cost of<br />
the full compliance in later years. The rationale of this approach<br />
is to ensure we are in a position to meet our obligations in an<br />
affordable manner.<br />
Whereas we are intending on maintaining our current levels of<br />
service for roading over the next three year period, our ability<br />
to do so in future years may be challenging. The ongoing impact<br />
of receiving less NZTA funding than we had earlier anticipated in<br />
our Asset Management <strong>Plan</strong>s will eventually have a detrimental<br />
effect on our levels of service unless more rates are collected.<br />
The issue we will likely be facing in our next <strong>Long</strong> <strong>Term</strong> <strong>Plan</strong>, will<br />
be affordability versus levels of service.<br />
We Want to Maintain or Improve Our Current<br />
Levels of Service<br />
With the exception of roading as outlined above, we are<br />
committed to maintaining our levels of service. In some areas,<br />
we intend to increase the levels of service, through:<br />
• Complying with the increased Drinking Water Standards<br />
• Improving the treatment of sewage in Hanmer Springs<br />
• Employing an engineer dedicated to stormwater<br />
management throughout the <strong>District</strong><br />
• Building new or upgraded facilities, such as:<br />
• upgrading the Hanmer Springs Domain<br />
22
<strong>Hurunui</strong> <strong>Community</strong> <strong>Long</strong> <strong>Term</strong> <strong>Plan</strong> <strong>2012</strong> - <strong>2022</strong><br />
• upgrading or building a new Medical Centre in<br />
Cheviot<br />
• Improving our customer service (within existing<br />
budgets)<br />
Each of these will be funded through rates or other mechanisms<br />
such as the use of the internal loans or development<br />
contributions, to ensure that the rates increases imposed are<br />
kept to an affordable level.<br />
The Use of Our Key Funding Arms<br />
We have three key arms to our funding structure to meet the<br />
operating and capital expenditure planned for the period of the<br />
LTP.<br />
1. Rates<br />
Under the Local Government (Rating) Act 2002, we have<br />
the ability to set rates to fund the activities we undertake.<br />
The way we set our rates is set out in the Funding Impact<br />
Statement and Rates System section.<br />
This Financial Strategy also sets out requirements for us to<br />
place limits on rate increases and this is discussed further<br />
below.<br />
2. Surpluses Derived From the Hanmer Springs Thermal Pools<br />
& Spa<br />
As outlined in the Core Principles above, we operate the<br />
HSTP&S complex on a reserve that has been vested to the<br />
<strong>Council</strong> under the Reserve Act.<br />
Over the past decade, the operation of the HSTP&S complex<br />
has been extremely successful and we constantly consider<br />
how to maximise the profits generated. December 2010 saw<br />
the completion of a $7.5 million expansion of the complex,<br />
which provided a wider range of facilities and has proved to<br />
be an outstanding success. We are aware that as a tourist<br />
destination, the HSTP&S need to be in top condition and<br />
refreshed if we are to maintain our place in the tourism<br />
market. Because of this, and the ability for the profits from<br />
the complex to fund it, further capital projects are planned for<br />
the ten year period of this LTP.<br />
The use of the HSTP&S surpluses is a key funding option<br />
available to meet the costs of our reserves throughout the<br />
district. The plan estimates that a total of $24 million will be<br />
used from the surpluses derived from the HSTP&S to offset<br />
these costs. For the first three years of the <strong>Long</strong> <strong>Term</strong> <strong>Plan</strong>, the<br />
council is forecasting to spend more on reserve based costs<br />
than it is earning from the surplus of the Hannmer Springs<br />
Thermal Pools & Spa, however, the <strong>Council</strong> is comfortable<br />
with utilising some of the existing reserve balance to fund this.<br />
3. Internal Financing Structure<br />
We developed an internal financing structure to provide a<br />
consistent approach to funding capital expenditure across<br />
the organisation. Because we do not build up depreciation<br />
reserves, this system is important to enable communities<br />
to access funding to undertake capital expenditure projects<br />
rather than being required to fund such project through other<br />
sources, such as rates. Our Internal Financing Policy is fully<br />
discussed on page 268.<br />
The structure is based on individual activities essentially<br />
holding its own bank account. Income (rates, development<br />
contributions, etc.) are deposited into the account and<br />
expenditure, both operating and capital, is withdrawn from<br />
the account. Like other bank accounts, the account can be in<br />
funds or overdrawn. When the balance is in funds, we pay an<br />
amount of interest and if the balance is overdrawn, then that<br />
activity pay interest to us.<br />
The result is that communities are able to undertake capital<br />
expenditure projects by allowing the capital balance to go into<br />
overdraft. This allows those communities to spread the cost<br />
of required capital work over a period of time, rather than<br />
having to fund it entirely in the year that it is incurred, by<br />
setting rates to cover an amount of debt repayment every<br />
year.<br />
The internal financing structure also allows communities to<br />
start building up funds by budgeting to continue to set rates at<br />
a higher level than required to meet all operating costs, even<br />
if there is no debt. This will mean that the excess operating<br />
income will be held for that community to meet capital<br />
expenditure requirements in the future. The benefit to those<br />
communities in this position is that we pay interest to those<br />
communities, which further increases their account balances.<br />
The key benefit from the use of the internal financing structure<br />
and building up fund is that it avoids large increases in rates<br />
as it allowed the <strong>Council</strong> and the individual communities to<br />
smooth the rating effect of large capital projects.<br />
The anticipated level of internally financed debt at as 1 July<br />
<strong>2012</strong> is $16.6 million. The balances over the ten year period<br />
are further disclosed in the Reserve Funds section of the LTP .<br />
23
www.hurunui.govt.nz<br />
Financial Position<br />
Financial Position as at <strong>2012</strong><br />
Our financial position at the start of the LTP period is set out in<br />
the 2011/<strong>2012</strong> Annual <strong>Plan</strong> shown below:<br />
• The total rates were set at $12.8 million; of which $5.3<br />
million are in <strong>District</strong> Wide rates and $7.5 million are in<br />
targeted rates.<br />
• Total income from non-rate sources was $16.9 million,<br />
which includes $9.6 million in gross revenue derived from<br />
the Hanmer Springs Thermal Pools and Spa.<br />
• Total Operating Expenditure is forecast at $23.5 million<br />
and Capital expenditure for the 2011/<strong>2012</strong> year is<br />
expected to be $9.2 million (which includes a level of<br />
Capital that has been carried over from the 2010/2011<br />
year).<br />
• External Debt was expected to be $13.5 million at the<br />
end of June <strong>2012</strong>; however, the forecast has been reduced<br />
to $12.5 million due to deferring some projects as part of<br />
the LTP budget preparation.<br />
• Internal Debt is expected to total $16.6 million as at 30<br />
June <strong>2012</strong>.<br />
• Total Assets as at 30 June 2011 was $335 million, of which<br />
$253 million related to our infrastructure.<br />
The Relevance of the Current Financial Situation<br />
to the Financial Strategy<br />
• The current financial situation is relevant to the<br />
financial strategy as it provides the starting point for the<br />
development of the budgets for the LTP.<br />
• There have been relatively low levels of rate increases for<br />
the past three years.<br />
• We took on debt for the first time in September 2010,<br />
principally to provide funding for the $7.5 million<br />
expansion of the Hanmer Springs Thermal Pools and Spa,<br />
but there was already a need to obtain external debt to<br />
fund the following keys projects over the preceding years:<br />
• Town Centre Development in Hanmer Springs ($1.9<br />
million) and Amberley ($560,000)<br />
• Water Upgrades in Amberley ($714,000), Cheviot<br />
($658,000) and Hanmer Springs ($788,000).<br />
• Sewer Upgrades for Amberley ($2 million) and<br />
Hanmer Springs ($1.8 million)<br />
• Capital Expenditure to address the Drainage issues in<br />
the Amberley Ward ($890,000).<br />
• New Medical Centre in Hanmer Springs ($450,000)<br />
and Rotherham ($1 million)<br />
• As a result, there have been a number of large projects that<br />
have been funded through the internal financing policy and<br />
the requirement for those communities to start to repay<br />
the debt through rates to replenish our cash reserves.<br />
Until then, we will continue to hold debt for the period<br />
of the LTP.<br />
• The financial performance of the Hanmer Springs Thermal<br />
Pools and Spa remains critical to our ability to keep rates<br />
at an affordable level. The surpluses derived from the<br />
HSTP&S is actively used to fund various costs relating to<br />
reserves throughout the district. If we did not have the<br />
surpluses to offset these costs, then they would need to be<br />
rated for. In addition, and under the terms of the Internal<br />
Financing Policy, we receive interest from the HSTP&S<br />
for funds lent to it for the recent expansion works. This<br />
interest received is used to offset the costs of our external<br />
debt and to offset the <strong>District</strong> Wide Rates. The <strong>Council</strong> is<br />
forecasting to spend more on reserve based costs than it<br />
is forecast to earn from the surpluses derived from the<br />
Hanmer Springs Thermal Pools & Spa for the first three<br />
years of the <strong>Long</strong> <strong>Term</strong> <strong>Plan</strong>. To fund this the <strong>Council</strong> will<br />
utilise existing reserves.<br />
Forecast Financial Position as at <strong>2022</strong><br />
At the end of the LTP period, our position is forecast as follows:<br />
• Total rates revenue of $19.9 million; of which $8.0 million<br />
are in <strong>District</strong> Wide rates and $11.9 million are in targeted<br />
rates.<br />
• Total income from non-rate sources is expected to<br />
be $22.3 million, which includes $13.8 million in gross<br />
revenue derived from the HSTP&S.<br />
• Total Operating Expenditure is forecast at $39.6 million<br />
and Capital Expenditure for the 2021/<strong>2022</strong> year is<br />
expected to be $7.7 million.<br />
• External Debt was expected to reduce to $12 million at<br />
the end of June <strong>2022</strong>.<br />
• Internal Debt will reduce to $15 million by the end of<br />
June <strong>2022</strong>.<br />
• Total Assets as at 30 June <strong>2022</strong> is forecast to be $493<br />
million, of which an estimated $393 million relates to<br />
infrastructure.<br />
Key Movements Over the Ten Year Period<br />
Rates – Over the ten year period, we are forecasting to<br />
receive a total of $167 million in Rates. This is broken down to<br />
$69million in <strong>District</strong> Wide Rates and $98 million in Targeted<br />
Rates. To achieve the total increase of 55% since the 2011/<strong>2012</strong>,<br />
we intend to take incremental steps over the ten year period,<br />
however with a relatively large increase of 5.83% required for<br />
the <strong>2012</strong>/2013 year.<br />
Non-Rate Income – Excluding gains in asset valuation and vested<br />
assets, we are forecasting that a total of $191 million will be<br />
received from other forms of income. Roading Subsidies make<br />
up $38 million over the period, Development Contributions are<br />
forecast at $4.3 million and the gross revenues from the HSTP&S<br />
are forecast at $115 million. In addition, we are expected to<br />
receive $3.4 million from Forestry Sales, which is used directly<br />
to reduce debt.<br />
Operating Deficits - Due to <strong>Council</strong> spending more on reserve<br />
based costs than it is forecast to earn from the surpluses from<br />
the Hanmer Springs Thermal Pools & Spa, for the first three<br />
24
<strong>Hurunui</strong> <strong>Community</strong> <strong>Long</strong> <strong>Term</strong> <strong>Plan</strong> <strong>2012</strong> - <strong>2022</strong><br />
years of the <strong>Long</strong> <strong>Term</strong> <strong>Plan</strong>, the <strong>Council</strong> will record small<br />
operating deficits. These will be funded by existing reserves<br />
built up by surpluses generated by the Hanmer Springs Thermal<br />
Pools & Spa in the past.<br />
Operating Expenditure – Total Operating Expenditure is<br />
expected to be $351 million over the ten years. The total<br />
increase from the 2011/<strong>2012</strong> year is expected to be 38% over<br />
the ten years and average of less than 4% per annum.<br />
Capital Expenditure – Over the ten year period, we are<br />
forecasting to spend a total of $77 million on Capital<br />
Expenditure. $6.3 million is scheduled to fund projects required<br />
due to growth, further $14.7 million relates to projects that will<br />
assist in improving the levels of services we provide and the<br />
remaining $56.2 million will be used to replace existing assets<br />
when they reach the end of their useful lives.<br />
This information is particularly relevant in determining<br />
growth projections for the period and was also used for the<br />
Development Contributions methodology. We have opted for<br />
the medium growth projections for the ten year period. On this<br />
basis, we have assumed that there will be approximately 17%<br />
growth over the ten year period. The increase predicted for<br />
Hanmer Springs is approximately 21%. With Hanmer Springs<br />
being a tourist town, the growth in new sections and buildings is<br />
not always consistent with an increase in population due to the<br />
higher percentage of non-resident ratepayers who may own a<br />
holiday home rather than a permanent residence.<br />
The following graph shows the movements in the population<br />
of each township in the <strong>District</strong> over the period from 1991 to<br />
2006:<br />
External Debt – This is scheduled to increase from the $13.5<br />
as schedule in the 2011/<strong>2012</strong> Annual <strong>Plan</strong> to reach a maximum<br />
of $22.5 million in the between July 2015 and June 2017. With<br />
communities required to repay certain levels of debt each year<br />
and some communities starting to build up funds to carry out<br />
capital expenditure in the future, we are forecasting that the<br />
external debt will reduce to $12 million by the end of June <strong>2022</strong>.<br />
Internal Debt – With communities repaying debt and building<br />
up funds, the movements in the internal debt levels move from<br />
$16.6 million in <strong>2012</strong> down to $15 million in <strong>2022</strong>.<br />
Assets – It is expected that the value of our assets will be $493<br />
million as at 30 June <strong>2022</strong>. This increase of $165 million has been<br />
brought about by the level of Capital expenditure to be incurred<br />
over the ten years, but also due to the fact that the assets are<br />
required to be revalued on a regular basis. It is forecast that the<br />
increase in the asset values will account for $147 million of the<br />
increase over the ten years.<br />
Population Changes<br />
The LTP has been prepared on the basis that the population<br />
will continue to grow. Due to the effect of the Canterbury<br />
Earthquakes, the 2011 Census was cancelled. Therefore, we<br />
have used the population projections from the 2006 Census<br />
to forecast population changes for the period of the LTP.<br />
The following graph shows the population projection for the<br />
<strong>Hurunui</strong> <strong>District</strong> over the next 20 year period.<br />
It is acknowledged that the population of the <strong>Hurunui</strong> is older<br />
than the national average. This presents issues around ensuring<br />
there are appropriate facilities and services for older people.<br />
We committed to providing buildings for medical centres to<br />
ensure that health services are adequately provided to the<br />
community. The following graph (using the 2006 Census data)<br />
shows the age distribution for the <strong>Hurunui</strong> in comparison with<br />
Canterbury and New Zealand:<br />
25
www.hurunui.govt.nz<br />
Capital and Operating Costs of Providing for<br />
Changes in Population<br />
In response to the demands of increasing population, we have<br />
identified key projects proposed to respond to the anticipated<br />
growth. These are further discussed in the Development<br />
Contributions Policy but include the following:<br />
1. Water supplies upgrades undertaken on Amberley,<br />
Ashley Rural, Cheviot, Hanmer Springs and <strong>Hurunui</strong><br />
Rural water supplies which built in capacity to ensure<br />
both existing ratepayers and future ratepayers are<br />
serviced.<br />
2. Sewerage systems have had capacity built into upgrade<br />
work on ponds in both Amberley and Hanmer Springs<br />
to allow for future growth. In addition, provision has<br />
been made to allow for new areas to be reticulated in<br />
Amberley.<br />
3. Upgrades to both the Amberley Domain Pavilion and<br />
the Hanmer Springs Hall have been undertaken to<br />
provide additional facilities for both existing and future<br />
ratepayers.<br />
4. Provision has been made to develop new and upgrade<br />
existing reserves to cater for increased population.<br />
5. Stormwater provision to be factored in the development<br />
of new areas in Amberley and Hanmer Springs.<br />
Changes in Land Use<br />
The <strong>Hurunui</strong> <strong>District</strong> has historically been an agriculture based<br />
district, primarily beef and sheep. Over the past ten years, there<br />
have been marked changes to the use of land throughout the<br />
<strong>District</strong>.<br />
The growth in tourism, especially Hanmer Springs and centred<br />
around the development of the HSTP&S, has resulted in<br />
increased number of accommodation providers and other<br />
businesses associated with tourism, as well as more holiday<br />
homes.<br />
For a period, there was significant growth in viticulture, in<br />
particular in the Waipara area, which provides ideal conditions<br />
from growing premium quality grapes. The Amuri Basin has<br />
seen a significant increase in the number of dairy farms and that<br />
trend is likely to increase if access to further irrigation water<br />
can be secured.<br />
The Glenmark area has had two major wind farm applications –<br />
one from Mainpower and the other from Meridian Energy.<br />
The following pie chart shows the current land use of properties<br />
in the <strong>Hurunui</strong> <strong>District</strong> as at September 2010 (the date of the<br />
last <strong>District</strong> revaluation):<br />
Capital and Operating Costs of Providing for<br />
Changes in Land Use<br />
Because of the uncertainty of the changes in land use, no specific<br />
allowance has been made for changes to capital or operational<br />
costs to allow for this.<br />
Key Levels of Service<br />
Capital Expenditure Programme<br />
Capital expenditure requirements for our infrastructural assets<br />
and roads are dictated by the levels outlined in the Asset<br />
Management <strong>Plan</strong>s (AMPs) for each activity. The AMPs are<br />
updated on a regular basis to ensure that various changes to the<br />
plan in the interim period are accounted for.<br />
As discussed in the Key Issues section, we face potential issues<br />
in the future regarding the level of funding that is expected to<br />
be provided for roading from the NZTA. Our AMP for Roading<br />
sets out what level of expenditure we have forecast to meet the<br />
current levels of service. Since the AMP was adopted, there was<br />
a change to the level of expenditure that the NZTA is prepared<br />
to fund and this means that the expenditure allowed for in the<br />
LTP budgets are significantly short of what was provided for in<br />
the AMP. The AMP was developed prior to the change in central<br />
government policy and before we were able to achieve greater<br />
efficiencies through our current road maintenance contracts.<br />
The difference over the ten years between what was scheduled<br />
in the AMP and what has been provided in the LTP amounts to<br />
a total of $18 million. Through achieving greater efficiencies in<br />
the current roading contracts, we are planning on delivering the<br />
same levels of service for the next three year period. In future<br />
years, our ability to meet the same levels of service may not be<br />
achieved without increasing rates.<br />
26
<strong>Hurunui</strong> <strong>Community</strong> <strong>Long</strong> <strong>Term</strong> <strong>Plan</strong> <strong>2012</strong> - <strong>2022</strong><br />
In general, Capital Expenditure is broken down to three key<br />
categories:<br />
1. Capital expenditure relating to meeting the existing<br />
levels of service. This will be principally replacement of<br />
the existing assets<br />
2. Capital expenditure aimed at improving the current<br />
levels of service<br />
3. Capital expenditure on assets required due to growth.<br />
Some items of Capital Expenditure may actually fall into more<br />
than one category. For example, the replacement of a length of<br />
water pipe is required to provide water to existing consumers,<br />
but the diameter of that length of pipe may be increased from<br />
its existing diameter to allow for greater capacity in the future.<br />
An assessment is carried out as to apportion the cost of each<br />
project to the category to which it relates and if that cannot<br />
be readily assessed, the category will be determine by the key<br />
reason for the work to be undertaken.<br />
Over the period of the LTP, we have budgeted $77 million to<br />
spend on Capital expenditure. Of this balance, $56.2 million<br />
related to maintaining the existing levels of service by providing<br />
for replacement of current assets. A further $14.7 million<br />
is aimed at making improvements to the level of service and<br />
the balance of $6.3 million relates to projects scheduled due<br />
to growth. The following graph shows the percentages of the<br />
Capital Programme that relate to each category.<br />
100%<br />
90%<br />
80%<br />
70%<br />
60%<br />
50%<br />
40%<br />
30%<br />
20%<br />
10%<br />
0%<br />
Growth Related<br />
Improved Levels of Service<br />
Renewals<br />
The key area of capital expenditure is relating to the infrastructural<br />
assets. Of the total Capital Expenditure programme for the<br />
ten years of $77 million; $43.5 million relates to Roads and<br />
Footpaths; $10.1 million relates to Water Supplies and $3.8<br />
million relates to Sewerage Schemes. The following graph shows<br />
the split of the Capital Expenditure programme to each of the<br />
ten Groups of Activities for the ten year period.<br />
12,000,000<br />
10,000,000<br />
8,000,000<br />
6,000,000<br />
4,000,000<br />
2,000,000<br />
-<br />
Corporate Services<br />
Governance<br />
Hanmer Springs Thermal Pools and Spa<br />
Growth and Development<br />
Environment and Safety<br />
<strong>Community</strong> Services and Facilities<br />
Roads and Footpaths<br />
Stormwater and Drainage<br />
Sewerage<br />
Water Supplies<br />
Rates<br />
We base rates on the Capital Value of each property. We set our<br />
rates by way of <strong>District</strong> Wide Rates and Targeted Rates.<br />
• <strong>District</strong> Wide rates are charged on all properties in<br />
the district, regardless of location. They are are broken<br />
down further to: Governance; Roading; <strong>Plan</strong>ning; Waste<br />
Management; Canterbury Museum; and other General<br />
Rates.<br />
• Targeted rates are charged for specific activities based<br />
on services provided or land use. They are broken down<br />
further to: Water; Sewer; Stromwater/Drainage/Land<br />
Protection; Ward Amenities; Refuse Collection Ward<br />
Medical Centre; Rural fire; Tourism and Other Sundry<br />
Targeted rates.<br />
• The rates and how they are set are further defined in the<br />
Funding Impact Statement but the key changes proposed<br />
for the LTP relate to the funding of Drinking Water<br />
Standards, <strong>District</strong> Wide Stormwater work and the<br />
Capital Levy anticipated to be charged by the Canterbury<br />
Museum.<br />
Drinking Water Standards<br />
The funding of the drinking water improvements will be done<br />
in two stages. Firstly, those supplies that are to be treated, the<br />
direct operating costs of the treatment and the servicing of the<br />
debt arising out of the capital expenditure needed to treat the<br />
relevant water supplies, will be collectively charged by rating<br />
each dwelling that benefits from the work. Secondly, from<br />
2015/2016, a provision is to be made from the general rate to<br />
build a fund to offset some of the significant capital cost to be<br />
incurred in achieving full compliance with the drinking water<br />
standards.<br />
<strong>District</strong> Wide Stormwater<br />
After the flooding events in 2008, much more emphasis has been<br />
placed on development of stormwater plans for the <strong>District</strong> as<br />
a whole. A stormwater engineer is to be appointed in 2013 to<br />
look after this area. As the issue is district wide, the funding is<br />
to come from the <strong>District</strong> Wide General Rate, with a portion<br />
to be funded by way of a fixed charge and a portion by way of<br />
capital value.<br />
Canterbury Museum<br />
As one of four contributing authorities to the Canterbury<br />
Museum, the <strong>Hurunui</strong> <strong>District</strong> has been contributing a levy to<br />
fund the operations of the Museum on an annual basis. <strong>Hurunui</strong><br />
has set a fixed charge on every property in the <strong>District</strong> to<br />
cover this rate. The Museum is proposing to carry out a $63<br />
million building project, which will need to be funded by way<br />
of a Capital Levy. The budget set aside for the Capital levy is<br />
$50,000 in 2013/2014, $100,000 in 2014/2015 and $50,000 in<br />
2015/2016. It is intended that the Capital levy will be charged<br />
on the same basis as the operating levy by sharing it as a fixed<br />
charge per property.<br />
27
www.hurunui.govt.nz<br />
Rate Increases<br />
In general terms, we try to keep the overall rate increase each<br />
year to the level of inflation. However, the actual increases<br />
in rates from an organisational point of view do change from<br />
year to year depending on the funding options chosen and also<br />
the fact that there are operational costs that are not carried<br />
out every year, but need to be funded in the year they are<br />
incurred. As a result, as the rates increase is an amalgam of many<br />
individual rate increases, we intend to set the rates at the level<br />
that is required, rather than to ensure the overall rate increase<br />
is matches inflation.<br />
The <strong>Hurunui</strong> <strong>District</strong> has a small population (one of the smallest<br />
in New Zealand), and because of this, various factors can have<br />
a marked effect on the rates increases in any one year as there<br />
are fewer people to spread the cost across. As a result, there is<br />
an allowance for any rate increases being higher than the level<br />
of inflation due to extraordinary items. These items include, but<br />
not limited to, the following:<br />
• Capital expenditure requirements, which increases the<br />
level of debt for individual communities.<br />
• Increase expenditure due to compliance with new<br />
legislation.<br />
• Increased expenditure resulting from extraordinary<br />
events, such as the Canterbury Earthquakes.<br />
When determining the overall rate increases, an allowance is<br />
made for a 1% increase in the capital value of the district each<br />
year. This may be reviewed if there are significant areas of growth<br />
experienced in excess to this. The increase is only applied to<br />
the district wide rates as it is difficult to accurately assess the<br />
growth in individual areas that targeted rates are charged to.<br />
Because of the structure of our rating system, the overall increase<br />
in rates will not be consistent for each property throughout the<br />
district. It will depend on the targeted rates that are charged<br />
to that particular property and also the capital value of the<br />
property. We provide the relative rate increase comparisons for<br />
22 various sample properties from throughout the district. We<br />
have used the same 22 properties for years as this gives us a<br />
good indication of the impact of increases across the different<br />
communities and house values. The sample properties analysis<br />
is provided the Appendices section.<br />
Overall Rate Increases<br />
Based on the budgets provided for the LTP, the overall rates<br />
increases for each year of the LTP are as follows:<br />
Year<br />
The rates increases are broken down to the following:<br />
Limits on Rate Increases<br />
Overall Rates Increase<br />
<strong>2012</strong>/2013 (Year 1) 5.83%<br />
2013/2014 (Year 2) 5.77%<br />
2014/2015 (Year 3) 5.37%<br />
2015/2016 (Year 4) 3.17%<br />
2016/2017 (Year 5) 3.82%<br />
2017/2018 (Year 6) 3.15%<br />
2018/2019 (Year 7) 2.61%<br />
2019/2020 (Year 8) 4.01%<br />
2020/2021 (Year 9) 3.74%<br />
2021/<strong>2022</strong> (Year 10) 3.33%<br />
Year<br />
<strong>District</strong> Wide<br />
Rates<br />
Targeted Rate<br />
<strong>2012</strong>/2013 (Year 1) 5.63% 5.96%<br />
2013/2014 (Year 2) 7.15% 4.80%<br />
2014/2015 (Year 3) 6.34% 4.67%<br />
2015/2016 (Year 4) 2.14% 3.95%<br />
2016/2017 (Year 5) 3.20% 4.28%<br />
2017/2018 (Year 6) 2.14% 3.89%<br />
2018/2019 (Year 7) 0.30% 4.31%<br />
2019/2020 (Year 8) 3.37% 4.47%<br />
2020/2021 (Year 9) 2.60% 4.55%<br />
2021/<strong>2022</strong> (Year 10) 1.17% 4.85%<br />
All <strong>Council</strong>s are required to set a limit on rates increases over<br />
the ten year period of the LTP. There are no set rules around<br />
how we are to determine what limit it imposes.<br />
Options<br />
There were a number of options available to us, for instance:<br />
• Setting rate increases to an inflation rate.<br />
28
<strong>Hurunui</strong> <strong>Community</strong> <strong>Long</strong> <strong>Term</strong> <strong>Plan</strong> <strong>2012</strong> - <strong>2022</strong><br />
• Setting a percentage increase.<br />
• Setting an increase based on known factors and<br />
assumptions.<br />
We felt that setting rate increase limits based on an arbitrary<br />
rate of inflation was not consistent to the assessment of the<br />
proposed costs outlined in the LTP. This is because it did not<br />
take into account items such as new capital expenditure, which<br />
could result in a necessary increase in rates to fund the work,<br />
which could exceed the overall increase in rates.<br />
Setting a percentage increase per annum again did not reflect<br />
the assessment of the proposed costs in the long term.<br />
Furthermore, as the rates for individual communities can<br />
increases at varying amounts due to various factors, it was<br />
difficult to set a percentage increase that reflected these factors<br />
adequately.<br />
As a result, we decided that the limit to be placed on rate<br />
increases is to be set as a percentage of the overall rates<br />
increases predicted in the LTP.<br />
Limits<br />
The percentage on top of the predicted rates increases will be<br />
2%. In determining this percentage, we that felt 2% provides<br />
sufficient flexibility, particularly if there is significant cost<br />
increases (on top of what has been allowed for using the BERL<br />
cost price increase projections) imposed on us as a result of the<br />
on-going effects of the Canterbury Earthquakes.<br />
As a result, the limits will be as follows<br />
Year<br />
Overall<br />
Increase<br />
Overall<br />
Increase Limit<br />
<strong>2012</strong>/2013 (Year 1) 5.83% 7.83%<br />
2013/2014 (Year 2) 5.77% 7.77%<br />
2014/2015 (Year 3) 5.37% 7.37%<br />
2015/2016 (Year 4) 3.17% 5.17%<br />
2016/2017 (Year 5) 3.82% 5.82%<br />
2017/2018 (Year 6) 3.13% 5.15%<br />
2018/2019 (Year 7) 2.61% 4.61%<br />
2019/2020 (Year 8) 4.01% 6.01%<br />
2020/2021 (Year 9) 3.74% 5.74%<br />
2021/<strong>2022</strong> (Year 10) 3.33% 5.33%<br />
Again, because of the nature of the targeted rate structure,<br />
the increase (or decrease) in rates for any year for individual<br />
properties can vary markedly.<br />
Non-Rates Income<br />
We rely heavily on other forms of income to finance our<br />
operations. For the period of the LTP, the budget has scheduled<br />
that 54% of our total income is generated from sources other<br />
than rates.<br />
25,000,000<br />
20,000,000<br />
15,000,000<br />
10,000,000<br />
5,000,000<br />
-<br />
For <strong>2012</strong>/2013, the income from non-rate sources is expected<br />
to total $16.6 million and this is scheduled to increase to $23<br />
million by 2021/<strong>2022</strong>.<br />
New Zealand Transport Authority Subsidies<br />
The first key component of non-rate income is NZTA subsidies,<br />
which are used to fund both operating and capital expenditure<br />
relating to the roading network. We have assumed that the<br />
current funding assistance rate of funding provided by NZTA<br />
will be maintained for the period of the LTP. Further discussion<br />
of this is provided in the Forecasting Assumptions on page 150<br />
and in the Key Issues section.<br />
Hanmer Springs Thermal Pools and Spa Revenue<br />
The other key component is the Revenue derived from the<br />
HSTP&S, which accounts for approximately one third of the total<br />
income received. The HSTP&S is run as a separate business unit<br />
of the <strong>Council</strong> and after allowing for Operating Expenses and<br />
Interest, the surpluses are actively used to fund reserve costs<br />
throughout the <strong>District</strong>. The reserve costs include: the cost<br />
of the library, cemeteries, public toilets and a range of district<br />
reserve costs. Over the last five years, the surpluses from the<br />
pools have contributed a total of $7.65 million to these reserve<br />
costs, which would otherwise need to be rated for. Over the life<br />
the long term plan it is forecast that a total of $24 million will<br />
be used from the surpluses derived from the HSTP&S to offset<br />
these reserve costs.<br />
Development Contributions<br />
Other Income<br />
Hanmer Springs Thermal Pools and Spa<br />
NZTA Subsidies<br />
External Interest Received<br />
Development Contributions<br />
Development Contributions also form a key component for<br />
funding capital expenditure which has been required due to<br />
increased growth. It is anticipated that over the life of the LTP, we<br />
will receive a total of $4.3 million in Development Contributions,<br />
however the amount actually received will be dependent on the<br />
level of growth experienced. The Development Contribution<br />
Policy is on page 206.<br />
29
www.hurunui.govt.nz<br />
Fees and Charges<br />
Fees and Charges account for the remaining non-rate income.<br />
We review our fees and charges each year and try to ensure<br />
that they help offset actual costs and that the activities are not<br />
overly reliant on rate funding instead. We also aim to make the<br />
fees and charges affordable and fair on those who use them.<br />
Targets for Investments<br />
Cash Investments<br />
As a result of a large Capital programme over the 2009/2010 and<br />
2010/2011 years, principally due to the expansion works at the<br />
HSTP&S, we had to take on term debt for the first time. Over<br />
the period of the LTP, we expect to remain as a net borrower. As<br />
a result, we no longer hold any long term cash assets in the form<br />
of bonds or stock. Any spare cash funds are generally held on<br />
call or in a short term investment of less than three months to<br />
earn a small amount of interest as the interest rates are better<br />
than holding the funds in a current account.<br />
Equity Investments<br />
Currently, we hold two equity investments – one in Civic<br />
Assurance and the other in Transwaste Canterbury. Neither<br />
assets are readily tradable on the open market, but we have<br />
objectives for retaining ownerships of these investments.<br />
Our holding in Civic Assurance was to maintain Civic as an<br />
option in the insurance market. Civic was set up to provide<br />
Local Authorities with an option for insurance that generally<br />
met the unique insurance requirements faced by <strong>Council</strong>s.<br />
Civic Assurance was heavily affected by the claims made as a<br />
result of the Canterbury Earthquakes and there was a need<br />
to recapitalise to ensure that it remains part of the insurance<br />
market for local authorities in the future. It is not expected to<br />
return a dividend for over the period of the LTP.<br />
We own 1.2% of Transwaste Canterbury, which owns and<br />
operates the Kate Valley Landfill. The value of our investment<br />
as at 30 June 2011 was $269,000.The Company is 50% owned<br />
by five of the <strong>Council</strong>s in Canterbury and our objective for<br />
holding our investment is to continue to receive dividends<br />
from the Company. The net return to us is approximately 27%<br />
on <strong>Hurunui</strong>’s share of the net asset backing of the Company<br />
and we have budgeted to receive $72,000 per annum from this<br />
investment.<br />
Forestry Investments<br />
We hold approximately 240 hectares of trees. Some of the key<br />
plantations are due for milling during the life of the LTP. Forestry<br />
assets are held as long term investments on the basis of net<br />
positive discounted cash flows, factoring in projected market<br />
prices and annual maintenance and cutting costs. All income<br />
from forestry is included in the statement of comprehensive<br />
income, and this is used to fund replanting of the land. Where<br />
there is an excess of funds, we may distribute this in a manner<br />
we see fit.<br />
External Debt<br />
We have two key areas of borrowing - Internal and External.<br />
The Internal debt is pursuant to our Internal Financing Policy, as<br />
discussed above.<br />
As our cash resources have been drawn down to fund key<br />
capital projects in the past few years, we needed to take on<br />
external debt to manage cash flow. We are now expecting to be<br />
a net borrower for the period of the LTP.<br />
Anticipated Levels of External Debt<br />
As at 31 December 2011, the total amount of external debt we<br />
held was $12 million. At the end of the ten year period, the debt<br />
is expected to be $12.0 million, with the debt level is expected<br />
to peak at $22.5 million over the period between July 2014 and<br />
June 2017. The anticipated debt levels over the period.<br />
Year<br />
Total<br />
Anticipated<br />
Debt<br />
Limits on Debt Levels<br />
Total Anticipated<br />
Interest Expense<br />
<strong>2012</strong>/2013 (Year 1) $18.5 million $969,000<br />
2013/2014 (Year 2) $20.0 million $1,203,000<br />
2014/2015 (Year 3) $21.5 million $1,297,000<br />
2015/2016 (Year 4) $22.0 million $1,359,000<br />
2016/2017 (Year 5) $22.5 million $1,359,000<br />
2017/2018 (Year 6) $21.5 million $1,281,000<br />
2018/2019 (Year 7) $19.5 million $1,156,000<br />
2019/2020 (Year 8) $17.5 million $1,000,000<br />
2020/2021 (Year 9) $14.5 million $828,000<br />
2021/<strong>2022</strong> (Year 10) $12.0 million $750,000<br />
Our External Liability Risk Management Policy sets out the<br />
limits on the level of debt that we can take on. The ratios have<br />
been developed in accordance to the industry standard and<br />
have been set against the levels that are appropriate for us to<br />
take debt from the Local Government Funding Agency (LGFA).<br />
The net debt limits provided for in the policy are that total debt<br />
shall be no more than 100% of total income and no more than<br />
10% of total equity. Based on the levels of income allowed for<br />
30
<strong>Hurunui</strong> <strong>Community</strong> <strong>Long</strong> <strong>Term</strong> <strong>Plan</strong> <strong>2012</strong> - <strong>2022</strong><br />
in the LTP, the limit of the debt that could be taken on is $42.5<br />
million.<br />
Year<br />
100% of Total<br />
Income<br />
10% of Total<br />
Equity<br />
<strong>2012</strong>/2013 (Year 1) $30.3 million $34.2 million<br />
2013/2014 (Year 2) $31.6 million $34.6 million<br />
2014/2015 (Year 3) $32.9 million $35.2 million<br />
2015/2016 (Year 4) $34.3 million $37.7 million<br />
2016/2017 (Year 5) $35.4 million $38.2 million<br />
2017/2018 (Year 6) $36.5 million $38.9 million<br />
2018/2019 (Year 7) $37.9 million $42.0 million<br />
2019/2020 (Year 8) $39.2 million $42.7 million<br />
2020/2021 (Year 9) $40.7 million $43.8 million<br />
2021/<strong>2022</strong> (Year 10) $42.5 million $47.5 million<br />
The policy also provides for the total amount of interest<br />
expenses shall be no more than 5% of total revenue and no<br />
more than 10% of annual rates income. Based on the maximum<br />
of $42.5 million in income, the total interest cost can be no<br />
more than $2.13 million.<br />
Year<br />
5% of total<br />
income<br />
10% of total<br />
annual rates<br />
income<br />
<strong>2012</strong>/2013 (Year 1) $1.52 million $1.36 million<br />
2013/2014 (Year 2) $1.58 million $1.45 million<br />
2014/2015 (Year 3) $1.65 million $1.53 million<br />
2015/2016 (Year 4) $1.72 million $1.59 million<br />
2016/2017 (Year 5) $1.78 million $1.65 million<br />
2017/2018 (Year 6) $1.83 million $1.70 million<br />
2018/2019 (Year 7) $1.90 million $1.75 million<br />
Holding a Debenture Trust Deed provides us with security for a<br />
range of different funding options:<br />
• Registered Bank Debt<br />
• Use of the Local Government Funding Agency<br />
• Issuing <strong>Council</strong> Debt directly to the market<br />
Further information is available in the External Liability<br />
Management Policy.<br />
Implications of <strong>Hurunui</strong>’s Financial Strategy<br />
Assessment of our ability to provide and maintain existing levels<br />
of service and to meet additional demands for service within<br />
those rate increase limits:<br />
We face potential issues in the future in regards to the level<br />
of funding that is expected to be provided for roading from<br />
NZTA as discussed previously in this Financial Strategy. It<br />
has been estimated that the difference over the ten years<br />
between what was scheduled in the AMP and what has<br />
been provided in the LTP amounts to a total of $18 million.<br />
Assessment of our ability to provide and maintain existing levels<br />
of service and to meet additional demands for service within<br />
those debt limits:<br />
As listed in the table above, we are not contemplating<br />
taking on debt greater than $22.5 million and the<br />
maximum amount of interest expected to be charged on<br />
the external debt is budgeted at less than $1.4 million.<br />
Therefore, with the exception of the Roading Network<br />
due to circumstances outlined earlier, our assessment is<br />
that we do have the ability to maintain the existing levels<br />
of service and to meet additional demands for service<br />
within those debt limits.<br />
2019/2020 (Year 8) $1.97 million $1.82 million<br />
2020/2021 (Year 9) $2.04 million $1.90 million<br />
2021/<strong>2022</strong> (Year 10) $2.13 million $1.98 million<br />
Security for Borrowing<br />
Prior to taking on debt for the first time in September 2010, we<br />
prepared a Debenture Trust Deed and selected Perpetual Trust<br />
as our Trustee. The Debenture Trust Deed is a standard security<br />
document for <strong>Council</strong>s. The key security available is that a charge<br />
can be made against the rates of the <strong>Council</strong> to repay debt so<br />
the market perspective on this is that a Debenture Trust Deed<br />
provides a low level of risk for an investor or funding provider,<br />
which in turn should allow for lower interest rates.<br />
31
www.hurunui.govt.nz<br />
Statement Concerning Balancing of the Budget<br />
Introduction<br />
In terms of the Local Government Act 2002, the <strong>Council</strong> is<br />
balancing the budget over the period of the <strong>Long</strong> <strong>Term</strong> <strong>Plan</strong> as in<br />
most years; the budgeted operating income exceeds budgeted<br />
operating expenditure. There are some areas of expenditure<br />
that the <strong>Council</strong> has resolved not to fund, which are discussed<br />
further. The <strong>Council</strong> also has developed an internal financing<br />
policy to cope with funding for future capital expenditure<br />
requirements.<br />
Local Government Act 2002<br />
Under Section 100 of the Local Government Act 2002, the<br />
<strong>Council</strong> is required to balance the budget. The provisions of the<br />
sections specifically state that “A local authority must ensure<br />
that each year’s projected operating revenues are set at a level<br />
sufficient to meet that year’s projected operating expenses”.<br />
The Act goes further to state that a local authority may set<br />
projected operating revenues at a different level from that<br />
required if the <strong>Council</strong> resolves that it is financially prudent to<br />
do so, having regard to:<br />
to that activity. In some cases, the <strong>Council</strong> has resolved to use<br />
reserves to fund some specific expenditure. This is particularly<br />
the case where the <strong>Council</strong> actively uses the Reserve built up<br />
by surpluses recorded from the Hanmer Springs Thermal Pools<br />
and Spa to fund the operating expenditure of other reserves<br />
throughout the entire district.<br />
Receipt of Capital Income<br />
For some of the <strong>Council</strong> activities, the <strong>Council</strong> has budgeted to<br />
receive various amounts of income that are of a capital nature.<br />
This capital income is in the form of development and reserve<br />
contributions and vested assets which are not used to reduce<br />
the amount of rates to be charged of a particular activity. These<br />
amounts are instead applied to the capital requirements of the<br />
activity that it relates to.<br />
Funding of Depreciation<br />
The introduction of the Local Government Amendment (No 3)<br />
Act 1996 imposed the requirement for local authorities to fund<br />
depreciation.<br />
a) The estimated expenses of achieving and maintaining<br />
the predicted levels of service provision set out in the<br />
long-term council community plan, including the estimated<br />
expenses associated with maintaining the service capacity<br />
and integrity of assets throughout their useful life; and<br />
b) The projected revenue available to fund the estimated<br />
expenses associated with maintaining the service capacity<br />
and integrity of assets throughout their useful life; and<br />
c) The equitable allocation of responsibility for funding<br />
the provision and maintenance of assets and facilities<br />
throughout their useful life; and<br />
d) The funding and financial polices set out in this long<br />
term plan<br />
Use of Reserves<br />
The council is forecasting to record an overall deficit (excluding<br />
gains on Asset Revaluation) in each of the first three years of teh<br />
<strong>Long</strong> <strong>Term</strong> <strong>Plan</strong>. These deficits have been caused by the <strong>Council</strong>’s<br />
decision to fund more reserve based costs than it is generatimg<br />
from the surpluses of the Hanmer Springs Thermal Pools & Spa.<br />
The <strong>Council</strong> is comfortable with this approach as it is able to<br />
utilise surplusses that have been generated over the past few<br />
years that have yet to be allocated. The <strong>Council</strong> is forecasting<br />
to record surpluses for each year of the <strong>Long</strong> <strong>Term</strong> <strong>Plan</strong> from<br />
year four onwards. In some activities however, the <strong>Council</strong> has<br />
resolved not to set revenue to fund all of the costs relating<br />
In 1999, the <strong>Council</strong> widely consulted with its community over<br />
this requirement and it concluded that the <strong>Council</strong> will not cash<br />
fund depreciation on Water and Sewer assets, roading or ward<br />
Amenity assets. In addition, it has been resolved not to fund<br />
depreciation on the library building.<br />
Rates for these activities are set at a level higher than required<br />
to meet the operating costs in terms of the Internal Financing<br />
System. The additional rates will be used to either repay debt (if<br />
the activity holds some internal debt) or used to build an amount<br />
to fund future capital expenditure. The Internal Financing system<br />
is fully discussed in the Internal Financing Policy.<br />
Implications to Not Fully Fund<br />
Depreciation<br />
As there are no specific depreciation reserves created for water,<br />
sewer, roading and ward amenities, there are no funds available<br />
immediately to apply to capital expenditure requirements of<br />
each of these activities. As a result, the community of benefit<br />
is required to meet the cost of the capital expenditure through<br />
the use of internal loans or fund the capital cost through rates<br />
and other income.<br />
If internal loans are used, there is the requirement on that<br />
community of benefit to fund not only the appropriate interest<br />
charge but also a portion of the principal of the outstanding loan<br />
on an annual basis. Both interest and principal repayments has<br />
32
<strong>Hurunui</strong> <strong>Community</strong> <strong>Long</strong> <strong>Term</strong> <strong>Plan</strong> <strong>2012</strong> - <strong>2022</strong><br />
the effect of increasing the operational cost that the community<br />
must bear and as a result, increases in the rate requirement are<br />
inevitable. The Internal Financing system goes further to ensure<br />
that communities continue to fund additional payments, even if<br />
the debt has been repaid, to build up a reserve fund to assist in<br />
funding capital expenditure requirements in the future.<br />
<strong>Council</strong> is comfortable with increasing rates to meet the cost of<br />
interest and principal because existing ratepayers have previously<br />
been relieved of any rate increases that may have been required<br />
if the <strong>Council</strong> resolved to fully fund the depreciation on those<br />
assets.<br />
33
www.hurunui.govt.nz<br />
<strong>Community</strong> Outcomes<br />
Introduction<br />
‘<strong>Community</strong> outcomes’ are the community’s overall aspirations<br />
for the future of the <strong>Hurunui</strong> district. They relate to all aspects<br />
of our rural life – our environment, economy, social, and cultural<br />
wellbeing. These four wellbeings are commonly referred to<br />
by government agencies as summarising the various aspects<br />
needed for healthy community life in New Zealand.<br />
The community outcomes in this long term plan relate directly<br />
to the activities that we do as a council as they are the only<br />
ones we have direct control over. There can be many more<br />
community outcomes which can only be achieved with help<br />
from other organisations such as business, government, the<br />
police and many others.<br />
Hawarden /Waikari Volunteer Rural Fire Force (VRFF)<br />
The term ‘community outcomes’ is used to describe what<br />
people want to happen now and in the future for the benefit<br />
of not only today’s people, but future generations. <strong>Community</strong><br />
outcomes are about improving the wellness of our communities<br />
over time in a sustainable manner.<br />
Identifying the <strong>Community</strong> Outcomes<br />
In past years, we have sought public views to identify what our<br />
communities consider important for the future of the <strong>Hurunui</strong><br />
<strong>District</strong>. In addition to this, we have often sought community<br />
views on a variety of issues and we feel confident we have a<br />
good understanding of what people in the <strong>Hurunui</strong> consider to<br />
be important. We have since scaled down previously identified<br />
community outcomes to five broad outcomes that we as a<br />
<strong>Council</strong> are able to work toward achieving. These community<br />
outcomes are described in table 1. and each is aligned to one of<br />
the four key wellbeings as well as the service or activity that we<br />
provide to contribute toward achievement of them.<br />
Hawarden/Waikari & Scargill VRFF<br />
Scargill VRFF<br />
34
Table 1:<br />
<strong>Hurunui</strong> <strong>Community</strong> <strong>Long</strong> <strong>Term</strong> <strong>Plan</strong> <strong>2012</strong> - <strong>2022</strong><br />
<strong>Community</strong> Outcomes and the Link to What <strong>Council</strong> Does (Activities)<br />
Social<br />
Wellbeing Outcome Definition <strong>Council</strong> Activities (How we contribute)<br />
Cultural<br />
Economy<br />
Environmental<br />
A desirable and<br />
safe place to live<br />
A place where<br />
our traditional<br />
rural values and<br />
heritage make<br />
<strong>Hurunui</strong> unique<br />
A place with a<br />
thriving local<br />
economy<br />
A place with<br />
essential<br />
infrastructure<br />
A place that<br />
demonstrates<br />
environmental<br />
responsibility<br />
• We have attractive well designed<br />
townships<br />
• Communities have access to<br />
adequate health and emergency<br />
services and systems and<br />
resources are available to meet<br />
civil defence emergencies<br />
• Risks to public health are<br />
identified and appropriately<br />
managed<br />
• People have a range of<br />
opportunities to participate in<br />
leisure and culture activities<br />
• Our historic and cultural<br />
heritage is protected for future<br />
generations<br />
• We are seen as a good place to<br />
do business, to live and to visit<br />
• We have a strong emphasis<br />
on service delivery across<br />
all infrastructure including<br />
roading, water (for drinking<br />
and development), waste water,<br />
stormwater and solid waste<br />
• We protect our environment<br />
while preserving people’s<br />
property rights<br />
• We minimise solid waste to the<br />
fullest extent, and manage the rest<br />
in a sustainable way<br />
Measuring and Reporting our Progress<br />
Each of the above outcomes is aligned to our services which<br />
will contribute toward the achievement of them. We are<br />
responsible for monitoring our performance each year, and the<br />
results are provided in our Annual Report. How we are doing<br />
with each of our services will give a good indication of how we<br />
are going overall to achieve the community outcomes. See the<br />
<strong>Council</strong> Activity pages for performance information.<br />
Groups<br />
• <strong>Community</strong> Services and<br />
Facilities<br />
• Environment and Safety<br />
• Governance<br />
• <strong>Community</strong> Services and<br />
Facilities<br />
• Hanmer Springs Thermal<br />
Pools & Spa<br />
• <strong>District</strong> Promotion<br />
• Hanmer Springs Thermal<br />
Pools & Spa<br />
• Water Supply<br />
• Sewerage<br />
• Stormwater & Drainage<br />
• Roads & Footpaths<br />
• Environment & Safety<br />
Individual services<br />
Property - Pensioner Housing,<br />
Residential Housing, Public Toilets,<br />
<strong>Council</strong> Offices & Depots, Car Parks,<br />
Medical Centres, Halls, Swimming<br />
Pools, Township Maintenance<br />
Emergency Services - Civil Defence,<br />
Rural Fire<br />
Compliance and Regulatory<br />
Functions - Building, Public Health,<br />
Liquor Licensing, Animal Control<br />
Governance<br />
<strong>Community</strong> Services - Library, Youth,<br />
<strong>Community</strong> Development, Grants<br />
and Service Awards<br />
Reserves - Parks and Reserves,<br />
Queen Mary Historic Hospital<br />
Reserve, Cemeteries<br />
Thermal Pools – Spa, i-site, pools,<br />
café<br />
Promotion<br />
Tourism<br />
Economic Development<br />
Water Schemes<br />
Sewerage Schemes<br />
Stormwater & Drainage<br />
Roading - Roads, Bridges, Footpaths,<br />
Street Lighting, Road Safety<br />
Resource Management & <strong>Plan</strong>ning<br />
- RMA Consents, Administration<br />
& Policy Development, Subdivision<br />
Inspection<br />
Waste Minimisation - Refuse,<br />
Recycling, Transfer Stations, Litter Bin<br />
Collection<br />
35
www.hurunui.govt.nz<br />
Aligning Our <strong>Long</strong> <strong>Term</strong> <strong>Plan</strong> With the Government’s Drivers<br />
for Economic Growth<br />
The Government’s Economic Growth<br />
Agenda<br />
The government’s principal economic goal is to deliver greater<br />
prosperity, security and opportunities to all New Zealanders.<br />
It wants to improve New Zealand’s fundamental growth<br />
momentum. An important part of this is through the economy<br />
rebalancing itself toward exporting and investment. The<br />
government has a six-point Economic Growth Agenda aimed at<br />
creating an environment that allows businesses to grow, export<br />
and create high-value jobs. The six drivers for economic growth<br />
are:<br />
• Enable better science, innovation and trade.<br />
• Remove red tape and unnecessary regulation.<br />
• Deliver better, smarter, public services.<br />
• nvest in productive infrastructure.<br />
• Lift education and skills.<br />
• Create a growth-enhancing tax system.<br />
<strong>Hurunui</strong>’s Annual Economic Growth<br />
Business and Economic Research Limited (BERL) Regional<br />
Performance Indicators Report for 2011, published in March <strong>2012</strong>,<br />
which measures each district’s economic performance, ranked<br />
<strong>Hurunui</strong> 10th out of 66 territorial local authorities in New<br />
Zealand. Nine key performance indicators were compared<br />
for the year ending March 2011. We maintained our 10th place<br />
2010 ranking.<br />
Infometrics Limited Annual Economic Profile for 2010, published in<br />
2011, said Gross Domestic Product (GDP) in <strong>Hurunui</strong> measured<br />
$303m in 2010, down 0.3% from a year earlier. New Zealand’s<br />
GDP declined by 0.5% over the same period. <strong>Hurunui</strong>’s GDP<br />
growth of -0.3% ranked it number 32 among the 72 territorial<br />
authorities for GDP growth.<br />
Agriculture, fishing and forestry was the largest industry in<br />
<strong>Hurunui</strong> in 2010 accounting for 45.3% of total GDP, followed by<br />
business and property services (12.4%).<br />
<strong>Council</strong>’s Contribution Towards Economic<br />
Growth<br />
From a local perspective, <strong>Hurunui</strong> <strong>District</strong> <strong>Council</strong> plays a<br />
significant role in growing the local economy. Its involvement in<br />
areas such as leadership, planning and infrastructure, regulation,<br />
services, business support, and social and community, actively<br />
create environments that attract, retain, and grow economic<br />
activity. Our contribution occurs within its total annual spending<br />
(planned to be $30m in the <strong>2012</strong>/13 year). This spending can<br />
be viewed as an investment into the <strong>Hurunui</strong> environment that<br />
36<br />
enables individuals, households and organisations to produce<br />
and contribute to economic growth.<br />
Leadership: We contribute through our role in local strategic<br />
planning. We have developed a new vision (‘<strong>Community</strong> partnership<br />
in growth and wellbeing’) and have developed a <strong>Long</strong><br />
<strong>Term</strong> <strong>Plan</strong> that provides for economic growth and allows business<br />
interests to flourish. Key drivers for the <strong>Plan</strong> include core<br />
principles of:<br />
• Focusing on core services.<br />
• Financial responsibility and affordability.<br />
• Continuous improvement in service to everyone in our<br />
district.<br />
• Facilitating appropriate growth in the district.<br />
and<br />
• Maximising our Hanmer Springs Thermal Pools and Spa<br />
profits.<br />
• <strong>Hurunui</strong> <strong>District</strong> <strong>Council</strong> being a High Performance<br />
Organisation.<br />
Infrastructure: We contribute through our role as an infrastructure<br />
provider. Our investment in infrastructure plays a direct<br />
role in creating an attractive environment for business to<br />
invest.<br />
Regulation: We contribute through our regulatory role. We<br />
can make it easier for new investment, for businesses to grow<br />
and create jobs.<br />
Services: We contribute through our role in providing local<br />
amenities, such as libraries and reserves. We provide services<br />
that make our communities attractive to skilled migrants.<br />
Business Support: We contribute through our support to<br />
business and industry development. Our economic development<br />
arm, Enterprise North Canterbury (ENC) carries out a range of<br />
activities that help retain businesses and support growth and<br />
prosperity in North Canterbury. ENC’s budget is over $1.1m<br />
p.a. It receives 44% of its funding from the <strong>Hurunui</strong> and Waimakariri<br />
<strong>District</strong> <strong>Council</strong>s (HDC funding is $50,000 p.a.); 30%<br />
from central government contracts; 18% from the private sector<br />
and other grants; and 8% from sponsorship.<br />
We also continue by promoting tourism in order to attract<br />
visitors into the district to enable local business growth (refer<br />
to the <strong>District</strong> Promotion activity for proposed tourism changes<br />
outlined for consultation).<br />
<strong>Community</strong>: We contribute through our contribution to social<br />
and community affairs, strengthening local social capital.<br />
Overall, we have a fundamental role in ‘shaping’ places in the<br />
<strong>Hurunui</strong>, like our towns, ensuring infrastructure and amenities<br />
are provided to make our district attractive to investment and<br />
skilled immigrants.
<strong>Hurunui</strong> <strong>Community</strong> <strong>Long</strong> <strong>Term</strong> <strong>Plan</strong> <strong>2012</strong> - <strong>2022</strong><br />
Some of the important things we plan to do in this <strong>Long</strong> <strong>Term</strong><br />
<strong>Plan</strong> that directly relate to the government’s six-point Economic<br />
Growth Agenda are highlighted below:<br />
Enable Better Science, Innovation and<br />
Trade<br />
Science and innovation are enormously important drivers of<br />
New Zealand’s economic growth.<br />
ENC will be proactive in searching for and supporting new<br />
initiatives that create substantial wealth in North Canterbury.<br />
Particular emphasis will be given to the primary sector and its<br />
related servicing industries. ENC’s Rural Technology Transfer<br />
Project is particularly relevant. This project is about turning new<br />
ideas developed at Lincoln Research campuses into practical<br />
applications resulting in commercial returns on the farm.<br />
Improved techniques for both dryland farming and irrigated land<br />
use options are being pursued.<br />
ENC will continue to facilitate the establishment of local<br />
industry groupings where these are sought by the sector, to<br />
achieve efficiencies in marketing, product development and<br />
securing of resources. Management and marketing of the North<br />
Canterbury Food and Wine Trail is one such example.<br />
ENC assesses economic development opportunities in local<br />
towns. A Cheviot project is currently underway.<br />
In 2011 we approved a <strong>Hurunui</strong> Tourism Strategy and currently<br />
continue to fund tourism promotion in order to attract visitors<br />
into the district to support local business growth. Likewise, ongoing<br />
investment in and the marketing of our Hanmer Springs<br />
Thermal Pools and Spa complex is provided for in this <strong>Plan</strong>;<br />
the Thermal Pools and Spa complex are an internationally<br />
recognised tourism icon that return a growing income stream<br />
to fund works and services on <strong>Council</strong> reserves and off-set the<br />
size of the district wide rate requirement.<br />
Overseas trade links can be a productivity springboard. For this<br />
purpose, councils often form overseas sister city relationships.<br />
To date, we have not taken on such a role. Forming a relationship<br />
with Hung Hu City in China at a cost of $7,500 p.a. has been<br />
requested of <strong>Council</strong>. More information is being sought. No<br />
provision for such a relationship is included in this <strong>Plan</strong> at this<br />
stage.<br />
Remove Red Tape and Unnecessary<br />
Regulation<br />
We have implemented the government’s recent simplified<br />
Resource Management Act changes to reduce costs and make<br />
processes clearer; and it will implement any further RMA and<br />
building regulation reforms when enacted, to make it easier for<br />
businesses to grow, invest and create jobs.<br />
In terms of our own regulations, over the past few years we<br />
have carried out a significant number of <strong>District</strong> <strong>Plan</strong> changes to<br />
ensure the <strong>District</strong> <strong>Plan</strong> is up to date and that our rules reflect<br />
current thinking. Among these approved changes, relatively<br />
large amounts of land have been opened up for development<br />
in Amberley, Hanmer Springs and Gore Bay, new areas of land<br />
have been zoned for business and industrial purposes, and<br />
appropriate rules for vine yards wanting to install frost fans have<br />
been agreed.<br />
We are required to give effect to recent new National Policy<br />
Statements (NPS) such as the NPS for Renewable Electricity<br />
Generation 2011. The government has a renewable electricity<br />
target of 90% of electricity from renewable sources by 2025. This<br />
requires a significant increase in the proportion of electricity to<br />
be generated from renewable resources. The government was<br />
concerned renewable electricity generation was being unduly<br />
impeded by variable provisions in local authority policies and<br />
plans and changing attitudes to the environmental effects of<br />
development associated with renewable electricity generation<br />
activities. Accordingly there are now new guidelines to ensure<br />
the national significance of renewable electricity generation and<br />
associated activities are more explicitly recognised in policy<br />
development and resource management consenting processes.<br />
This <strong>Long</strong> <strong>Term</strong> <strong>Plan</strong> contains funding for a comprehensive<br />
review of our <strong>District</strong> <strong>Plan</strong>. We expect the <strong>District</strong> <strong>Plan</strong> to be<br />
ready for notification by the end of 2013.<br />
The Environment Court released its decision at the end of<br />
2011 on the Mainpower proposal to establish and operate a<br />
$200m wind farm at Mt Cass Waipara. The initial application was<br />
declined by <strong>Hurunui</strong> <strong>District</strong> <strong>Council</strong> appointed commissioners.<br />
During extensive mediation the proposal was modified and this<br />
modified proposal was directly referred to the Court and it<br />
is this proposal that has been granted consent, subject to an<br />
extensive suite of conditions. Mainpower have eight years to<br />
give effect to the consent. The <strong>Council</strong> will have an important<br />
regulatory role to fulfil in respect to consent requirements.<br />
In 2011 we agreed to directly refer Meridian Energy’s proposed<br />
$200m to $300m Greta Valley wind farm development consent<br />
application to the Environment Court. Meridian Energy has<br />
agreed to pay our direct referral costs. We expect the Court<br />
will be hearing the application by mid-<strong>2012</strong>.<br />
In September 2011, developers announced their plans for a<br />
$120m shopping centre and residential development on the<br />
eastern side of Amberley. The $30m shopping centre on State<br />
Highway One was granted a non-notified resource consent<br />
by us in February 2010, but developers are still finalising plans<br />
and have yet to provide a firm start date for what is likely to be<br />
a staged development.<br />
The $90m residential development is expected to open up 500<br />
to 600 lots in total. We granted a subdivision application for the<br />
first stage of the development late last year.<br />
37
www.hurunui.govt.nz<br />
In October 2011, another 60 lot subdivision application was<br />
granted on the Western side of Amberley.<br />
ENC will continue to play a role assisting new businesses<br />
establish in the district. Part of this role is acting as an interface<br />
for businesses with us to ensure regulatory processes are work<br />
effectively.<br />
In preparation of this <strong>Long</strong> <strong>Term</strong> <strong>Plan</strong> we commissioned<br />
PricewaterhouseCoopers to review our Development<br />
Contributions policy. As a result, a number of minor amendments<br />
were agreed to ensure we will collect the correct amount of<br />
money from developers to cover the costs of growth (refer to<br />
the Development Contributions section of this <strong>Plan</strong>).<br />
Deliver Better, Smarter, Public Services<br />
We have a High Performance Organisation culture. A range of<br />
work aimed at improving customer services and achieving cost<br />
savings and value for money is undertaken each year.<br />
We competitively tender a significant amount of its work.<br />
Last year we saved $200,000 with our three year public toilet<br />
cleaning contracts. Grass moving and street cleaning tendering<br />
also resulted in savings. In our largest contract area, road<br />
maintenance, last year Downers won this work, tendering a<br />
three year price of $11,595,216. This was $3,707,704 under<br />
our engineer’s estimate based on historic rates, and $2,113,444<br />
lower than the next lowest tendered price. Savings are reinvested<br />
into the roading network.<br />
We are involved in and will continue to look for opportunities<br />
in Shared Services arrangements in order to deliver our<br />
services and to help get value for money (refer Shared Services<br />
references throughout this <strong>Plan</strong>). See Table1: Shared Services.<br />
ENC will continue to carry out regular research with local<br />
businesses to identify gaps, opportunities and track business<br />
issues and trends.<br />
Invest in Productive Infrastructure<br />
First-class infrastructure is an important enabler of higher<br />
productivity and economic growth. In this <strong>Long</strong> <strong>Term</strong> <strong>Plan</strong><br />
we are investing in owning and maintaining a high standard<br />
of infrastructure that meets both our community’s economic,<br />
social, cultural and environmental needs, and the government’s<br />
legislative requirements.<br />
Importantly, this <strong>Plan</strong> makes the significant funding provision<br />
necessary for <strong>Hurunui</strong> to be able to meet government’s Drinking<br />
Water Standards. The <strong>Plan</strong> provides for more public toilets;<br />
more cemetery land; new stormwater infrastructure; more<br />
parks and reserves infrastructure; for library, hall and service<br />
centre improvements; and for new emergency management and<br />
rural fire equipment, to name just a few. It also contains initial<br />
proposals for new sporting and medical centres.<br />
Table 1: Shared Services<br />
<strong>Hurunui</strong> <strong>District</strong> <strong>Council</strong> Shared Services<br />
Arrangements as at February <strong>2012</strong><br />
Collaboration Joint Procurement Shared Services<br />
Canterbury Water Electoral Services Transwaste Kate Valley<br />
Management Strategy<br />
landfill<br />
Civil Defence<br />
Rural Fire<br />
Flood Protection<br />
Office accommodation<br />
(for CRC)<br />
Transportation<br />
priorities<br />
SOLGM – best practice<br />
work<br />
Ingenium – asset<br />
management work<br />
Building Accreditation<br />
Environmental Health<br />
<strong>District</strong> <strong>Plan</strong> work<br />
Rate collection (for<br />
CRC)<br />
IT/ GIS/ Library<br />
IT (hardware and<br />
software)<br />
SOLGM – industry<br />
good work<br />
SOLGM – staff<br />
recruitment and<br />
retention<br />
Regional Purchasing<br />
Group (electricity, fuel)<br />
ENC<br />
CED Co Ltd<br />
Canterbury Museum<br />
Insurance – Riskpool/<br />
LAPP/ Civic<br />
Building control work<br />
Regional planning Road Maintenance<br />
responses<br />
(some sharing with<br />
Waimakariri DC)<br />
HDC Natural<br />
Biodiversity (govt grant)<br />
Environment Fund (joint<br />
grant with Mainpower)<br />
<strong>Community</strong><br />
Development (govt<br />
grant)<br />
Libraries (located with<br />
local schools)<br />
Water (Ashley<br />
scheme extending into<br />
Waimakariri DC area)<br />
Water will be a key part of North Canterbury’s transformational<br />
economic development. We continue to support the Canterbury<br />
Water Management Strategy in this <strong>Long</strong> <strong>Term</strong> <strong>Plan</strong>. We provide<br />
for our share of the operation of the <strong>Hurunui</strong> Waiau Zone<br />
Committee, which is a joint committee with the Canterbury<br />
Regional <strong>Council</strong>. The Regional <strong>Council</strong>’s Regional Water<br />
Committee will be considering the matter of how to fund the<br />
provision of infrastructure associated with any large water<br />
storage options that are seen as feasible. Properly managed, bulk<br />
water storage could result in large productivity gains in North<br />
Canterbury. No <strong>Council</strong> funding for such a purpose has been<br />
discussed or provided for in this <strong>Plan</strong> to date.<br />
With the removal of the <strong>Hurunui</strong> and Waiau River moratoriums<br />
on 1 October 2011, Meridian Energy and Ngai Tahu Property<br />
have jointly lodged initial consent applications for a proposed<br />
hydro and irrigation scheme to be located between the Waiau<br />
and <strong>Hurunui</strong> Rivers. The development of the project will be<br />
dependent on the <strong>Hurunui</strong> Waiau Regional <strong>Plan</strong> progress<br />
in <strong>2012</strong> and the RMA consent process. The parties still have<br />
significant investigations and design work to complete and<br />
believe construction is likely to be at least 10 years away. We are<br />
38
<strong>Hurunui</strong> <strong>Community</strong> <strong>Long</strong> <strong>Term</strong> <strong>Plan</strong> <strong>2012</strong> - <strong>2022</strong><br />
likely to have an important consenting role.<br />
The <strong>Hurunui</strong> Water Project has also lodged consent for Waitohi<br />
storage in line with the Zone Implementation Programme’s<br />
preferred option.<br />
The <strong>Long</strong> <strong>Term</strong> <strong>Plan</strong> contains further capital funding provision<br />
for on-going renewal and refreshment of our Hanmer Springs<br />
Thermal Pools and Spa complex.<br />
ENC is also focusing on government’s rural broadband delivery<br />
project (directed at schools and hospitals) to put together local<br />
business consortia to investigate higher capacity broadband<br />
services for rural businesses to create new wealth, as an<br />
adjunct to the government’s programme. We will be involved in<br />
consenting requirements for at least two new cell phone towers<br />
that are planned as part of the roll-out.<br />
Lift Education and Skills<br />
ENC will continue to provide training and coaching programmes<br />
aimed at improving local business skills and business capability.<br />
ENC is carrying out work to support the Amuri Dairy Employers<br />
Group and Dairy NZ to improve employment practices, and the<br />
recruitment and retention of employees in the Amuri area.<br />
We continue to run our Secondary Education School Achievers<br />
Awards, giving out $10,000 annually to assist young people to<br />
undertake further study.<br />
We continue to run our Youth Development Programme, aimed<br />
at helping young people develop skills – both leadership and<br />
technical.<br />
Our Library is supporting the INZONE Career Information<br />
Kiosk initiative. This is aimed at helping young people identify<br />
suitable career options.<br />
Create a Growth-Enhancing Tax System<br />
Tax legislation and practice are constantly changing and it can<br />
be a challenge within a small council to maintain the level of<br />
knowledge required to ensure compliance with the various<br />
tax acts. In November 2009 we commissioned Toovey Eaton<br />
McDonald Ltd to review our tax compliance. They were<br />
impressed with the overall level of compliance. A number of<br />
technical and relatively minor observations were made as part<br />
of the review for staff to action.<br />
39
www.hurunui.govt.nz<br />
Water Management<br />
Canterbury Initiatives and Background<br />
Water in Canterbury is a very topical and potentially<br />
controversial issue, subject to many studies and public scrutiny.<br />
The most wide ranging review in Canterbury to date has been<br />
the Canterbury Strategic Water Study (CSWS). Stage 1 of the<br />
CSWS, undertaken by Lincoln Environmental in response to<br />
the severe drought of 1998 and published in 2002, concluded<br />
that on an annual basis there is sufficient water in Canterbury<br />
to meet likely future demand and development, but that there<br />
were seasonal and geographic mismatches between supply and<br />
demand. The initial study concluded that water storage and<br />
distribution should be considered as part of meeting future<br />
demands for water, to supplement supply in times of low natural<br />
flows.<br />
Under the auspices of the Canterbury Mayoral Forum, and<br />
facilitated by Crown and local funding, the CSWS progressed<br />
from 2004 through to 2008, respectively identifying a wide range<br />
of potential water storage sites (Stage 2), and then undertaking<br />
initial high level desk top evaluations of a more limited<br />
number of major storage options (Stage 3). These evaluations<br />
incorporated environmental, social, cultural, recreational and<br />
economic viewpoints and included multi stakeholder group<br />
meetings. Stage 3 concluded that a range of issues, opportunities,<br />
trade-offs and concerns would need to be considered and<br />
managed for any of the storage options to be taken further. Of<br />
all the options considered, the <strong>Hurunui</strong> catchment option (up<br />
to 68,000 hectares of irrigated land) was seen to be perhaps the<br />
most viable hydrologically, albeit not without other issues and<br />
concerns for some stakeholders.<br />
The CSWS findings were subsequently put on hold (from mid-<br />
2008), while wider social, environmental and economic aspects<br />
were canvassed in a structured feedback process (in late 2008).<br />
The Canterbury Strategic Water Study itself was renamed<br />
‘Canterbury Water Management Strategy’ (CWMS) as it moved<br />
through Stage 4 reviews, which culminated in public consultation<br />
in May 2009. This eventually resulted in the publication of the<br />
finalised strategy in October and adopted by the <strong>Council</strong> in<br />
November 2009.<br />
The Wider Scene & Context:<br />
A <strong>Hurunui</strong> Perspective<br />
New Zealand’s GDP and national prosperity continues to<br />
be based on primary production and exports from the land.<br />
Recent developments at all levels seem to suggest that the<br />
country’s reliance on its land based economy will become even<br />
greater in the years ahead. <strong>Hurunui</strong> has a traditional focus on<br />
grass fed food and fibre production, and the present and future<br />
prosperity of our communities, and their wellbeing on all fronts,<br />
relies on <strong>Hurunui</strong> continuing to play to this traditional primary<br />
sector strength.<br />
The downside effects of the severe droughts of the late 1990s<br />
(which in fact triggered the initial Canterbury Strategic Water<br />
Study) are testimony to the risk of “doing nothing” with<br />
regard to future proofing our land based production, and our<br />
community prosperity. These same droughts, and downturns<br />
in the agricultural economy, led to major visible decline in<br />
<strong>Hurunui</strong>’s rural townships, and the implementation of a <strong>Hurunui</strong><br />
Tourism strategy was one of the responses. Given the pressures<br />
of the global economy, and international tourism outlook, it is<br />
highly unlikely that tourism in <strong>Hurunui</strong> could be the platform for<br />
widespread prosperity across all communities and sectors, going<br />
forward. Although tourism will be important, it will not replace<br />
traditional primary production. Further, it must be remembered<br />
that our tourism model is land based, given the attractions of<br />
our striking landscapes, the traditional North Canterbury rural<br />
character and values, the unique Hanmer Springs alpine spa<br />
village, viticulture in the Waipara Valley, and more.<br />
We believe that this issue of prosperity and the critical<br />
importance of our land based industries and exports, is even<br />
more important than many New Zealanders presently realise.<br />
World food production is coming under increasing pressure<br />
from the competing interests of bio-fuel production, climate<br />
change, world population increase, socio economic growth and<br />
development in countries such as India and China….”our planet<br />
and global communities need high quality food in ever increasing<br />
volumes, and New Zealand’s key role, historically, presently and<br />
into the future, is as an efficient and sustainable food producer<br />
and exporter. Such exports will be crucial to provide for New<br />
Zealand’s import hungry lifestyle and prosperity for all”.<br />
The subject of water is therefore of major importance to us.<br />
Given the drought prone nature of the <strong>Hurunui</strong>, we believe<br />
the future prosperity of the district can only be assured with<br />
reliable sources of water to irrigate and support an increasing<br />
proportion of its “food and fibre” producing farmland. Further,<br />
there is also an on-going challenge for us to provide plentiful<br />
domestic and stock water supplies and to meet New Zealand’s<br />
drinking water standards.<br />
We firmly believe that this <strong>Long</strong> <strong>Term</strong> <strong>Plan</strong> represents the best<br />
opportunity to demonstrate a sense of leadership, by continuing<br />
to support the CWMS through the <strong>Hurunui</strong>-Waiau Zone<br />
committee.<br />
<strong>Hurunui</strong> – Waiau Zone Committee<br />
In July 2010, the <strong>Hurunui</strong> Waiau Zone Committee was formed<br />
as a joint committee of the <strong>Hurunui</strong> <strong>District</strong> <strong>Council</strong> and<br />
Environment Canterbury. This committee was the first of the<br />
Canterbury formed ‘Zone Committees’ to be established as part<br />
of the broader Canterbury Water Management Strategy. The<br />
<strong>Hurunui</strong> Waiau Zone Committee has worked collaboratively<br />
40
<strong>Hurunui</strong> <strong>Community</strong> <strong>Long</strong> <strong>Term</strong> <strong>Plan</strong> <strong>2012</strong> - <strong>2022</strong><br />
to develop recommendations on water management in as<br />
described in the Zone Implementation Programme (ZIP). See<br />
a summary of the ZIP appended to this <strong>Plan</strong>. A full copy is<br />
available on our <strong>Council</strong> website.<br />
The Zone Committee and this ZIP are part of implementing<br />
the Canterbury Water Management Strategy (CWMS) in<br />
the <strong>Hurunui</strong> Waiau Zone. The CWMS sets as its first order<br />
priorities: environment, customary use, community supplies<br />
and stock water; with second order priorities as irrigation,<br />
renewable electricity generation, recreation and amenity. The<br />
Zone Committee recognizes that clean drinking water, land use,<br />
water quality and quantity, environmental flows and allocation<br />
for the rivers, biodiversity protection and enhancement,<br />
irrigation, hydro power development and water storage options,<br />
and the principles of kaitiakitanga are all (intimately) interrelated<br />
and must be considered as a whole rather than in isolation. The<br />
ZIP recommends actions and approaches for collaborative<br />
and integrated water management solutions to achieve the<br />
CWMS vision, “to enable present and future generations to<br />
gain the greatest economic, environmental, recreational and<br />
cultural benefits from our water resources”. In accordance<br />
with the CWMS, the Zone Committee has arrived at its<br />
recommendations through consensus.<br />
Drinking Water Quality<br />
Under this Strategy, we fully acknowledge that our focus on<br />
productive development must be matched with a similar<br />
energy and commitment to drinking water standards. See<br />
the ‘Key Issues’ and ‘Water Supply’ sections of this plan for a<br />
comprehensive explanation of our intentions to address this<br />
issue across the <strong>Hurunui</strong> district.<br />
Land and Water Quality Use Research<br />
<strong>Council</strong> will continue to support initiatives, with Enterprise<br />
North Canterbury and Environment Canterbury, and other<br />
appropriate agencies, to position <strong>Hurunui</strong> at the forefront of<br />
land use and water quality research programmes, projects and<br />
pilots in the interests of <strong>Hurunui</strong> and all rural New Zealand. We<br />
believe <strong>Hurunui</strong> is well placed to pursue this lead role, especially<br />
given our dry east coast climate and our strong relationships<br />
with entrepreneurial landowners and agencies. We believe that<br />
this is a critically important component of our overall strategic<br />
and comprehensive approach, particularly to demonstrate that<br />
the <strong>Hurunui</strong> Water Management Strategy in relation to storage<br />
and irrigation will require landowners to commit to best<br />
industry practise and the uptake of available science.<br />
Environmental, Social and<br />
Recreational Interests<br />
The environmental, social and recreational values of our<br />
rivers and lakes are critical to the <strong>Hurunui</strong>. This point cannot<br />
be overemphasised. We fully recognise this and support the<br />
concept of having healthy rivers, lakes and streams in the<br />
district. We have established a close working relationship with<br />
the Department of Conservation, Environment Canterbury<br />
and Ngai Tahu, and are extending this to other agencies and<br />
interest groups on both a general and case specific basis. (e.g.<br />
Our present work on the Waipara River is an example of our<br />
commitment to play a proactive role in facilitating solutions<br />
balancing environmental, recreational and other interests.)<br />
Advocacy<br />
It should be clear from this strategy that we see the <strong>Hurunui</strong><br />
Water Management Strategy as a critical component that has<br />
the potential to influence, positively or negatively, every aspect<br />
of wellbeing and prosperity in this district. Accordingly, we are<br />
committed to pursue every advocacy role we can, in support of<br />
the <strong>Hurunui</strong> Water Management Strategy. In particular, we will:<br />
• Continue to play a positive, proactive part in the<br />
Canterbury Water Management Strategy<br />
• Lobby Government to position any water development<br />
project that meet the aims of the ZIP as important<br />
infrastructure developments, in the interests of <strong>Hurunui</strong>,<br />
Canterbury and NZ<br />
• Maintain and/or build relationships with all key<br />
stakeholders and interest groups<br />
Conclusion:<br />
The Key Principle of “Balance”<br />
This section on Water Management as outlined has been<br />
deliberately included to recognise the importance of the<br />
strategic issue of water. We cannot over emphasise the key<br />
principle of balance that we firmly believe must be achieved if<br />
true prosperity for all is to result. This is not a strategy about<br />
irrigation and land use development at any cost. It is equally<br />
not a strategy about locking up our resources and assets for<br />
the benefit of a few, whoever they may be. The guiding themes<br />
of the <strong>Hurunui</strong> Water Management Strategy are responsible<br />
and sustainable growth and development for <strong>Hurunui</strong> and the<br />
prosperity of its communities. At the same time, it is to also<br />
protect natural and traditional environmental and recreational<br />
values, and a commitment to pursuing and applying best<br />
practice land use and water quality research, scientific advances<br />
41
www.hurunui.govt.nz<br />
in water use efficiency and water conservation. <strong>Hurunui</strong> is at<br />
the forefront of this balanced, comprehensive and critically<br />
important strategy. That is the role we are engaged in with our<br />
community’s support and encouragement.<br />
<strong>Hurunui</strong> River - Acrylic on Canvas - by Stella Sales<br />
42
<strong>Hurunui</strong> <strong>Community</strong> <strong>Long</strong> <strong>Term</strong> <strong>Plan</strong> <strong>2012</strong> - <strong>2022</strong><br />
Sustainability<br />
• Walking and Cycling Strategy – the intention is to<br />
develop a series of linking walking and cycling tracks in<br />
Introduction<br />
the <strong>District</strong><br />
Sustainability is a key ideal of the Local Government Act<br />
2002 which sets out the requirements for taking a sustainable<br />
development approach, and advises that we should take into<br />
account the social, economic, and cultural wellbeing of people<br />
and communities; the need to maintain and enhance the quality<br />
of the environment; and the reasonably foreseeable needs of<br />
future generations.<br />
These factors are relevant to most of our policies and activities,<br />
and where appropriate, we will explicitly address the ideal of<br />
sustainability in relation to these.<br />
They also tie in with some climate change issues that merit<br />
some discussion here. We are mindful of trends in these areas,<br />
and will aim for compliance with any central government<br />
initiatives, but the <strong>Hurunui</strong> <strong>District</strong> has long been subject to<br />
adverse weather events, and we do not see climate change as a<br />
matter of top priority.<br />
This <strong>Plan</strong><br />
Sustainability issues are discussed throughout the <strong>Council</strong><br />
Activities chapter of this plan where they are explicitly addressed<br />
as the “significant negative effects” and “sustainability”. In the<br />
Policies section of this plan, the topic of sustainability is raised in<br />
the Significance Policy, in which the current and future wellness<br />
of the community is taken into consideration in determining<br />
whether or not any issue is significant. It is also raised in the<br />
Revenue & Financing policy, in which the sustainability of the<br />
means of funding each <strong>Council</strong> service is considered.<br />
“Environmental Responsibility” is a key desire expressed<br />
through one of our community outcomes in this plan. This<br />
outcome is described as:<br />
A Place that Demonstrates Environmental Responsibility:<br />
• We protect our environment while preserving people’s<br />
property rights<br />
• We minimise solid waste to the fullest extent, and<br />
manage the rest in a sustainable way<br />
Other Initiatives<br />
We have a number of bylaws, strategies and other policies which<br />
consider sustainable environmental issues. These include our:<br />
• Biodiversity Strategy – this aims to ensure that the unique<br />
natural values of the district are maintained and enhanced<br />
by the council, landowners and other parties working<br />
together in partnership, voluntarily and cooperatively, in a<br />
non-regulatory framework<br />
43<br />
• <strong>Hurunui</strong> Waiau Zone Implementation Programme<br />
– the summary of this programme is included in the<br />
appendices of this <strong>Long</strong> <strong>Term</strong> <strong>Plan</strong><br />
• Smoke Free Outdoors Strategy (which is under<br />
development) – this is to encourage smoke free<br />
outdoor areas in a non-regulatory manner<br />
• Pegasus Bay Bylaw – aims to control activities and the<br />
use of land, including camping, the use of horses and the<br />
use of vehicles, on the foreshore, beaches and adjacent<br />
areas of Northern Pegasus Bay to protect the important<br />
natural values of the coastline.<br />
• Freedom Camping Bylaw – encourages people to<br />
freedom camp in a responsible manner and in designated<br />
areas to protect the environment from harm<br />
• Earthquake Strengthening Policy – sets out criteria to<br />
make buildings more likely to withstand earthquakes.<br />
The Canterbury earthquakes in 2010/11 have focused<br />
our attention on the potential for earthquake prone<br />
buildings in the <strong>District</strong> and we are in the process of<br />
reviewing these now.<br />
Climate Change<br />
A “once in 50 year flood” on 30/31 July 2008 and a “once in 25<br />
year flood” on 26 August 2008 caused widespread damage to<br />
roads, fences, floodgates and tracks. This was compounded by<br />
the fact that the floods came not long after a major drought,<br />
due to which many farmers were already struggling financially.<br />
The Ministry for the Environment warns us to expect an<br />
increase in the frequency of such extreme weather events, and<br />
compounding factors such as rising sea levels, due to “climate<br />
change” brought about by “human activity increasing the natural<br />
level of greenhouse gases in the atmosphere”.<br />
This is a controversial topic, but whether or not the floods and<br />
drought were caused by climate change, and whether or not<br />
such climate change is primarily due to human influences (there<br />
is much debate about this, even amongst the “experts”), it is<br />
clear that we need to be prepared to respond to such events in<br />
order for farming and other key activities in the <strong>District</strong> to be<br />
economically and environmentally sustainable.<br />
Potential sea level rise is also an issue we have to grapple with in<br />
the <strong>District</strong> <strong>Plan</strong> review. Some of our small coastal settlements<br />
are likely to be inundated, but the time frame for when such sea<br />
level rises may impact is dependent on updated research and<br />
modelling.
www.hurunui.govt.nz<br />
Emissions Trading / Carbon Tax<br />
The Emissions Trading Scheme was a central government driven<br />
initiative aimed at moving New Zealand towards compliance<br />
with international protocols for offsetting the human influenced<br />
drivers of climate change. With the recent change of government<br />
there has been some discussion as to whether a “carbon tax”<br />
might be a more effective way of achieving this end.<br />
Either way, it is likely that in the near future some financial<br />
compensation will be required from industries that produce<br />
emissions. In the <strong>Hurunui</strong> <strong>District</strong>, forestry and farming stand<br />
to be most affected, but until the details of the Emissions Trading<br />
Scheme (or carbon tax) are finalised, it is difficult to say precisely<br />
what the impact upon these industries will be. Federated Farmers<br />
have staff dedicated to monitoring and producing responses to<br />
these issues, and should be able to provide reliable advice to<br />
farmers on these matters in the coming years.<br />
44
<strong>Hurunui</strong> <strong>Community</strong> <strong>Long</strong> <strong>Term</strong> <strong>Plan</strong> <strong>2012</strong> - <strong>2022</strong><br />
Township Profiles<br />
46 <strong>Hurunui</strong> <strong>District</strong> Profile<br />
52 Amberley Ward Profile<br />
55 Amuri-<strong>Hurunui</strong> Ward Profile<br />
60 Cheviot Ward Profile<br />
62 Glenmark Ward Profile<br />
65 Hanmer Springs Ward Profile<br />
45
www.hurunui.govt.nz<br />
<strong>Hurunui</strong> <strong>District</strong> Profile<br />
Kaikoura<br />
<strong>District</strong><br />
46
<strong>Hurunui</strong> <strong>Community</strong> <strong>Long</strong> <strong>Term</strong> <strong>Plan</strong> <strong>2012</strong> - <strong>2022</strong><br />
Location<br />
Land Use<br />
Area<br />
Coastline<br />
Climate<br />
Population<br />
The <strong>Hurunui</strong> <strong>District</strong> is in North<br />
Canterbury, on the East Coast of<br />
the South Island, New Zealand.<br />
Predominantly rural<br />
864,640 hectares (8,646,400,000 m²)<br />
106 Kilometres<br />
Ranging from unique coastal microclimates<br />
to alpine climates<br />
The estimated total population for<br />
the <strong>Hurunui</strong> <strong>District</strong> is 11,330*,<br />
distributed between the various<br />
wards.<br />
Labour Force<br />
Labour Force <strong>Hurunui</strong> <strong>District</strong> New Zealand<br />
Unemployment Rate 2.2% 5.1%<br />
Employment<br />
Participation<br />
Main Occupations /<br />
Industries<br />
Education<br />
Education<br />
15 years and over<br />
69% 63%<br />
Agriculture &<br />
Forestry<br />
<strong>Hurunui</strong> <strong>District</strong><br />
Service & Sales<br />
New Zealand<br />
School Qualification 35.6% 40%<br />
Tertiary Qualification 36.1% 39.9%<br />
*Note: The 2011 Census was called off following the 22<br />
February Christchurch earthquake. The estimated population<br />
is from Statistic New Zealand’s population projections which<br />
uses data from the 2006 NZ Census. The Government has<br />
announced that the next census will be held in March 2013.<br />
No Formal Qual. 28.3% 25%<br />
Unless otherwise specified, statistics quoted in this section are<br />
projections based from the NZ Census 2006. Figures have<br />
been randomly rounded by Statistics New Zealand in order to<br />
protect privacy, and thus may not add up to the totals given.<br />
Population by Ward / <strong>Community</strong> Rating Area<br />
47
www.hurunui.govt.nz<br />
48
<strong>Hurunui</strong> <strong>Community</strong> <strong>Long</strong> <strong>Term</strong> <strong>Plan</strong> <strong>2012</strong> - <strong>2022</strong><br />
Population<br />
The population of the <strong>Hurunui</strong> <strong>District</strong> is predicted to grow<br />
steadily over the next 20 years, although the population of some<br />
towns in the district is dropping. The greatest proportion of<br />
growth is occurring in the Amberley and Hanmer Springs wards.<br />
Census data reveals that the <strong>Hurunui</strong> <strong>District</strong> has an aging<br />
population, and shows a steeper rise than that predicted for<br />
the country as a whole in the proportion of people aged 65<br />
and over. Ethnic diversity is lower than that of New Zealand<br />
as a whole, but there has been a marked increase in overseas<br />
migrants, especially in the 30-50 year old age group (indicating<br />
that they have come to work in the <strong>District</strong>).<br />
Recreation, Visitor Attractions, Parks<br />
and Reserves<br />
The <strong>Hurunui</strong> is one of the few places in New Zealand’s South<br />
Island that in less than two hours traveling time, you can drive<br />
from the Lewis Pass (the northern most point of the Southern<br />
Alps) with its fresh mountain air, spectacular scenery and lush<br />
beech forests, to be sitting by the coast watching the waves<br />
from the Pacific Ocean crash onto the Beach. Activities<br />
include mountain walks, skiing, thermal bathing, river sports<br />
and recreation, surfing, fishing and spectacular walks amidst<br />
salt stone cliffs on our secluded beaches. The Waipara Valley is<br />
renowned for some of New Zealand’s award winning wines, and<br />
this area offers the opportunity to discover many fine vineyards.<br />
The <strong>Hurunui</strong> has over 270 hectares of passive and recreation<br />
reserves including the world famous Hanmer Springs Thermal<br />
Pools and Spa. A significant recent addition is the former Queen<br />
Mary Hospital grounds in Hanmer Springs. The main beaches<br />
are at Leithfield, Amberley, Motunau and Gore Bay. The main<br />
recreational lakes are Lake Sumner, Lake Taylor and Lake<br />
Tennyson.<br />
Main Industries<br />
The <strong>Hurunui</strong> is continuing to experience growth and<br />
diversification in terms of industry. Historically the district<br />
has been primarily agriculture based, and this still continues<br />
to be the single largest contributor to the <strong>Hurunui</strong> economy.<br />
However, recent times have seen an expansion in both viticulture<br />
and tourism. The growth of Hanmer Springs, the district icon,<br />
as a tourist destination and the establishment of associated<br />
infrastructure, is unprecedented in the tourism sector New<br />
Zealand wide. The majority of the district’s working population<br />
are employed in the “agriculture, forestry or fishing” industries<br />
(as defined by Statistics NZ). The second largest employment<br />
industry category is “accommodation, cafes and restaurants”,<br />
followed by “health and community services”.<br />
Agri/Viticulture<br />
According to the 2007 Statistics New Zealand Agricultural<br />
Production Census, the <strong>Hurunui</strong> <strong>District</strong> is home to 1,065 farms,<br />
462 of which are sheep farms (total of 1,612,116 sheep), and<br />
130 of which are beef cattle farms (with 119,141 cattle). 53,099<br />
dairy cattle and 34,042 deer were counted in the <strong>Hurunui</strong><br />
<strong>District</strong>. The major horticultural activities in the <strong>District</strong> are<br />
grape-growing (970 hectares), followed by olives (87 hectares)<br />
and hazelnuts (25 hectares). There is a small vegetable harvest<br />
in the <strong>Hurunui</strong> <strong>District</strong> (e.g. asparagus), and we produced 9,679<br />
tonnes of barley, 3,852 tonnes of wheat, and 556 tonnes of field/<br />
seed peas during the year ended 30 June 2007.<br />
Development and Growth<br />
The <strong>Hurunui</strong> <strong>District</strong> has a highly diversified economy based<br />
around agriculture, viticulture and tourism. Both domestic<br />
and international tourism have increased significantly over the<br />
past decade in recognition of the wide array of recreational<br />
opportunities within <strong>Hurunui</strong> from the coast to the mountains.<br />
The Hanmer Springs Thermal Pools & Spa, Mt Lyford Ski Field<br />
and Waipara wine producing area are recognised as anchor<br />
destinations that have been a catalyst for business investment in<br />
the <strong>District</strong>. Statistics New Zealand has estimated the <strong>Hurunui</strong><br />
population at 2026 to be 12,350 on a medium growth projection.<br />
However because of a large absentee population owning<br />
lifestyle and holiday homes, the <strong>Council</strong> is planning for growth<br />
demands based upon trends in subdivision developments, and,<br />
upon this basis, indications are that district wide growth will<br />
be slower than what is indicated by the Statistics New Zealand<br />
projections, but the Amberley and Hanmer Springs Wards are<br />
more likely to be at the medium or even high growth rates.<br />
Health<br />
Indicators of health in the <strong>District</strong> include the Ministry of<br />
Health’s “Deprivation Index”, which has been shown to correlate<br />
with various health statistics (e.g. rates of cervical cancer,<br />
mental health problems). This index assigns deprivation scores<br />
(1 least deprived, to 10 most deprived) to each meshblock in<br />
New Zealand. Meshblocks are geographical units defined by<br />
Statistics New Zealand (containing a median of approximately<br />
87 people in 2006). Scores are based on variables like income,<br />
home ownership, unemployment, qualifications, household<br />
crowding, transportation, and access to telecomunications.<br />
These scores are assigned as measures of relative (rather than<br />
absolute) deprivation. Thus, 10% of meshblocks in New Zealand<br />
as a whole will always score 10. Scores for the <strong>Hurunui</strong> <strong>District</strong><br />
indicate much lower than average deprivation, with more than<br />
75 % of meshblocks scoring in the top half (see graph on page 14).<br />
Lower than average levels of income and education in Amberley,<br />
and lower than average home ownership in Hanmer Springs<br />
(due to holiday and workers’ accommodation) contributed to<br />
higher than expected scores for these areas (both 7).<br />
49
www.hurunui.govt.nz<br />
Rateable Value<br />
78% of our ratepayers pay their rates electronically, (eg: internet,<br />
direct debit, automatic payment etc). the remaining 22% pay by<br />
cheque or cash.<br />
Rates are levied on rateable properties based on their rateable<br />
value. The definition of land is very broad and may include the<br />
right to pass utilities over land, e.g., power lines and water<br />
pipes. Almost all lands are rateable. Exceptions apply to certain<br />
Crown land and land mainly used for educational and charitable<br />
purposes. As at June <strong>2012</strong>, the total rateable value of property<br />
in <strong>Hurunui</strong> is $4,680,288,642.<br />
Property Values by Ward<br />
Name<br />
<strong>District</strong><br />
Capital Value<br />
No of Rateable<br />
Properties<br />
Amberley 945,624,200 2,180<br />
Amuri 1,142,832,950 1,206<br />
Cheviot 622,508,900 956<br />
Glenmark 576,633,550 767<br />
Hanmer Springs 689,567,550 1,673<br />
<strong>Hurunui</strong> 524,777,000 801<br />
Utilities 132,005,000 0<br />
Value as at 1 July 2011 4,633,949,150 7,583<br />
Growth Factor (1%) 46,339,492 76<br />
Total Rating Value Assumed 4,680,288,642 7,659<br />
*Note: The <strong>Council</strong> rates an additional 1,500 properties in the Waimakariri <strong>District</strong>, which<br />
are on our Ashley Water Scheme.<br />
50
<strong>Hurunui</strong> <strong>Community</strong> <strong>Long</strong> <strong>Term</strong> <strong>Plan</strong> <strong>2012</strong> - <strong>2022</strong><br />
Services and Amenities<br />
Major services and amenities in the district are available in the<br />
following locations.<br />
Kaikoura<br />
<strong>District</strong><br />
51
www.hurunui.govt.nz<br />
Amberley Ward Profile<br />
• Amberley is about a 35 minute drive from Christchurch,<br />
Background and History<br />
Named after Amberley in Derbyshire, Amberley was originally<br />
established as a result of the arrival of the railway in 1876. The<br />
township continued to grow and became an important farming<br />
service centre. Amberley has grown significantly since the<br />
1950s and was the first township in the <strong>Hurunui</strong> <strong>District</strong> with<br />
a water supply scheme undertaken by a county council (1957).<br />
Amberley’s southern neighbour, Leithfield, is one of the oldest<br />
townships in Canterbury; Leithfield was founded in 1857 by<br />
John Leith as an important coach stop and to provide services<br />
to the surrounding farming and milling area. In 1863 Leithfield<br />
boasted one of the first flour mills in North Canterbury and<br />
the only one to be powered by wind. The village flourished in<br />
the 1870s when it was then only business centre at the time,<br />
between Kaiapoi and Kaikoura.<br />
The beach settlements of Amberley Beach and Leithfield Beach<br />
developed as residential suburbs between 1950 and 1990, and<br />
their current populations have grown dramatically.<br />
Recreation / Visitor Attractions<br />
Amberley is the largest township in the ward, located on State<br />
Highway 1, it is a busy rural service centre with an impressive<br />
range of cafes and shops as well as the vibrant district library.<br />
The ward is ideally placed as a country retreat, it is renowned<br />
for its impressive country gardens and offers a variety of<br />
accommodation options for visitors. There are very handy rivers,<br />
lakes and mountains to explore, and lots of walks including beach<br />
tracks, the Mt Grey scenic walkways and the Kowai Walkway - a<br />
well maintained track from the historic Old Leithfield Hotel to<br />
the coastal settlement of Leithfield Beach.<br />
Several parks and reserves can be found in the townships, and<br />
the local Amberley Domain and Pavilion is always popular for<br />
sport and recreation events, agricultural shows, and leisure<br />
activities.<br />
Present Profile<br />
• The population of the Amberley Ward is estimated<br />
at 4,050.<br />
• The Amberley Ward is the largest community in the<br />
<strong>Hurunui</strong> <strong>District</strong>. The ward makes up over one third<br />
of the total district population, with a steady growth in<br />
residents.<br />
• 2006 NZ Census data shows Amberley’s population<br />
profile as somewhat older that the <strong>Hurunui</strong> average.<br />
29% of Amberley’s residents are aged 65 years and over,<br />
compared to 25% for the <strong>Hurunui</strong> <strong>District</strong>, 24% for<br />
the Canterbury Region, and 21% for New Zealand as<br />
a whole.<br />
52<br />
and Leithfield is even closer. The townships’ close<br />
proximity presents an advantage for residential growth,<br />
offering commuters a country lifestyle while still being<br />
able to work in the city.<br />
• State Highway 1 runs through the centre of the<br />
Amberley Township. While this visibility and accessibility<br />
is a great strength for development and growth, it<br />
simultaneously creates challenges for road safety, noise<br />
and heavy transport effects.<br />
• Both the Amberley Township and Leithfield Village have<br />
experienced notable urban expansion and development<br />
in recent years, including increased lifestyle block<br />
development. This growth did slow during the<br />
economic crisis, but it has now taken off again post the<br />
Christchurch earthquakes, with many viewing the area<br />
as ‘less shaky’ and offering a desirable lifestyle.<br />
• The Amberley Ward also experienced substantial<br />
growth and development in the Glasnevin area, including<br />
large scale viticulture plantings, and subdivision activity.<br />
This rate of growth also eased during the economic<br />
downturn but is also taking off again.<br />
• A concept plan was developed by and for the Amberley<br />
community, and includes far reaching planning on many<br />
fronts, including urban and commercial zoning, social<br />
and recreation activities, streetscaping and branding.<br />
The Amberley Township <strong>Plan</strong> was finalised in 2008 and<br />
many of the high priority projects contained have now<br />
been completed.<br />
• The Amberley Ward offers a wide range of services and<br />
facilities.<br />
In addition to the numerous shops and commercial premises,<br />
the ward is fortunate to have three primary schools, two<br />
preschools, two Playcentres, a medical centre, a public swimming<br />
pool, a community hall and two libraries (The <strong>Hurunui</strong> Memorial<br />
Library in Amberley and a community library in Leithfield). The<br />
ward has many amenities including a cemetery and several<br />
blocks of public toilets. The Amberley Township is home to the<br />
ward’s volunteer fire and ambulance services and two full-time<br />
police officers. The <strong>Council</strong>’s main office, including the <strong>Council</strong><br />
Chambers, is located in Amberley.<br />
Ward Governance<br />
<strong>District</strong> <strong>Council</strong>lors are responsible for representing the<br />
interests of their ward, setting <strong>Council</strong> policies and monitoring<br />
the <strong>Council</strong>’s performance. They are elected every three years<br />
by the voters of their ward.<br />
The Amberley Ward is currently represented by three<br />
councillors: as at <strong>2012</strong>, they are Gary Cooper, Ross Little and<br />
Judith McKendry.
<strong>Hurunui</strong> <strong>Community</strong> <strong>Long</strong> <strong>Term</strong> <strong>Plan</strong> <strong>2012</strong> - <strong>2022</strong><br />
In addition, the Amberley Ward also has an elected Ward<br />
Committee which includes amongst its varied responsibilities<br />
the overseeing of the ward’s water and sewerage schemes, and<br />
the Amberley Recreation Reserve Subcommittee. The Amberley<br />
Ward also has the Amberley <strong>District</strong> Residents’ Association,<br />
the Leithfield and Leithfield Beach Residents’ Groups and the<br />
Amberley Beach Residents’ Association.<br />
Key <strong>Long</strong> <strong>Term</strong> Opportunities and<br />
Challenges<br />
• The worldwide economic downturn had a temporary<br />
negative effect on growth and development in the<br />
Amberley Ward. However, this is expected to reversed<br />
as people need or want to leave earthquake affected<br />
areas in Christchurch and Kaiapoi may consider buying<br />
houses and sections in the ward. Amberley Township is<br />
also popular to an increasing number of retirees.<br />
• State Highway 1 remains a major economic strength<br />
and improvements have lessened the pedestrian<br />
safety challenges for the community. The outcome of<br />
the proposed <strong>District</strong> <strong>Plan</strong> change will likely have an<br />
influence on development in upcoming years.<br />
• The number one Amberley Concept <strong>Plan</strong> (ACP)<br />
priority project that was identified was in regards to<br />
residential and commercial zoning. After a lengthy<br />
consultation process, the <strong>District</strong> <strong>Plan</strong> Changes became<br />
operative in 2009.<br />
• New <strong>District</strong> <strong>Plan</strong> provisions for independent senior<br />
living units (ISLUs) and minor dwelling units (MDUs)<br />
were made operative late last year. This enables another<br />
type of residential development that will cater for the<br />
needs of the “earthquake refugees” as well as the needs<br />
of the aging population.<br />
• The ACP identified the current centre of town location<br />
for the Amberley Transfer Station to be inappropriate,<br />
and new potential sites have since been investigated. A<br />
site in Greys Road has been identified as the preferred<br />
location and this will now be consulted on.<br />
• The need to upgrade the Amberley Swimming Pool was<br />
also highlighted during the concept planning process,<br />
and subsequent investigations have found that the pool<br />
has a limited life expectancy and that we should not rely<br />
on it after 2018. The Amberley Ward Committee, via a<br />
working group, has been further investigating options<br />
for the future including whether the current pool can<br />
be upgraded or whether a new pool should be built.<br />
Extensive consultation will be carried out prior to any<br />
final decisions being made.<br />
• A huge land bank now exists in Amberley resulting<br />
from recent plan changes which rezoned rural land to<br />
residential use.<br />
• The resource consent for the long awaited supermarket<br />
and shopping complex for Amberley was signed off in<br />
2010. Although a commitment has not yet been made<br />
by one of the major supermarket chains, this is still<br />
being pursued by the developer who remains optimistic<br />
that a deal will be completed in the near future.<br />
• The <strong>Council</strong> has adopted a Walking and Cycling<br />
Strategy, which aims to facilitate the desires made by<br />
some members of the <strong>Community</strong> to improve the<br />
Walking and Cycling linkages within the <strong>Hurunui</strong> <strong>District</strong>.<br />
Of particular importance for the Amberley Ward are<br />
the proposed commuter routes from Amberley to<br />
Amberley Beach, Amberley to Waipara, and Amberley<br />
to Leithfield.<br />
• The Amberley Ward beaches from Ashworths to “the<br />
Rocks” are included in the Northern Pegasus Bay<br />
Coastal Management <strong>Plan</strong>. This <strong>Plan</strong> contains a number<br />
of recommendations, including a requirement that all<br />
vehicles on Northern Pegasus Bay must obtain a permit<br />
and obey all conditions of the permit including, a speed<br />
limit for vehicles of 10km/h around people and 30km/h<br />
on the open beach, in addition any vehicle on the beach<br />
must be operated below the high tide mark.<br />
• The Amberley Ward’s population growth since 2008 has<br />
been slow. However, previous growth, and anticipated<br />
moderate future growth, particularly in the townships,<br />
will ultimately create a need for expanded community<br />
facilities. Further expansion and development of the<br />
Amberley Domain may become necessary. New<br />
subdivisions need to include the provision of parks,<br />
reserves and walkways. Another long term challenge<br />
to meeting population growth and developers’ and<br />
residents’ expectations for the Amberley Ward will be<br />
the possible demands to seal existing gravel roads.<br />
• The presence of State Highway 1 will continue to<br />
stimulate associated growth and development, whilst at<br />
the same time placing responsibility on the council, the<br />
community and the New Zealand Transport Agency to<br />
manage the associated effects of such traffic.<br />
• Amberley Ward’s locality acts as a valuable “gateway”<br />
to the <strong>Hurunui</strong> <strong>District</strong>, offering opportunities for<br />
further growth and profitable gains to the local tourism<br />
industry.<br />
• Impacts from the Pegasus Town development have<br />
not yet become apparent. As the town grows, a<br />
foreseeable possible adverse impact on the Amberley<br />
Ward is the additional traffic volumes creating longer<br />
commuting times between Woodend and Christchurch.<br />
Possible positive impacts include more employment<br />
opportunities and Amberley Ward could be a satellite<br />
base for staff for the new township. The proposed new<br />
High School would be the closest one to the Amberley<br />
Ward.<br />
• The Amberley Ward has nearly one third of its<br />
population aged 65 years and over (Stats NZ Census<br />
2006). The requirements of this demographic has<br />
53
www.hurunui.govt.nz<br />
different demands than the rest of the district, such as<br />
a higher need for pensioner housing and rest homes,<br />
increased medical centre usage, a preference for passive<br />
recreation facilities etc.<br />
Key Projects<br />
Year <strong>Plan</strong>ned<br />
<strong>2012</strong>/13 2013/14 2014/15 2015-<strong>2022</strong><br />
Water pipe renewal $448,773<br />
Water reticulation $260,933 $239,763<br />
Water connections $10,392 $10,738 $11,107<br />
SH1 bore commissioning $25,000<br />
Water rising main upgrade $236,500<br />
Sewerage pipe upgrade $474,000 $243,678<br />
Waste water plant renewals $12,240 $10,780 $78,256 $41,293<br />
Stormwater/drainage detention ponds $100,000<br />
Stormwater/drainage upgrading $194,000<br />
Amberley Township roadside construction $23,000 $23,902 $24,697 $201,646<br />
Leithfield Township roadside construction $10,000 $11,945<br />
Leithfield Beach Township roadside construction $5,196 $6,215<br />
Leithfield Beach <strong>Community</strong> Centre heat pump $4,000<br />
Amberley Township – Railway Tce landscaping/fencing $15,000<br />
Walking and cycling routes $250,391<br />
Amberley domain – playground improvements $4,000<br />
Amberley domain – relocate cricket nets $6,000<br />
Amberley neighbourhood reserves $264,752<br />
Amberley reserves – passive links $10,000 $10,392 $10,738 $87,672<br />
Amberley Beach reserve – tennis courts $24,858<br />
Leithfield Beach reserve – tennis courts $72,744<br />
Amberley Ward - Sample Properties<br />
Water<br />
# of Actual Proposed Increase / Decrease<br />
Capital<br />
Property<br />
Fixed Rates Rated<br />
Value Supply Units $ %<br />
Charges 2011/<strong>2012</strong> <strong>2012</strong>/13<br />
Amberley Township 255,000 Amberley 209 1 $1,464.46 $1,549.20 $84.74 5.79%<br />
Amberley Township 520,000 Amberley 238 1 $1,805.80 $1,909.12 $103.33 5.72%<br />
Amberley Beach<br />
Township<br />
175,000 Ashley Rural 0.5 1 $1,575.36 $1,647.24 $71.88 4.56%<br />
Amberley Rural 2,400,000 Ashley Rural 1 0 $3,146.30 $3,306.33 $160.03 5.09%<br />
Leithfield Township 205,000 Ashley Rural 0.5 1 $1,338.13 $1,412.35 $74.23 5.55%<br />
Leithfield Beach<br />
Township<br />
180,000 Leithfield<br />
Beach<br />
1 1 $1,219.49 $1,297.30 $77.80 6.38%<br />
54
Amuri-<strong>Hurunui</strong> Ward Profile<br />
Background and History<br />
New Beginnings<br />
<strong>Hurunui</strong> <strong>Community</strong> <strong>Long</strong> <strong>Term</strong> <strong>Plan</strong> <strong>2012</strong> - <strong>2022</strong><br />
Amuri<br />
The township of Waiau was the first of the three main<br />
settlements established in the area previously known as the<br />
Amuri Ward. It originated in the 1860s, and due to the ferry, the<br />
bridging of Waiau River, the opening of the road to Kaikoura and<br />
the completion of the railway line, soon became an important<br />
farm servicing and transport centre.<br />
The development of Rotherham as a township followed in 1877,<br />
as it was laid out in order to attract labourers to the district.<br />
Culverden was the last to be established and only so due to the<br />
arrival of the railway in 1886, consequently becoming the rail<br />
and coach, as well as the farming centre for Amuri.<br />
Over the years, the Amuri has been an area of traditional large<br />
scale farming, characterised in many cases by continuous family<br />
ownership across several generations. A secondary school<br />
department was established in Culverden in 1960, making it the<br />
third high school in the district, changing its status to an area<br />
school in 1977. The first ‘Amuri <strong>Community</strong> Health Centre’<br />
opened in Rotherham in 1982.<br />
The impact of the arrival of the dairy industry in the 1980’s<br />
has been substantial and provided enormous opportunities. The<br />
future of the industry will be heavily influenced by the potential<br />
to store water.<br />
<strong>Hurunui</strong><br />
Historically, the Waikari Township was a very busy little<br />
community with the flour mill, lime-works siding adjacent to the<br />
north bound railway line providing a lot of employment locally.<br />
It also accomodated the <strong>Hurunui</strong> County offices, an extensive<br />
council works yard. Waikari school established 1882.<br />
The nearby township of Hawarden began with a Roads’ Board<br />
cottage and a store on a route taken by thousands of gold<br />
seekers who made their way over the old Weka Pass Road in<br />
the 1860s. Later Hawarden became the service centre for a<br />
large farming area and included several businesses, a post office,<br />
a community hall and a church. Hawarden Consolidated School<br />
was a feeder from <strong>Hurunui</strong>, Medbury, Mason’s Flat and The<br />
Peaks – becoming Hawarden <strong>District</strong> High school in 1927, it<br />
was the first high school of the <strong>Hurunui</strong> <strong>District</strong>, and is now<br />
known as <strong>Hurunui</strong> College.<br />
Water supplies and sewerage works for the two townships<br />
were completed in 1966. A medical centre was first opened in<br />
Waikari in 1971. Both communities had Post Offices.<br />
Following a legislatively mandated Representation Review in<br />
2007, the Local Government Commission determined that<br />
the pre-existing individual Amuri and <strong>Hurunui</strong> Wards become<br />
amalgamated to form a new combined ward area: the Amuri-<br />
<strong>Hurunui</strong> Ward. In their determination, the Commissioners wrote<br />
that they felt there were “sufficient commonalities of interest to<br />
enable effective representation within this new combined ward<br />
area” and cited that both the <strong>Hurunui</strong> and Amuri Wards are<br />
located within the same valley and are both primarily agriculture<br />
areas with collections of small, discreet settlement areas that<br />
supported the surrounding rural hinterland. However the<br />
Commissioners also noted that the <strong>Hurunui</strong> and Amuri ward<br />
and community committees had “strong community governance<br />
arrangements” and recommended retaining these as part of the<br />
new structure.<br />
Recreation / Visitor Attractions<br />
The townships of Amuri-<strong>Hurunui</strong> epitomise small New Zealand<br />
rural towns. They are great places to relax and enjoy the local<br />
scenery and attractions.<br />
The natural outdoors paradise at the southern area of the ward<br />
features some of New Zealand’s most spectacular mountain<br />
ranges, hillside, lakes and the headwaters of the <strong>Hurunui</strong> River,<br />
as well as offering many accommodation options for visitors.<br />
Waikari is the final stop for the popular Weka Pass vintage<br />
steam railway, and the area is a photographers’ dream –<br />
resplendent with remarkable limestone rock outcrops and some<br />
breathtakingly beautiful sunsets over the ranges and hinterland.<br />
The stunning vistas can readily be taken in from the Weka<br />
Pass Walkway, and you can also climb up a local hill to view<br />
ancient Mäori rock drawings in the Weka Pass Reserve. Since<br />
1868 the historic <strong>Hurunui</strong> Hotel has provided weary drovers<br />
moving sheep from Nelson to Christchurch for stock sales with<br />
a place to rest and pick up their mail and catch up on news. As<br />
the gateway to Canterbury all the sheep entering the district<br />
were once dipped here before moving on to avoid the spread<br />
of any diseases from one region to another. The Hotel remains<br />
a classic landmark in North Canterbury and is still a great place<br />
to stop for refreshments.<br />
Just a few kilometres to the west, Hawarden is home to the<br />
well-known Flaxmere Gardens - which are Gardens of National<br />
Significance, and is the gateway to the secluded wilderness and<br />
pristine Lake Sumner Forest Park area offering excellent fishing<br />
and hunting grounds.<br />
Events of interest in the <strong>Hurunui</strong> area include the Hawarden<br />
A&P Show, Waikari annual ANZAC day fun run, ART in the<br />
Garden, and the biennial <strong>Hurunui</strong> Race and Gala Day.<br />
55
www.hurunui.govt.nz<br />
Towards the northern reaches of the ward, the delightful<br />
Culverden township offers a choice of farmstays, bed and<br />
breakfasts and gardens to enjoy, making it a great place for<br />
visitors to stay who are seeking a rural New Zealand experience.<br />
The Culverden Golf Course is an enjoyable 9-hole course with<br />
an attractive mountain backdrop. October each year is time for<br />
the famous Christmas Country Fete showcasing arts, crafts,<br />
food and wine in a garden party atmosphere.<br />
Just a short drive inland, Waiau offers some of the best access to<br />
the Waiau River, brimming with trout for the skillful angler and<br />
where the salmon run during February and March. Amuri Golf<br />
Club also has a 9-hole golf course. 26km north of Waiau, the<br />
small, privately-owned alpine resort of Mt Lyford was developed<br />
in 1986, and includes a commercial ski field and offers various<br />
facilities and services, including ski and snowboard hire,<br />
accommodation and a café, horse trekking and a riding school.<br />
Current Profile<br />
The population of The Amuri-<strong>Hurunui</strong> Ward is estimated at<br />
3,730.<br />
• The Amuri-<strong>Hurunui</strong> Ward makes up approximately 30%<br />
of <strong>Hurunui</strong> <strong>District</strong>’s population as a whole.The ward<br />
experienced modest growth in the five years from<br />
2001-2006 and Statistics New Zealand had predicted<br />
no further increase for 2011, however growth in the<br />
dairy industry is likely to have seen modest increases<br />
in population numbers – particularly in the numbers of<br />
migrant workers and their families.<br />
• The Amuri-<strong>Hurunui</strong> Ward is centrally located in the<br />
<strong>District</strong> and acts as an essential access way to the<br />
Hanmer Springs Alpine Village when travelling to and<br />
from Amberley / Waipara, or to and from Kaikoura.<br />
• The Amuri-<strong>Hurunui</strong> Ward is dominated by traditional<br />
farming, and developments in recent years include an<br />
extensive number of conversions, from traditional<br />
sheep farming to intensive irrigated dairy farming.<br />
• The Amuri-<strong>Hurunui</strong> Ward is home to Amuri Area<br />
School in Culverden and <strong>Hurunui</strong> College in<br />
Hawarden. The <strong>Hurunui</strong> Academy based in Culverden<br />
offers NZQA approved courses in outdoor education,<br />
rural skills, tourism and hospitality, and carpentry for<br />
youth and adult students. There are three primary<br />
schools, located in Waikari, Waiau and Rotherham. Preschool<br />
options include a pre-school in Culverden and<br />
Playcentres at Hawarden Culverden and Waiau. The<br />
Amuri Area School is also houses the <strong>Council</strong>’s Service<br />
Centre/Library. <strong>Hurunui</strong> College also houses the<br />
<strong>Council</strong>’s public library. A community library is based<br />
in Waiau.<br />
• The Amuri-<strong>Hurunui</strong> Ward is fortunate to have two<br />
medical centres and a hospital:<br />
• Waikari is home to the Waikari clinic (a subsidiary of<br />
Amberley Medical centre), which meets most medical<br />
needs of residents’ in the southern end of the ward.<br />
This was a purposed-designed building built in 2001 and<br />
is funded from a targeted amenity rate from what was<br />
the previous <strong>Hurunui</strong> Ward boundary area.<br />
• The new, purposed-designed, Amuri <strong>Community</strong> Health<br />
Centre in Rotherham provides for the majority of the<br />
residents’ medical needs in the northern end of the<br />
ward. The Amuri Health Centre building is funded by a<br />
targeted amenity rate on what was the previous Amuri<br />
Ward boundary area. The General Practice is owned<br />
by the Amuri <strong>Community</strong> Trust and operated by Amuri<br />
Health Care Ltd.<br />
• Waikari Hospital is set in beautiful grounds overlooking<br />
the Alps, it provides services to the local community as<br />
well as rest of the district. Services include Maternity,<br />
Continuing Care of the Elderly, General Medical, Surgical<br />
Rehabilitation, Carer Support, Respite Care, Meals on<br />
Wheels, Day Care and equipment Hire<br />
• The Amuri-<strong>Hurunui</strong> ward is fortunate to have a St John<br />
Ambulance Station based in Culverden, as well as the<br />
Hawarden–Waikari and Amuri–Waiau Volunteer Rural<br />
Fire Forces, and New Zealand Fire Service Volunteer<br />
Fire Brigades in Waikari, Culverden, Waiau and<br />
Hawarden. There is one full-time police officer working<br />
from Waikari, and two based in Culverden.<br />
Ward Governance<br />
<strong>District</strong> <strong>Council</strong>lors are responsible for representing the<br />
interests of their ward, setting <strong>Council</strong> policies and monitoring<br />
the <strong>Council</strong>’s performance. They are elected every 3 years by<br />
the voters of their ward.<br />
The Amuri-<strong>Hurunui</strong> Ward is currently represented by three<br />
councillors: as at <strong>2012</strong>, they are Marie Black, Richard Davison<br />
and Jim Harre. Mayor Winton Dalley is also from this ward but<br />
was elected ‘at large’ to represent the interests of the entire<br />
district.<br />
<strong>Council</strong> committees in the Amuri area are the Amuri <strong>Community</strong><br />
Committee, the Amuri Plains Rural Water Committee, the<br />
Balmoral Water Committee, the Waiau Rural Water Committee,<br />
the Waiau Township Water Committee, Culverden Township<br />
Water Committee and the Waiau Reserve Committee.<br />
<strong>Council</strong> committees in the <strong>Hurunui</strong> area are the <strong>Hurunui</strong><br />
<strong>Community</strong> Committee, the <strong>Hurunui</strong> Recreation (Racecourse)<br />
56
<strong>Hurunui</strong> <strong>Community</strong> <strong>Long</strong> <strong>Term</strong> <strong>Plan</strong> <strong>2012</strong> - <strong>2022</strong><br />
Key <strong>Long</strong> <strong>Term</strong> Opportunities and<br />
Challenges<br />
Reserve Committee, the Waikari Reserve and Hall Committee,<br />
and the Hawarden Recreation Reserve and Hall Committee.<br />
Water<br />
Water issues, in terms of both opportunities and challenges, are<br />
so important to the entire ward that a separate section has<br />
been included here to showcase this.<br />
• A key issue in the ward over the past 50 years and<br />
probably the next 50 is the use of water from the two<br />
main rivers, the Waiau and <strong>Hurunui</strong> for irrigation. The<br />
consequential changes to the physical environment,<br />
economic activity and most importantly to the social<br />
structure of the district is a work in progress.<br />
• The impact of the arrival of the dairy industry in the<br />
1980’s has been substantial and provided enormous<br />
opportunities. The future will be heavily influenced by<br />
the potential to store water and to utilise currently<br />
underperforming land.<br />
• It is generally accepted that the real opportunities for<br />
the ward remain with land based industries - both<br />
agriculture and recreation based. To continue to grow<br />
and develop these, the focus is on the rivers, lakes and<br />
hills.<br />
The <strong>Hurunui</strong>-Waiau Zone Committee<br />
The <strong>Hurunui</strong>-Waiau Zone Committee was the first of the 10<br />
zone committees established throughout Canterbury. In August<br />
2011, its Zone Implementation Programme (ZIP) was received<br />
by Environment Canterbury and the <strong>Hurunui</strong> <strong>District</strong> <strong>Council</strong>.<br />
This is designed to provide an integrated approach to water<br />
management in the zone while achieving the desired social,<br />
environment, cultural and economic outcomes. The committee<br />
has also agreed on its Immediate Steps Biodiversity Fund projects<br />
and work has already started on some. Projects include wetland<br />
protection, weed control in Conway River and protection and<br />
enhancement or riparain areas.<br />
<strong>Hurunui</strong> Water Project<br />
The <strong>Hurunui</strong> Water Project Ltd (HWP) proposes to develop<br />
a community irrigation scheme which includes water storage<br />
dams and hydro power generation. The resource consents<br />
sought have been delayed by the <strong>Hurunui</strong> Waiau catchment<br />
moratorium. While the moratorium was lifted on 2nd October<br />
2011 applications cannot be processed until 2 April <strong>2012</strong>.<br />
HWP’s applications will subsequently be held until 2 April <strong>2012</strong>,<br />
at which stage processing will begin.<br />
<strong>Hurunui</strong> Water Project – Waitohi Proposal<br />
This proposes to develop a series of four water storage dams<br />
on the Waitohi River to irrigate 58,500 ha of land in the <strong>Hurunui</strong>,<br />
Waipara and Kowai catchments. The dams are proposed to be<br />
located at Hurricane Gully; Seven Hills; Inches Road and in the<br />
Lower Gorge.<br />
Run-of-river water would be taken directly from the <strong>Hurunui</strong><br />
River as the predominant supply of water when it is available.<br />
When this water is not available, they intend water stored in the<br />
Waitohi River catchment to be released from the dams to meet<br />
the irrigation demand and provide hydro-electricity generation<br />
capability. Water stored within the dams will be sourced from<br />
both the <strong>Hurunui</strong> and the Waitohi Rivers.<br />
<strong>Hurunui</strong> Water Project<br />
South Branch <strong>Hurunui</strong> River and Lake Sumner Proposal<br />
This proposal involves the abstraction of water from the <strong>Hurunui</strong><br />
River, via either an intake near the confluence of the Mandamus<br />
River or an intake 1-2 kilometres upstream from the Dampier<br />
Stream confluence to irrigate approximately 42,000 hectares<br />
of land in the <strong>Hurunui</strong> and Upper Waipara catchments. Two<br />
storage structures are proposed; a dam on the South Branch of<br />
the <strong>Hurunui</strong> River and a weir structure on the main stem of the<br />
<strong>Hurunui</strong> River, just downstream of the outlet from Lake Sumner.<br />
The proposed hydro power generation will be either on the<br />
scheme distribution canal, or located at the proposed dam on<br />
the South Branch of the <strong>Hurunui</strong> River, or both.<br />
Other Key <strong>Long</strong> <strong>Term</strong> Opportunities<br />
and Challenges<br />
• A long term challenge for the Amuri Ward will continue<br />
to be overcoming the shortage of farm labour.<br />
• A recent upsurge in migrant workers has given the<br />
skill shortage a boost but has provided a new set of<br />
challenges.<br />
• It continues to be a challenge for new small businesses<br />
to find premises. Correctly zoned areas are required to<br />
meet the needs of today and the future.<br />
• Another challenge, shared by many small rural towns<br />
in New Zealand, is the viability and thus the retention<br />
of local services and businesses. Economies of scale,<br />
potential efficiencies of centralisation and greater use<br />
of technology all impact on the sustainability of small<br />
businesses and government agencies alike.<br />
• Increased fuel prices in recent years and the recent<br />
economic down turn may have a challenging impact on<br />
the ward’s economic wellbeing.<br />
• Key long term opportunities include ongoing prospects<br />
for tourist related activities and general promotion of<br />
57
www.hurunui.govt.nz<br />
businesses in the Ward.<br />
• There are potential opportunities for the wider<br />
Culverden area to become an attractive option as a<br />
residential location for employees working in Hanmer<br />
Springs.<br />
• There are potential opportunities for the wider Waikari<br />
area to be attractive option as a residential location for<br />
employees working in the vineyards in Waipara.<br />
• Continuing development of Mt Lyford as a boutique<br />
resort and ski area may benefit the ward’s long term<br />
opportunities economic development and growth.<br />
• <strong>Council</strong> has adopted a Walking and Cycling Strategy,<br />
which aims to facilitate the desires made by some<br />
members of the community to improve the walking<br />
and cycling linkages within the <strong>Hurunui</strong> <strong>District</strong>. Of<br />
particular importance for the Amuri-<strong>Hurunui</strong> ward is<br />
the completion of the commuter link between Waikari<br />
and Hawarden.<br />
Key <strong>Plan</strong>ning Assumptions<br />
The recent worldwide economic downturn had a negative effect<br />
on development, however, the significant growth in the dairy<br />
industry may have shielded the area and it is anticipated that the<br />
Amuri-<strong>Hurunui</strong> Ward has the potential for modest to substantial<br />
growth. It is also expected that the ward is able to capitalise on<br />
the benefits of tourist traffic and there is considerable potential<br />
in the relatively ‘undiscovered’ lakes area.<br />
Key Projects<br />
Year <strong>Plan</strong>ned<br />
Amuri <strong>2012</strong>/13 2013/14 2014/15 2015-<strong>2022</strong><br />
Culverden Township Roadside Construction $12,000 $12,470 $12,886 $105,206<br />
Rotherham Township Roadside Construction $4,000 $4,157 $4,295 $35,070<br />
Waiau Township Roadside Construction $6,000 $6,235 $6,443 $52,602<br />
Rotherham Hall (capital expenditure) $5,000 $2,078 $2,148 $17,534<br />
Waiau Hall – heat pump upgrade $10,738<br />
Waiau Hall – Kitchen upgrade $6,000<br />
Rotherham Pool (capital expenditure) $2,000 $2,078 $2,148 $17,525<br />
Culverden Township projects $17,000 $5,196 $5,369 $36,144<br />
Rotherham Township projects $1,500 $1,559 41,611 $13,151<br />
Waiau Township projects $2,000 $2,078 $2,148 $17,525<br />
Culverden Reserves – walking track projects $5,000 $5,196 $5,369 $43,839<br />
Rotherham Reserve (capital expenditure) $2,500 $2,598 $2,685 $21,919<br />
Mt Lyford Reserve – BBQs $1,000 $1,039 $1.074 $8,768<br />
<strong>Hurunui</strong> <strong>2012</strong>/13 2013/14 2014/15 2015/<strong>2022</strong><br />
Hawarden-Waikari water reticulation $45,637 $50,710<br />
Hawarden sewerage - desludging $103,563<br />
Hawarden sewerage - pump $4,939<br />
Hawarden sewerage – plant renewals $37,973<br />
Waikari sewerage - desludging $70,000<br />
Hawarden Township footpath construction $16,627 $80,295<br />
Waikari Township footpath construction $16,000 $17,181 $59,979<br />
58
<strong>Hurunui</strong> <strong>Community</strong> <strong>Long</strong> <strong>Term</strong> <strong>Plan</strong> <strong>2012</strong> - <strong>2022</strong><br />
Amuri-<strong>Hurunui</strong> Ward - Sample Properties<br />
Property<br />
Capital<br />
Value<br />
Supply<br />
Water<br />
Units<br />
No of<br />
Fixed<br />
Charges<br />
Actual<br />
Rates<br />
2011/<strong>2012</strong><br />
Proposed<br />
Rates<br />
<strong>2012</strong>/2013<br />
Increase/(Decrease)<br />
$ %<br />
Waiau Township 200,000 Waiau Town 147 1 $1,275.40 $1,321.31 $36.92 2.89%<br />
Rotherham Township 270,000 No water n/a 1 $1,125.37 $1,155.69 $30.33 2.69%<br />
Culverden Township 215,000 Culverden 322 1 $1,415.94 $1,459.27 $43.33 3.06%<br />
Amuri Rural 2,215,000 Waiau Rural 8 1 $8,083.30 $8,433.62 $350.31 4.33%<br />
Amuri Rural 7,725,000 Amuri Plains 7 4 $11,222.30 $11,782.84 $560.55 4.99%<br />
Hawarden Township 138,000 Hawarden-Waikari 292 1 $1,362.90 $1,405.65 $42.75 3.14%<br />
Waikari Township 175,000 Hawarden-Waikari 694 1 $1,718.89 $1,779.97 $61.08 3.55%<br />
<strong>Hurunui</strong> Rural 3,435,000 <strong>Hurunui</strong> Rural 2 1 $5,339.19 $5,774.60 $435.41 8.15%<br />
Chip Sealing, Princes Street, Waikari<br />
59
www.hurunui.govt.nz<br />
Cheviot Ward Profile<br />
Background and History<br />
Cheviot is well-known for its rural history, and from the<br />
1950s, the township of Cheviot was a relatively settled, stable<br />
community that was largely self-contained with various trades<br />
and businesses.<br />
Cheviot ward’s other settlements include Parnassus which<br />
originally had a railway station, a sole-charge school and some<br />
businesses. The famous Waiau River road/rail bridge was here,<br />
before being abandoned and replaced with a new road bridge.<br />
Prior to the opening of the old bridge in the 1930s a ferry<br />
across the river carried goods north and south. In the 1950’s the<br />
settlement of Spotswood had a hall (which is still used regularly<br />
today) and a public library. Gore Bay was a largely picnicking and<br />
holiday venue with some permanent residents, and Conway Flat<br />
had its own school. Domett, originally a railway town, is now<br />
only populated by farms, and the old Domett Railway Station<br />
has now been relocated to the main road as a cafe.<br />
The Cheviot Rural Water Supply was put in place in 1971,<br />
with further extensions in 1980. Cheviot <strong>District</strong> High School<br />
transformed to an area school in 1976, and in 1978, the<br />
township’s old hospital was converted to a medical centre.<br />
Recreation / Visitor Attractions<br />
The Cheviot area offers a variety of quality accommodation,<br />
from hotels and motels to farm stays and home stays that<br />
provide a traditional slice of kiwi life. In the township there are<br />
several cafes, a museum and a golf course.<br />
The Cheviot Hills Domain and Mansion Foundation was the<br />
original site of the historical home of the founder of Cheviot,<br />
William “Ready Money” Robinson. The front steps of the<br />
mansion are still in place, and lead into the cricket pavilion. The<br />
domain has a charming walkway and superb picnic spots. St<br />
Anne’s Lagoon, about 2 km north of Cheviot, is a popular nature<br />
reserve that used to provide Mäori settlements around the area<br />
with eel. The Sunday Craft Market is a great place to stop, with<br />
a great range of handmade crafts of very high quality available.<br />
The market is often there on Fridays too, weather permitting.<br />
Gore Bay is nature’s treasure trove, offering great surfing,<br />
amazing walks and popular camping grounds and the nearby<br />
Cathedral Gully, a spectacular weathered clay canyon. The<br />
<strong>Hurunui</strong> and Waiau Rivers are easily accessible for salmon, trout<br />
and white bait fishing, while Conway Flat is yet another stunning<br />
site for surf casting. The area’s spectacular coastline provides<br />
opportunities for watching both whales and sea birds.<br />
Current Profile<br />
The population of the Cheviot Ward is estimated at 1,340.<br />
The Cheviot Ward had a population count of 1311 in the 2006<br />
Census. It had experienced a slight decline (around 30 people)<br />
over the last two census periods. Cheviot Ward’s residents<br />
make up approximately 12% of <strong>Hurunui</strong> <strong>District</strong>’s population<br />
as a whole.<br />
State Highway 1 runs through the centre of the Cheviot<br />
Township. This is a great strength for development and growth,<br />
as it makes the township highly accessible, as well as visible,<br />
while simultaneously increasing visitor numbers through traffic<br />
and heavy transport.<br />
The importance of traditional farming is an on-going strength in<br />
the Cheviot economy.<br />
With the closure of Parnassus School, the Cheviot Ward is<br />
home to only one school now – the Cheviot Area School in the<br />
Cheviot Township.<br />
The Cheviot Medical Centre operates from an old converted<br />
building that is less than ideal for the provision of services and<br />
is unlikely to be adequate for future demand. A new purposeddesigned<br />
building or an upgrade to the existing medical centre<br />
is proposed for consideration for 2016/17.<br />
Based in the Cheviot Township are volunteer fire and ambulance<br />
services and two full-time police officers. A council service<br />
centre is also located there, and the community library is based<br />
at the Cheviot Area School. A volunteer rural fire force operates<br />
at Conway Flat.<br />
Ward Governance<br />
<strong>District</strong> <strong>Council</strong>lors are responsible for representing the<br />
interests of their ward, setting <strong>Council</strong> policies and monitoring<br />
the <strong>Council</strong>’s performance. They are elected every three years<br />
by the voters of their ward.<br />
The Cheviot Ward is currently represented by one councillor:<br />
Vince Daly.<br />
The Cheviot <strong>Council</strong> committees include the Cheviot Ward<br />
Committee, and Reserve Committees at Spotswood, Cheviot,<br />
Domett and Port Robinson.<br />
60
<strong>Hurunui</strong> <strong>Community</strong> <strong>Long</strong> <strong>Term</strong> <strong>Plan</strong> <strong>2012</strong> - <strong>2022</strong><br />
Key <strong>Long</strong> <strong>Term</strong> Opportunities and Challenges<br />
Changes to staffing at the <strong>Council</strong> Service Centre brought<br />
about an opportunity to review current services and look at<br />
opportunities for the future. After considering public feedback,<br />
the Cheviot Ward Committee’s preferred option is for a<br />
combined Service Centre/Library to be developed on the<br />
existing service centre site. Through this plan therefore, is a<br />
proposal to move the community library from the Cheviot<br />
Area School, where this is now based, into the service centre<br />
in <strong>2012</strong>/13. The school library would remain in the school. A<br />
working party is scoping and developing a plan to take to the<br />
community for further consideration before the final plan is<br />
confirmed.<br />
A growth strategy for the Cheviot township and the coastal<br />
areas, predominantly Gore Bay and Port Robinson area, was<br />
developed in 2007/08 with extensive community input.<br />
The impact of tourism and tourist traffic on local services and<br />
amenities present key long term challenges and opportunities.<br />
Changes in Cheviot Ward’s land use, such as rising numbers<br />
of vineyards, lifestyle blocks (particularly at Gore Bay and<br />
Port Robinson), irrigation, and tourism, may result in new<br />
opportunities and challenges.<br />
Key <strong>Plan</strong>ning Assumptions<br />
Population growth is projected to be restrained and Cheviot<br />
has historically lacked popularity as a retirement area (as<br />
elderly residents tend towards areas with more support<br />
services). Recent interest by some in the comparatively low<br />
cost of housing in Cheviot, indicate that some people wishing<br />
to leave Christchurch post the earthquakes, are finding the area<br />
attractive even without these supports.<br />
A new medical centre or an upgrade to the existing building is<br />
proposed for the Cheviot township in 2016/17. Full scoping of<br />
the options and extensive consultation will be carried out prior<br />
to any final decisions being made.<br />
Key Projects<br />
Year <strong>Plan</strong>ned<br />
<strong>2012</strong>/13 2013/14 2014/15 2015-<strong>2022</strong><br />
Water pipe renewal $62,352<br />
New asset pipe $60,000 $62,352 $64,428 $526,032<br />
Sewerage - plant renewals $10,994 $36,498<br />
Sewerage - desludging $77,749<br />
Sewerage - wave band correction $30,822<br />
Cheviot Ward footpath construction $25,000 $25,980 $26,845 $219,183<br />
Cheviot Ward drainage improvements $5,000 $5,000 $5,196 $5,369<br />
Cheviot Medical Centre new building $1,150,700<br />
Cheviot Library / Service Centre $100,000<br />
Cheviot Ward - Sample Properties<br />
Property<br />
Capital<br />
Value<br />
Water<br />
No of<br />
fixed<br />
Charges<br />
Actual<br />
Rates<br />
Proposed<br />
Rates<br />
Increase (Decrease)<br />
Supply Units 2011/<strong>2012</strong> <strong>2012</strong>/2013 $ %<br />
Cheviot<br />
Township<br />
170,000 Cheviot 0.5 1 $1,512.82 $1,662.99 $150.99 9.93%<br />
Cheviot Rural 2,025.000 Cheviot 2.5 2 $4,225.26 $4,686.27 $266.48 10.91%<br />
61
www.hurunui.govt.nz<br />
Glenmark Ward Profile<br />
Background and History<br />
The area of Glenmark dates back to the original owner of<br />
Glenmark station, George “Scabby” Moore. Like other<br />
Canterbury runholders he built up his property on the back<br />
of profitable pastoral farming, the generosity of his bank, and<br />
his use of cheap leasehold land. He began as the farm manager,<br />
and acquired Glenmark at auction in 1873. He paid £90,000 for<br />
38,935 acres (15,756 hectares) of freehold land, but this was<br />
linked to another 78,740 acres (31,865 hectares) of leasehold<br />
land. Eventually the run carried over 90,000 sheep and was the<br />
most valuable in the colony. Holdings on this scale were not<br />
found in the North Island.<br />
Moore was notorious as a hard employer and a bad neighbour.<br />
His station was for years Canterbury’s scabbiest run, in fact<br />
at one stage his fines for owning diseased sheep amounted<br />
to £2,400. It is believed that Moore sought to discourage<br />
prospective purchasers of his leasehold land by keeping the run<br />
infected.<br />
Waipara led the way in rural irrigation schemes by opening its<br />
No. 1 Rural Reticulated Water Supply Scheme in 1986 - the<br />
first water harvesting scheme in New Zealand. By the turn of<br />
this century the area had become a significant wine production<br />
region, accommodating fourteen wineries.<br />
The township of Waipara has its origins as a railway town, at<br />
the junction of the main trunk line and services heading west. It<br />
was famous for having the longest siding in the South Island. For<br />
many years Waipara was also home to State forestry workers<br />
and nassella tussock grubbers, but more recently it has become<br />
home to wine workers.<br />
The smaller settlement of Greta Valley was created in the late<br />
1970s, complete with amenities, a primary school, a church and<br />
a library service. Scargill owes its existence to the Christchurch/<br />
Picton railway line, while Omihi already housed some services<br />
including a primary school, a community hall and a railway<br />
station in the 1950s. The beach settlement of Motunau Beach<br />
has expanded over the past 50 years, with a third subdivision<br />
recently being developed, complementing the many earlier<br />
“traditional Kiwi baches” that characterise this settlement.<br />
The Glenmark rugby club in Omihi has produced more All<br />
Blacks than any other club in NZ -14 in all at last count!<br />
Recreation / Visitor Attractions<br />
The Waipara region is one of New Zealand’s most rapidly<br />
expanding wine areas, producing in the order of 1,000,000<br />
cases of award winning wines in an average year, including<br />
Pinot Noir, Chardonnay, Riesling, Sauvignon Blanc, Pinot Gris,<br />
Gewurztraminer, Merlot and Shiraz. Daily wine tours and<br />
personal excursions are available at many of the wineries.<br />
The Glenmark Ward also features the Glenmark railway, where<br />
one can recall the era of rural train travel with a ride in vintage<br />
former NZR passenger carriages through scenic Weka Pass on<br />
the 13-kilometre-long railway from Waipara to Waikari, using<br />
vintage former NZR steam and diesel locomotives.<br />
There are many and various accommodation options available<br />
in the area.<br />
The Motunau Beach settlement is a great place to retreat and<br />
enjoy the quiet seaside ambience. Sea fishing, marine wildlife<br />
watching and diving are just some of the great adventures on<br />
offer. In nearby Greta Valley and Scargill a peaceful, rural farming<br />
atmosphere still exists.<br />
The Canterbury regional landfill at Kate Valley is located within<br />
the Glenmark Ward. The landfill has areas of regenerating native<br />
bush and wetlands which form the nucleus of the Transwaste<br />
Tiromoana Bush Restoration plan. Transwaste are planning for<br />
Tiromoana Bush to be a major national feature, with recreational,<br />
educational and scientific opportunities for present and future<br />
generations of New Zealanders and tourists.<br />
Current Profile<br />
The population of the Glenmark Ward is estimated at 1,170.<br />
The Glenmark Ward population was 1,143 people at the time<br />
of the 2006 Census an increase of around 300 people over the<br />
previous five years. Statistics New Zealand predicts further<br />
increases for the area, but at a more modest rate than the<br />
previous five year period. Glenmark Ward’s residents make up<br />
approximately 11% of <strong>Hurunui</strong> <strong>District</strong>’s population as a whole.<br />
The Waipara Wine Valley offers ideal conditions for growing<br />
premium quality grapes, the combination of hot summer<br />
temperatures, well-drained soil and protection from the cool<br />
easterly wind makes for award winning wines. It is the fastest<br />
growing wine region in New Zealand with around 80 vineyards<br />
in the Waipara Wine Valley covers more than 1,200 hectares of<br />
plantings, including the extended Glasnevin area of the Amberley<br />
Ward). The north facing moderately sloping terrain provides an<br />
ideal sun trap for fruiting vines.<br />
The Canterbury regional landfill at Kate Valley is<br />
located within the Glenmark Ward. <strong>Council</strong> has an ongoing<br />
commitment to ensuring that this landfill operates in line with<br />
its consent conditions, and that the interests and values of the<br />
<strong>Hurunui</strong> community are effectively represented and protected<br />
throughout the planned 35 year life. A <strong>Community</strong> Trust,<br />
established and funded by the landfill company, provides financial<br />
benefits to the neighbouring community, primarily focused on<br />
Waipara. Because <strong>Council</strong> has no involvement in this Trust or its<br />
disbursements, this <strong>Long</strong> <strong>Term</strong> <strong>Plan</strong> does not take into account<br />
any community projects or developments funded by the Trust.<br />
62
<strong>Hurunui</strong> <strong>Community</strong> <strong>Long</strong> <strong>Term</strong> <strong>Plan</strong> <strong>2012</strong> - <strong>2022</strong><br />
There are three primary schools in the Glenmark Ward – Greta<br />
Valley, Omihi, and Waipara, as well as the Glenmark Playcentre.<br />
A community library, run entirely by volunteers is run from the<br />
Greta Valley School.<br />
Waipara Township is home to the ward’s New Zealand Fire<br />
Service volunteer fire brigade. Volunteer rural fire forces<br />
operate from Motunau Beach and Scargill.<br />
Ward Governance<br />
<strong>District</strong> <strong>Council</strong>lors are responsible for representing the<br />
interests of their ward, setting <strong>Council</strong> policies and monitoring<br />
the <strong>Council</strong>’s performance. They are elected every three years<br />
by the voters of their ward.<br />
The Glenmark Ward is currently represented by one councillor:<br />
• Russell Black.<br />
There is no ward committee representing the Glenmark Ward.<br />
The Glenmark Ward has, however, the Glenmark Reserve<br />
Committee, the Waipara Residents Association, the Waipara<br />
Wine Growers and the Waipara Valley Promotions. In addition,<br />
Omihi, Scargill and Motunau Beach have their own residents<br />
groups.<br />
Key <strong>Long</strong> <strong>Term</strong> Opportunities and<br />
Challenges<br />
community to improve the walking and cycling linkages within<br />
the <strong>Hurunui</strong> <strong>District</strong>. Of particular importance for Glenmark<br />
Ward is the proposed commuter route from Amberley to<br />
Waipara.<br />
The Greening Waipara project provides environmental<br />
opportunities by focusing on promoting non-regulatory<br />
indigenous and exotic biodiversity initiatives to achieve its goals<br />
relating to sustainable agricultural practices. The project is<br />
sponsored by Four Leaf Japan Co Ltd and the Bio-Protection<br />
Research Centre at Lincoln University.<br />
Drinking water continues to be a challenge for Waipara – both<br />
availability and hardness.<br />
Development proposals for the Waipara area are causing<br />
concerns regarding ‘sprawl’.<br />
Key <strong>Plan</strong>ning Assumptions<br />
The worldwide economic downturn will likely have a negative<br />
effect on growth and development in farming and associated<br />
rural activities in the Glenmark Ward. It is not expected to effect<br />
change to any large degree in the next ten years in regards to<br />
growth and development in the wine and tourism areas, resulting<br />
in the continued demands and pressures on infrastructure in the<br />
Waipara area.<br />
The Waipara growth strategy and concept plan, when<br />
completed, will identify long term opportunities for the<br />
Glenmark Ward.<br />
Last year, a number of Waipara Valley wineries and other<br />
businesses created a collaborative group to market and promote<br />
the region. This group, called Waipara Valley NZ, includes over 15<br />
wineries and other businesses and is supported and resourced<br />
by Waipara Valley Winegrowers and the <strong>Hurunui</strong> Tourism Board.<br />
Local opportunities will be afforded by the funds available from<br />
the Kate Valley <strong>Community</strong> Trust.<br />
Key long term challenges include the limited of availability of<br />
labour and housing to support Glenmark Ward’s wine industry<br />
and tourism development.<br />
Future challenges are also likely to involve pressure on local<br />
infrastructure due to an increase in Glenmark Ward’s industry<br />
and population.<br />
The <strong>Council</strong> has adopted a Walking and Cycling Strategy, which<br />
aims to facilitate the desires made by some members of the<br />
63
www.hurunui.govt.nz<br />
Key Projects<br />
Year <strong>Plan</strong>ned<br />
<strong>2012</strong>/13 2013/14 2014/15 2015-<strong>2022</strong><br />
Waipara Township water pipe renewal $20,000<br />
Greta Valley Sewerage – plant renewals $17,000 $18,255<br />
Greta Valley Sewerage – electrical/communications $2,000 $2,078 $2,148 $17,525<br />
Motunau Beach Sewerage $35,000 $144,326<br />
Glenmark Ward - Sample Properties<br />
Property<br />
Capital<br />
Value<br />
Supply<br />
Water<br />
Units<br />
No of<br />
fixed<br />
Charges<br />
Actual Rates<br />
2011/<strong>2012</strong><br />
Proposed<br />
Rates<br />
<strong>2012</strong>/2013<br />
Increase (Decrease)<br />
$ %<br />
Motunau Beach Property 390,000 <strong>Hurunui</strong><br />
Rural<br />
0.5 1 $1,467.34 $1,592.07 $124.73 8.50%<br />
Waipara Township 220.000 Waipara 66 1 $908.48 $974.51 $66.03 7.16%<br />
Glenmark Rural<br />
1,900,00 <strong>Hurunui</strong><br />
Rural<br />
7 2 $6,959.65 $7,740.85 $781.20 11.22%<br />
64
Hanmer Springs Ward Profile<br />
Background and History<br />
In its very early days, the presence of the hot springs made<br />
the Hanmer Springs township a popular visitor destination, and<br />
entrepreneurs were quick to offer accommodation for travellers<br />
and tourists. This popularity as a holiday destination continues<br />
today and many tourism and hospitality focused businesses have<br />
flourished as a result.<br />
Timber logging and milling of the surrounding forests commenced<br />
in 1900 as part of a Government scheme employing prison<br />
labour. There have been subsequent changes of ownership and<br />
operation of this forest over the years, culminating in the recent<br />
closure of local milling, and Ngai Tahu taking over ownership as<br />
part of New Zealand’s treaty settlements legislation.<br />
The well known Queen Mary Hospital site dates back to the<br />
establishment of a Soldiers Hospital in 1916, for the recuperation<br />
and rehabilitation of injured and war weary soldiers returning<br />
from the WW1 front lines. The surrounding park-like grounds<br />
and magnificent trees add to the special value of this nationally<br />
recognized heritage site.<br />
In late 2008 the council and the New Zealand Government<br />
reached an agreement that has secured the future of a<br />
substantial six hectares of the old Queen Mary Hospital site<br />
in public ownership for present and future generations of New<br />
Zealanders. The Crown vested the land and protected Heritage<br />
buildings in the <strong>Council</strong> in 2010. Most recently the Hanmer<br />
Springs Township has undergone a facelift through the Hanmer<br />
Springs Growth Strategy. The upgrade of the town centre was<br />
completed in 2010. Ongoing upgrades have been applied to the<br />
reserves and walkways in the area.<br />
<strong>Community</strong> Board Vision<br />
The Hanmer Springs <strong>Community</strong> Board has a vision for Hanmer<br />
Springs as a place for all to live, work and play. Their vision is;<br />
“a place for all ages and stages of life, with a focus on community<br />
growth, provide a sustainable environment for people to visit and live,<br />
and expand the tourism opportunities of the area.”<br />
Recreation / Visitor Attractions<br />
Situated in a high country basin, the small, natural alpine spa<br />
village of Hanmer Springs has been a favourite retreat for<br />
generations of New Zealanders. The award winning Hanmer<br />
Springs Thermal Pools and Spa complex is a major draw card,<br />
and the pristine alpine environment with its forests, rivers<br />
and mountains enhance its appeal as the ultimate year round<br />
destination.<br />
<strong>Hurunui</strong> <strong>Community</strong> <strong>Long</strong> <strong>Term</strong> <strong>Plan</strong> <strong>2012</strong> - <strong>2022</strong><br />
There’s a substantial variety of accommodation available,<br />
complimented by delightful restaurants, cafés, boutique shopping,<br />
galleries and craft shops.<br />
Hanmer Springs offers activities for all tastes and fitness levels,<br />
with numerous walkways, golf, horse riding and mountain biking<br />
options available. There are opportunities for pure relaxation<br />
with massage & wellness treatments or blood pumping, thrill<br />
seeking adventures such as jet boating, white water rafting,<br />
bungee jumping, and four- wheel driving.<br />
The newly vested St James Station Conservation Area and Queen<br />
Mary Hospital site will also provide both locals and visitors with<br />
exciting new opportunities for recreational activities.<br />
Current Profile<br />
• The population of the Hanmer Springs Ward is<br />
estimated at 1,040.<br />
• With more than 600 holiday homes in the Hanmer<br />
Springs and its popularity as a tourist destination, the<br />
number of people in the area during peak holiday times<br />
can be as high as 6,000<br />
• The hospitality industry is the single largest employer<br />
in the Hanmer Springs Ward, employing around 30% of<br />
the ward’s full time workers<br />
• Hanmer Springs has always promoted a general ‘health<br />
and wellness’ theme<br />
• There are local town planning controls in place in the<br />
Hanmer Springs Township to ensure that the look and<br />
feel of this special alpine spa village are preserved for<br />
future generations<br />
• The Hanmer Springs Thermal Pools and Spa is an award<br />
winning tourist attraction. Owned by the <strong>Hurunui</strong><br />
<strong>District</strong> <strong>Council</strong>, the complex hosted 527,801 visitors<br />
during the twelve months ending June 30th 2011. From<br />
2009-11 the Thermal Pools and Spa had an increase in<br />
visitor numbers of 4%. The surpluses achieved at the<br />
Hanmer Springs Thermal pools & Spa were $2,064,966<br />
in 2009/2010 and $2,131,000 in 2010/2011. From these<br />
surpluses, a total of $3,492,460 was transferred from<br />
the Thermal Pools surplus for the funding of district<br />
wide reserves. For the 2011/<strong>2012</strong> year, the amount<br />
to be transferred from the Thermal reserve to offset<br />
the costs of reserves throughout the <strong>District</strong> has been<br />
budgeted at $2,021,372<br />
• The Hanmer Springs Township is home to one primary<br />
school, a child care centre and a Playcentre. <strong>Council</strong><br />
also runs a service centre/ library in the township<br />
65
www.hurunui.govt.nz<br />
• In response to growth and demand, a purpose designed<br />
medical centre was built in Hanmer Springs in 2008<br />
• Hanmer Springs has a combined emergency response<br />
facility which houses Fire, Police, and Ambulance<br />
services<br />
Ward Governance<br />
<strong>District</strong> <strong>Council</strong>lors are responsible for representing the<br />
interests of their ward, setting <strong>Council</strong> policies and monitoring<br />
the <strong>Council</strong>’s performance. They are elected every three years<br />
by the voters of their ward.<br />
The Hanmer Springs Ward is currently represented by one<br />
councillor:<br />
Michael Malthus (who is also Deputy Mayor).<br />
In addition, the Hanmer Springs Ward has the publicly elected<br />
Hanmer Springs <strong>Community</strong> Board. The current representatives<br />
on the Board are;<br />
Jason Fletcher (Chair)<br />
Bill Clarkson<br />
Rosemary Ensor<br />
Kate Poiner<br />
Chris Preston<br />
Hanmer Springs also has its own Business Association.<br />
Key <strong>Long</strong> <strong>Term</strong> Opportunities and<br />
Challenges<br />
<strong>Community</strong>:<br />
• Target local population by 2023 of 1500 people<br />
• Provide housing for all ages and stages of life<br />
• Be a recognised sustainable community<br />
• Provide access to affordable housing for the retired and<br />
those on low incomes<br />
• Provide village wide high speed broadband connectivity<br />
• Extend the pedestrian friendly approach to the town<br />
• Ensure the Queen Mary Hospital opportunities are<br />
realised for both the business community and the<br />
residents<br />
Commercial and Tourism:<br />
• A long term challenge for the Hanmer Springs Ward is<br />
to maintain annual visitor growth<br />
• The vesting of the 6 hectare reserve area on the Queen<br />
Mary site represents a substantial opportunity for the<br />
Hanmer Springs Ward and the district<br />
• The Track Network provides a great opportunity to<br />
add to Hanmer’s visitor attractions<br />
• <strong>Long</strong> term security of access to the forests that<br />
surrounds Hanmer.<br />
• The high country areas are some of the best in new<br />
Zealand and offer visitors unique and easy access.<br />
• Maximisation of the commercial Zoned area in the<br />
village<br />
• Hanmer Springs needs to tap into the conference<br />
market<br />
• Hanmer Springs needs better community facilities in<br />
order to attract and keep people<br />
Infrastructure:<br />
• Improved access to the high-country will open up great<br />
opportunities for further tourism development<br />
• Entry at State highway 7 and 7a needs to be safer and<br />
more user friendly<br />
• Environment Canterbury has made it a requirement<br />
that we improve the quality of sewage outfall.<br />
• Peak loading for water needs to be safe guarded<br />
Key <strong>Plan</strong>ning Assumptions<br />
The Hanmer Springs area is predicted to continue to grow at<br />
above district average rates. Whilst there are some important<br />
challenges facing tourism, it is assumed that on balance whilst<br />
there has been an impact from the economic downturn on<br />
international travel, the Christchurch/Canterbury market has<br />
continue to grow, further strengthening the already strong<br />
demand for holiday homes.<br />
Hanmer Springs is a popular location for retirees and those able<br />
to work from home. It is predicted that as telecommunications<br />
and technology advance over the coming years, this market will<br />
further increase.<br />
The key projects table on the next page sets out the work we<br />
are planning over the next ten years. In addition, we are also<br />
keen to:<br />
• Seek accreditation as a sustainable community<br />
• Provide Village wide high speed broadband connectivity<br />
• Seek continued funding and upgrading of the Track<br />
Network<br />
• Look at the purchase the Heritage Forrest and link to St<br />
James walking/cycling /horses and extend to Woodbank<br />
Road and Clarence Valley<br />
• Improve the roads and access to the high-country<br />
66
<strong>Hurunui</strong> <strong>Community</strong> <strong>Long</strong> <strong>Term</strong> <strong>Plan</strong> <strong>2012</strong> - <strong>2022</strong><br />
• Improve the entry at State highway 7 and 7a<br />
• Improve the sewage out fall water quality to meet<br />
ECAN requirements<br />
• Start looking at water supply for 2023<br />
Key Projects<br />
Year <strong>Plan</strong>ned<br />
<strong>2012</strong>/13 2013/14 2014/15 2015-<strong>2022</strong><br />
Land purchased for water treatment $140,000<br />
Water – renewal reticulation (from Asset Management <strong>Plan</strong>) $623,656<br />
New sewerage monitoring bores - disposal $555,350<br />
New sewerage monitoring bores - desludging $93,528<br />
Stormwater – Capital Expenditure $62,352 $154,086<br />
Sewer Improvements $220,000 $1,288,560<br />
Roading - renewals $15,000 $15,588 $16,107 $131,511<br />
Roading – new construction $45,000 $46,764 $48,321 $394,527<br />
Street lighting $15,000 $15,588 $16,107 $131,511<br />
Hanmer Springs Hall – stage upgrade $10,000<br />
Hanmer Springs Hall – extension $193,284<br />
Sports ground upgrade $30,000<br />
Exercise equipment $35,000<br />
$1,077,<br />
379<br />
Additional seating $3,000 $2,078 $1,074<br />
BBQ equipment – Brooke Dawson $5,000<br />
BBQ equipment – Tarndale $5,196<br />
Reserve capital projects $10,000 $10,392 $10,738 $87,681<br />
Conical Hill Walkway Project $119,450<br />
New welcome sign on SH7 $70.000<br />
Hanmer Springs Ward - Sample Properties<br />
Property<br />
Hanmer Springs<br />
Township (Tourism)<br />
Hanmer Springs<br />
Township<br />
Hanmer Springs<br />
Rural<br />
Capital<br />
Value<br />
Supply<br />
Water<br />
Units<br />
No of<br />
fixed<br />
Charges<br />
Actual Rates<br />
2011/<strong>2012</strong><br />
Proposed<br />
Rates<br />
<strong>2012</strong>/2013<br />
Increase (Decrease)<br />
$ %<br />
405,000 Hanmer Springs 215 1 $2,061.62 $2,142.58 $80.96 3.93%<br />
430,000 Hanmer Springs 27 1 $1,626.17 $1,689.71 $63.53 3.91%<br />
3,325,000 No Water n/a 1 $4,267.03 $4,464.69 $197.67 4.63%<br />
67
www.hurunui.govt.nz<br />
<strong>Council</strong> Activities<br />
69 Introduction<br />
71 Water Supply<br />
79 Sewerage<br />
84 Stormwater and Drainage<br />
88 Roads and Footpaths<br />
94 <strong>Community</strong> Services and Facilities<br />
96 <strong>Community</strong> Services<br />
102 Property<br />
108 Reserves<br />
112 Environment and Safety<br />
115 Emergency Services<br />
119 Resource Management<br />
122 Compliance and Regulatory<br />
Functions<br />
126 Waste Minimisation<br />
130 <strong>District</strong> Promotion<br />
135 Hanmer Springs Thermal Pools and Spa<br />
141 Governance<br />
68
<strong>Council</strong> Activities<br />
Introduction<br />
In this section, you will find detailed information about our plans<br />
for the next ten years, with particular focus on the next three<br />
years. Our work is grouped into nine categories:<br />
1. Water Supply<br />
2. Sewerage<br />
3. Stormwater and Drainage<br />
4. Roads and Footpaths<br />
5. <strong>Community</strong> Services and Facilities<br />
6. Environment and Safety<br />
<strong>Hurunui</strong> <strong>Community</strong> <strong>Long</strong> <strong>Term</strong> <strong>Plan</strong> <strong>2012</strong> - <strong>2022</strong><br />
<strong>Community</strong> Outcomes and Activity<br />
Groupings<br />
Our community outcomes express what we want to achieve<br />
through the delivery of a particular group of activities. The<br />
chart on the next page shows how the groups of activities are<br />
linked to specific community outcomes.<br />
<strong>Plan</strong> Review/Public Consultation<br />
This long term plan will be comprehensively reviewed each three<br />
years. Before it is finalised each time by the <strong>Council</strong>, the public<br />
will have the opportunity to give their opinion on any aspect<br />
of the draft plan beforehand through a special consultative<br />
procedure. Parts of the plan may be reviewed at other times if<br />
circumstances alter what we had intended in the plan. The next<br />
long term plan review is due in 2015.<br />
7. <strong>District</strong> Promotion<br />
8. Hanmer Springs Thermal Pools and Spa<br />
9. Governance<br />
The following pages go into detail about each category and its<br />
associated activities. The format for each is similar and although<br />
some information is relevant for some activities and not for<br />
others. In each of the groups of activities, you will be able to<br />
find out:<br />
• <strong>Council</strong>’s overall aim in relation to the activity<br />
• Background to the activity<br />
• How the activity will contribute towards the<br />
achievement of our community outcomes<br />
• What the current situation is in relation to the activity<br />
• What council’s future plans are in relation to the activity<br />
• How the activity is funded<br />
• How the activity is maintained and operated<br />
• What significant negative effects are caused through the<br />
activity<br />
• Assumptions and risks that are associated with the<br />
activity<br />
• How we measure or monitor our progress<br />
• Financial forecasts<br />
69
www.hurunui.govt.nz<br />
Contribution to <strong>Community</strong> Outcomes<br />
<strong>Community</strong> Outcomes<br />
Groups of<br />
<strong>Council</strong> Activities<br />
A desirable<br />
and safe place<br />
to live<br />
A place where our<br />
traditional rural<br />
values and<br />
heritage make<br />
<strong>Hurunui</strong> unique<br />
A place with a<br />
thriving local<br />
economy<br />
A place that<br />
demonstrates<br />
environmental<br />
responsibility<br />
A place with<br />
essential<br />
infrastructure<br />
Water Supply ü ü<br />
Sewerage ü ü ü<br />
Stormwater and<br />
Drainage ü ü<br />
Roads and Footpaths<br />
ü<br />
<strong>Community</strong> Services<br />
and Facilities ü ü<br />
Environment and Safety ü ü<br />
<strong>District</strong> Promotion<br />
ü<br />
Hanmer Springs Pools<br />
and Spa ü ü<br />
Governance<br />
ü<br />
70
Water Supply<br />
Overview<br />
Water Supply covers the following activity described below:<br />
Activity 1: Water Supply (township supply and rural water<br />
schemes)<br />
Our Aim<br />
To provide a sustainable supply of water that meets the needs<br />
of present and future domestic and agricultural/horticultural<br />
consumers, and complies with the New Zealand Drinking Water<br />
Standards.<br />
Why is the <strong>Council</strong> Involved?<br />
The subject of water is of major importance to our <strong>Council</strong>. It is<br />
an on-going challenge for us to provide a plentiful water supply,<br />
particularly given the drought prone nature of the <strong>Hurunui</strong>,<br />
and to have water that is of a good drinking standard while at<br />
the same time operating an efficient and cost effective service.<br />
Water is of primary importance to any community and has a<br />
direct influence and impact on the economic, social, cultural and<br />
environmental wellbeings of our population.<br />
<strong>Community</strong> Outcomes<br />
The Water Supply activity described in this section, primarily<br />
contributes to two of our community outcomes:<br />
1. A desirable and safe place to live:<br />
• We have attractive well designed townships<br />
• Communities have access to adequate health and<br />
emergency services and systems and resources<br />
are available to meet civil defence emergencies<br />
• Risks to public health are identified and<br />
appropriately managed<br />
2. A place with essential infrastructure:<br />
• We have a strong emphasis on service delivery<br />
across all infrastructure including roading, water<br />
(for drinking and development), waste water,<br />
stormwater and solid waste<br />
Major Projects <strong>Plan</strong>ned<br />
Project<br />
Renewal reticulation -<br />
Amberley<br />
Commission SH1 bore -<br />
Amberley<br />
Rising Main upgrade -<br />
Amberley<br />
Renew and upgrade pipes<br />
and fittings – Ashley Rural<br />
Mixed Oxidant treatment<br />
plant – Ashley Rural<br />
Water security (tank farm)<br />
– Culverden Township<br />
Drinking Water Standards<br />
Stage I – Waiau Township<br />
Mixed Oxidant treatment<br />
plant – Waiau Rural<br />
<strong>Hurunui</strong> <strong>Community</strong> <strong>Long</strong> <strong>Term</strong> <strong>Plan</strong> <strong>2012</strong> - <strong>2022</strong><br />
Year <strong>Plan</strong>ned<br />
<strong>2012</strong>/13 2013/14 2014/15<br />
$25,000<br />
$236,500<br />
$170,000 $124,704<br />
$90,000<br />
$205,000<br />
$98,000<br />
$51,960<br />
Renew pipework- Cheviot $62,352<br />
Mixed Oxidant treatment<br />
plant (Main, Parnassus,<br />
Blythe, Kaiwara) - Cheviot<br />
Pipe renewal – Waipara<br />
Township<br />
Mixed Oxidant treatment<br />
plant – Waipara Township<br />
Land purchase water<br />
treatment – Hanmer<br />
Springs<br />
Renewal mechanical –<br />
<strong>Hurunui</strong> Rural<br />
Renewal pipe – <strong>Hurunui</strong><br />
Rural<br />
Mixed Oxidant treatment<br />
plant (#01, Peaks, L.<br />
Waitohi) – <strong>Hurunui</strong> Rural<br />
$293,000<br />
$20,000<br />
$98,000<br />
$140,000<br />
$260,933<br />
$128,856<br />
$25,000 $25,980 $26,845<br />
$120,000 $124,704 $128,856<br />
$269,000<br />
Significant Negative Effects<br />
There is potential for significant negative effects on the<br />
environmental and cultural wellbeing of the community if there<br />
is excessive abstraction of water. Abstraction is managed to<br />
minimise the chance of outages or disruption to supply. There<br />
are also potential negative public health effects in providing<br />
water in some areas that does not meet current drinking water<br />
guidelines for biological contaminants. We issue public “boil<br />
water” notices when positive samples are detected. We are<br />
working toward improving the standard of our water supply to<br />
71
www.hurunui.govt.nz<br />
meet the New Zealand drinking water standards over the next<br />
10 years or so. Ultimately, we aim to negate the need for boil<br />
water notices in the future.<br />
Development contributions are being collected to offset the<br />
negative economic effects on ratepayers of upgrades of supplies<br />
in the <strong>District</strong> that are necessary to cater for growth. Such<br />
upgrades will help to ensure that the present level of provision<br />
of water supply services is sustainable.<br />
Emergency Management<br />
In an emergency, particularly a civil defence emergency, we will<br />
continue to deliver services as long as it is safe and practical to<br />
continue to do so. Water is a priority commodity at any time,<br />
and no less so in the event of a civil emergency. Every effort<br />
will be made to maintain our water services in an emergency<br />
situation, or when major damage has occurred for whatever<br />
reason.<br />
Financial Summary<br />
A financial summary for this group of activities is shown at the<br />
end of the Water Supply activity.<br />
72
Activity 1: Water Supply<br />
Overview<br />
The Water Supply activity includes the various functions of rural<br />
and township water supplies.<br />
Current Situation<br />
The quality and quantity of drinking water in the <strong>Hurunui</strong><br />
<strong>District</strong> remains a concern and priority for us.<br />
There are currently 13 <strong>Council</strong> owned water schemes in the<br />
<strong>District</strong>, extracting water from 22 different sources, five others<br />
are for emergency backup supply if required. Eight of these intake<br />
sources are on permanent boil water notices (method used for<br />
killing any bacteria, viruses, ova and cysts that may be present<br />
in potentially contaminated water). The schemes are overseen<br />
by Water Committees with delegated responsibilities for the<br />
planning and development of their schemes, alongside council<br />
officers. A schedule of the water schemes is included within<br />
this section. On-demand water is supplied to 8 of the urban<br />
communities in the district; these being from 7 high pressure<br />
schemes consisting of 9 water intakes and 60 km of pipe.<br />
Other small urban communities (Leithfield, Cheviot, Gore Bay,<br />
Rotherham, Greta Valley, Amberley Beach and Motunau Beach)<br />
are supplied via tanks from restricted rural supplies. All rural<br />
communities in the district are serviced by <strong>Council</strong> operated<br />
restricted-flow water supplies providing water to consumers<br />
as “units” of water supplied into individual tanks. One unit is<br />
1800 litres supplied over 24 hours, except for Balmoral and<br />
Amuri Plains, where a unit is 1000 litres per day. The <strong>Hurunui</strong><br />
and Cheviot Rural Water Schemes cover four separate supplies<br />
within each of their areas. The Ashley Scheme also has four<br />
distinct intake sources and includes part of the Waimakariri<br />
<strong>District</strong> within its boundaries.<br />
All townships with on-demand supplies, except Leithfield Beach<br />
have metered connections and charges are made on actual<br />
water consumption used.<br />
The levels of service for our water supplies can be found in<br />
the appendices section of this plan. These levels of service are<br />
monitored internally and will not be reported in the Annual<br />
Report.<br />
<strong>Plan</strong>s for the Future<br />
The availability of safe drinking-water for all New Zealanders,<br />
irrespective of where they live, is a fundamental requirement<br />
for public health. The revised Drinking-Water Standards are<br />
a significant achievement in New Zealand’s endeavours to<br />
maintain and improve the quality of drinking-water.<br />
Since the publication of Drinking-Water Standards for New<br />
Zealand 2000, the approach to managing drinking-water has<br />
changed. The focus has moved from quality control to a broader<br />
approach of quality assurance. This has been necessary due<br />
to changes in technology, an improvement in our scientific<br />
<strong>Hurunui</strong> <strong>Community</strong> <strong>Long</strong> <strong>Term</strong> <strong>Plan</strong> <strong>2012</strong> - <strong>2022</strong><br />
knowledge and the requirement to address a broader range of<br />
issues than previously covered. This change has been managed<br />
though the Drinking-Water Standards for New Zealand 2005<br />
(revised 2008) (DWSNZ).<br />
The Health (Drinking Water) Amendment Act 2007 amended<br />
the Health Act 1956 to require all drinking-water suppliers<br />
providing water to consumers to develop and start to implement<br />
a Public Health Risk Management <strong>Plan</strong> (PHRMP) to guide the safe<br />
management of each minor drinking-water supply (501 to 5000<br />
consumers) before 01 July 2014 onwards. A Public Health Risk<br />
Management <strong>Plan</strong> is a tool to help suppliers identify, manage and<br />
minimise events that would cause water quality to deteriorate.<br />
This amendment marks a milestone in New Zealand in that, for<br />
the first time, all drinking-water suppliers have a duty to ensure<br />
their drinking-water supply is safe to drink.<br />
The three main themes covered by the DWSNZ are maximum<br />
acceptable values (water quality standards for microbial,<br />
chemical and radiological determinants); the compliance criteria<br />
and reporting requirements; and lastly, the remedial actions to be<br />
taken when non-compliance is detected. The quality of the water<br />
that is provided will continue to be governed by the DWSNZ,<br />
which prescribes the maximum allowable concentrations of<br />
potentially harmful contaminants that may be present in the<br />
drinking-water supplied.<br />
The penalties for failing to comply with DWSNZ are very severe<br />
($200,000 plus for a continuing offence, and $10,000 for each<br />
day of continued non-compliance). Accordingly, we have worked<br />
hard with our local water and ward committees to ensure that<br />
the requirements under DWSNZ are met within the PHRMP<br />
compliance times specified, with latitude for affordability.<br />
Six of our 22 water supply sources are defined as “minor”<br />
supplies, which require PHRMP compliance with the Act by 1<br />
July 2014. Of these seven intakes; three have approved PHRMP’s,<br />
one has a current drafted PHRMP (to be submitted to Ministry<br />
of Health (MoH) for endorsement); two are currently being age<br />
tested (deep water secure sources); and the remaining one is<br />
currently being drafted. The other 16 drinking water sources<br />
are categorised as either “small”, “neighbourhood” or “rural<br />
agricultural” with PHRMP compliance timeframes of 01 July<br />
2015, 2016 or later than 2016 respectively. Table 1 in this section<br />
details the situation for all of our drinking water supplies.<br />
The cost to fully comply with DWSNZ is currently estimated at<br />
an additional $14 million (capital works) and a further $484,000<br />
per annum (operational costs) in today’s dollar value. Initial<br />
discussions with the Ministry of Health (Canterbury <strong>District</strong><br />
Health Board) indicated that we must meet physical compliance<br />
no later than three years after the final compliance approval<br />
date for the PHRMP, for each shallow at-risk intake source.<br />
This comes at a huge capital expenditure from 2017 to 2020.<br />
We have raised with MoH, the affordability issue for a small<br />
73
www.hurunui.govt.nz<br />
rural council such as ours to meet these exorbitant costs. We<br />
arrived at a proposed compromise to achieve full DWSNZ<br />
compliance no later than ten years after the final approval date<br />
for the respective PHRMP. The expectation from the MoH<br />
is that we will, as a minimum, provide drinking-water to our<br />
consumers that is bacteriologically free (meets compliance for<br />
maximum acceptable e-coli contamination levels, but is still safe<br />
to consume). Furthermore, we will show that we are making<br />
provision for the impending capital cost impact through years<br />
2024 to 2027 through a district-wide general rated scheme, thus<br />
mitigate a repeated affordability argument in years to come. All<br />
currently approved PHRMP’s will require a review to include<br />
this MoH endorsed strategic approach.<br />
We are planning to meet the drinking water standards in two<br />
phases. The first will involve installing Miox treatments in each<br />
of the nine at risk water intakes in the <strong>2012</strong>/13 year. This will put<br />
an end to our ‘boil water’ notices. The second phase involves<br />
the actual upgrading to full compliance and the Miox treatments<br />
will end. This last phase will occur between 2024 and 2027.<br />
We have been undertaking a pipe replacement programme<br />
over the past few years, and due to the extensive nature of the<br />
<strong>Hurunui</strong> <strong>District</strong>, this will continue for many years to come.<br />
Funding<br />
Operational Costs:<br />
Restricted Supply<br />
• As a local Uniform Annual Charge on water unit<br />
entitlement.<br />
Unrestricted Supply<br />
• Fixed costs – As a local Uniform Annual Charge.<br />
Variable costs<br />
• As a set price based per cubic meter of water as<br />
recorded by the individual water meters.<br />
Depreciation<br />
• <strong>Council</strong> does not cash fund depreciation on its assets.<br />
Instead, it builds up a fund for future maintenance<br />
through rating at a higher level than required to meet<br />
the operating costs. See the Statement Concerning<br />
Balancing of the Budget on page 33.<br />
Capital Costs:<br />
• Significant <strong>Council</strong> capital expenditure will be funded<br />
by loan for the life of the investment pursuant to the<br />
Internal Financing Policy.<br />
• If loans are not raised then it will be treated as a fixed<br />
cost and funded from annual rates.<br />
via Development Contributions.<br />
• Landowners with new connections will pay the cost of<br />
connecting to the nearest main plus, if a new subdivide,<br />
putting in the sub-main and any levies as specified in the<br />
Development Contributions policy.<br />
• Property owners wanting new connections will pay<br />
those costs necessary for the connection.<br />
Loan Repayments<br />
• Significant <strong>Council</strong> capital expenditure should be funded<br />
by loan for the life of the investment. Repayment of the<br />
loan will be treated as a fixed cost and will be funded<br />
from a local Uniform Annual Charge.<br />
Table 1: Water Supply Source Definitions (re MoH criteria)<br />
Source Type Population Category<br />
Effective<br />
Date<br />
Amberley Town<br />
• SH1, Leithfield Well 1300 Minor 2014<br />
Amberley Beach<br />
• Kowai Well 630 Minor 2014<br />
Amuri Plains Well 400 Small 2014<br />
Ashley Rural<br />
• Main intake<br />
• Mays<br />
• Racecourse<br />
Road<br />
Well<br />
Well<br />
Well<br />
2750<br />
500<br />
450<br />
Minor<br />
Small<br />
Small<br />
2014<br />
2015<br />
2015<br />
Balmoral Rural Gallery 200 small 2015<br />
Cheviot Rural<br />
• Waiau River<br />
• Blythe<br />
• Kaiwara<br />
• Parnassus<br />
Well<br />
Well<br />
Gallery<br />
Well<br />
1340<br />
65<br />
162<br />
100<br />
Minor<br />
Neighbourhood<br />
Rural Agriculture<br />
Neighbourhood<br />
2014<br />
2016<br />
2016<br />
2016<br />
Culverden Well 475 Small 2015<br />
Hanmer Town Gallery 1,500 Minor 2014<br />
Hawarden / Well 750 Minor 2014<br />
Waikari<br />
<strong>Hurunui</strong> Rural<br />
• No. 1<br />
• Peaks<br />
• Upper<br />
Waitohi<br />
• Lower<br />
Waitohi<br />
Gallery<br />
Well<br />
Gallery<br />
Gallery<br />
600<br />
100<br />
400<br />
300<br />
Rural Agriculture<br />
Neighbourhood<br />
Rural Agriculture<br />
Rural Agriculture<br />
2016<br />
2016<br />
2016<br />
2016<br />
Leithfield Beach Well 150 Small 2015<br />
Waiau Rural Well 240 Rural Agricultural 2016<br />
Waiau Town Well 420 Small 2015<br />
Waipara Town Well 300 Small 2015<br />
• If any of the Capital Expenditure caters for future growth<br />
of the scheme, then that portion of the expenditure<br />
that relates to growth may be funded from future users<br />
74
<strong>Hurunui</strong> <strong>Community</strong> <strong>Long</strong> <strong>Term</strong> <strong>Plan</strong> <strong>2012</strong> - <strong>2022</strong><br />
<strong>Council</strong> Owned Assets<br />
13 water schemes:<br />
On Demand Water Schemes (Urban)<br />
1. Amberley<br />
2. Leithfield Beach<br />
3. Culverden<br />
4. Waiau<br />
5. Waipara<br />
6. Hanmer Springs<br />
7. Hawarden-Waikari<br />
Restricted Water Supplies (Rural)<br />
8. Ashley<br />
9. Amuri Plains<br />
10. Balmoral<br />
11. Waiau Rural<br />
12. Cheviot<br />
13. <strong>Hurunui</strong><br />
Table 2 shows the water network valuations as at 30 June 2011.<br />
Maintenance and Operating Implications<br />
We intend to retain the ownership of all public water supply<br />
assets on behalf of the communities that these facilities serve.<br />
Asset management, basic design work, contract documentation,<br />
tendering, record keeping, operation and routine repair and<br />
maintenance are to be carried out by our staff. Larger budget<br />
capital works are likely to be let as contracts. Larger repairs,<br />
work across state highways or arterial roads and some<br />
emergency works may also be contracted to preferred or<br />
available contractors. External consultants will be engaged only<br />
for specialised tasks, where we do not have those skills in-house.<br />
Information relating to the overall condition and performance of<br />
the assets that make up the water supply networks in the district<br />
are in our Asset Management <strong>Plan</strong>s. Age and condition have an<br />
influence on the maintenance of assets, but do not necessarily<br />
impact on output and/or outcome performance. Breakages can<br />
occur due to nearby earthworks, natural emergency events,<br />
pressure waves (from pumps) or illegal connections that can<br />
influence demand for water. Low performance can also arise<br />
from an increase in demand from high growth, changes in<br />
technology and materials, and changing expectations from the<br />
community. The Water Asset Management <strong>Plan</strong> will be reviewed<br />
and updated through 2013.<br />
The Demand Management Strategy will look at significant<br />
ways to improve forecasting, planning and upgrading of water<br />
infrastructure into the future, thus addressing the national issue<br />
of increasing competition for access to water. The challenges<br />
of future growth, development and land-use changes (both<br />
domestic and industrial) within the district and the subsequent<br />
need to replace or renew supply infrastructure to meet these<br />
needs, will drive us to reassess how we currently do our business<br />
and to start thinking smarter and wiser. Water supply efficiency<br />
is a core directive to ensuring that we use what we currently<br />
have more effectively, before expensive upgrade works are<br />
considered. We have a responsibility to help educate the public<br />
Table 2: Water Network Valuations<br />
Network Replacement Cost<br />
Depreciated<br />
Values<br />
Amberley $2,815,297.48 $1,111,538.26<br />
Amuri Plains $1,290,870.87 $800,292.87<br />
Ashley $11,993,509.66 $8,349,455.36<br />
Balmoral $1,312,486.28 $775,449.94<br />
Blythe $401,350.63 $223,933.83<br />
Cheviot $3,255,002.95 $1,513,348.23<br />
Culverden $1,011,591.28 $380,681.82<br />
Hanmer Springs $5,817,078.18 $3,645,959.74<br />
Hawarden-Waikari $2,485,771.81 $878,670.62<br />
<strong>Hurunui</strong> 1 $5,124,151.09 $2,321,822.64<br />
Kaiwara $1,662,809.98 $954,166.69<br />
Leithfield Beach $490,747.49 $275,692.71<br />
Lower Waitohi $1,677,400.52 $814,691.71<br />
Parnassus $1,106,936.83 $603,963.87<br />
Peaks $273,119.55 $160,382.43<br />
Upper Waitohi $2,279,526.49 $862,083.11<br />
Waiau RWS $2,292,416.66 $1,100,388.11<br />
Waiau Township $712,104.90 $200,642.77<br />
Waipara $708,485.77 $254,815.72<br />
to reduce water consumption and encourage other methods<br />
to conserve water (such as grey water systems in new homes).<br />
Most of the network reticulation is in good repair and operating<br />
under a policy of renewal when necessary, thus reticulation should<br />
remain serviceable indefinitely. Pumps, controls, telemetry (data<br />
sent back to the office by radio) and water treatment devices<br />
are repaired as the need arises and are replaced as the benefits<br />
of repair are outweighed by replacement – usually every 12 – 20<br />
years. Reservoirs, weirs, bores, and ponds are maintained on an<br />
on-going basis. The asset ages of on-demand water networks is<br />
quite recent, with the earliest network installations dating back<br />
to 1955 (in Amberley).<br />
Assumptions and Risks<br />
Upgrading of water systems, new treatment plants and filtration<br />
systems to meet Drinking-Water Standards New Zealand, have<br />
all assumed financial subsidies from Central Government in<br />
the past in order for the work to affordably proceed. However,<br />
reduced national subsidy funding (less money available for all)<br />
and the ever-increasing limiting eligibility criteria (specifically<br />
the deprivation index to address more financially needy<br />
communities) have put council in a position that requires<br />
reconsideration of this hopeful approach. We will have to<br />
fund the full cost from their perceived deep pockets, placing<br />
more financial burden upon our communities to meet these<br />
legislatively imposed standards.<br />
75
www.hurunui.govt.nz<br />
We will continue to make application for this subsidy yearly<br />
from the Ministry of Health, wherever we see opportunity<br />
within the constraints of the set and strict criteria applicable to<br />
qualify for an adjudicated consideration.<br />
Effort is continually on-going to establish the useful lifespan of<br />
underground and fixed water supply assets. Most of the urban<br />
reticulation is AC pipe (older community areas prior to early<br />
1970’s) and PVC for new sub-divisions and replacement sections<br />
of the current infrastructure.<br />
Pipe material has performed satisfactorily since installation,<br />
but renewal is anticipated for much of this over the next 20<br />
years or so. We have been undertaking a renewal programme<br />
for some years, which will continue so that the cost is spread<br />
out rather than peaking at once. Expected life for AC is 60<br />
years and 80 years for PVC and polyethylene (PE). Some AC<br />
pipe has experienced wall softening, thus demanding repair<br />
or replacement. This effect is localised in all networks, but<br />
the frequency of pipe failure is closely monitored to ensure<br />
replacement is carried out at the optimum time.<br />
External and internal stresses determine the useful life of all<br />
assets. The inability to pin-point these means approximate<br />
values are applied to useful service lives. This implies that<br />
renewal priorities are spontaneous (reactive based on incidents<br />
of breakages), rather than being confidently known (proactive<br />
based on scientific data). Better scientific information around<br />
the pipeline infrastructure (sectional investigations for condition<br />
ratings) could swing this approach to the NAMS best practice<br />
asset management outcomes, but comes at a high initial cost.<br />
Sectional Investigation Programmes (SIP) will be initiated to<br />
selected schemes over the next three years to make inroads<br />
towards this desirable outcome and improved proactive<br />
forecasted replacement/renewal maintenance programmes.<br />
We recognise risks associated with failure to supply safe drinking<br />
water on public health and potential failure to supply where<br />
natural disasters have the capacity to damage reticulation. The<br />
rural character of the district means immediate assistance may<br />
be limited at such times. We hold limited pipe and fittings stock<br />
at each depot (dormant cash flows) and have built-in generators<br />
or external plugs at some of the main pump stations. Reservoir<br />
back-up when intakes are out of commission is very limited<br />
(except for Hanmer Springs – tank farm). Operators and plant,<br />
located at each depot, are a first point of call through these risk<br />
associated periods identified.<br />
All water networks operate under approved resource consents<br />
to take water. Conditions are set with council utilities staff and<br />
are administered by Canterbury Regional <strong>Council</strong> (Environment<br />
Canterbury - ECan). All intakes are within consented limits at<br />
present. It is assumed that future demand will be able to be<br />
met with the capital projects planned and that the consents for<br />
such will continue to be renewed as necessary and be able to<br />
be complied with.<br />
<strong>Council</strong> Utilities Team undertake emergency repairs to<br />
the main line on the Waipara Water Scheme.<br />
76
<strong>Hurunui</strong> <strong>Community</strong> <strong>Long</strong> <strong>Term</strong> <strong>Plan</strong> <strong>2012</strong> - <strong>2022</strong><br />
Development contributions are being collected to offset the<br />
negative economic effects on ratepayers for future upgrades of<br />
infrastructure in the <strong>District</strong> that are necessary to cater for<br />
growth. Such upgrades will help to ensure that the present level<br />
of provision of water supply services is kept sustainable.<br />
Shared Services<br />
We have an agreement with Waimakariri <strong>District</strong> <strong>Council</strong> to<br />
supply water to the Ashley and Sefton parts of their district. As<br />
such, approximately 1,650 Waimakariri ratepayers = many more<br />
residents pay the water proportion of rates directly to us.<br />
<strong>Community</strong> Outcomes<br />
1. A desirable and safe place to live<br />
2. A place with essential infrastructure<br />
Goals<br />
Supply water<br />
to meet<br />
consumer<br />
needs<br />
How we will<br />
achieve our Goals<br />
Provide a<br />
continuous ‘ondemand’<br />
supply of<br />
potable water to<br />
urban areas and a<br />
‘restricted’ supply<br />
of water to rural<br />
areas<br />
Undertake<br />
a residents<br />
satisfaction survey<br />
Maintain and<br />
improve water<br />
schemes to comply<br />
with DWSNZ<br />
Water tested for<br />
quality<br />
Goals and Performance Measures<br />
Performance Measures Current Situation 11/12 12/13 13/14 14/15 15+<br />
Major faults to water<br />
supply pipelines<br />
greater than 250mm<br />
diameter that affect<br />
customers are<br />
repaired within 24<br />
hours<br />
Resident satisfaction<br />
will continue to<br />
improve over the<br />
coming years<br />
Install 9 mixed oxidant<br />
treatment plants and<br />
eliminate the need for<br />
permanent boil water<br />
notices<br />
The safety standard<br />
of potable water<br />
improves each year**<br />
No such faults were reported<br />
during the year, but we have a better<br />
system in place now to capture this<br />
information and track the completion<br />
of work via our service request<br />
programme<br />
Resident satisfaction levels have<br />
improved since 2007 and in 2011<br />
it reached 82.5%* satisfaction with<br />
water quality. Satisfaction with<br />
quantity of rural water was 81%.<br />
We have 8 permanent boil water<br />
notices in place.<br />
Water standards are measured weekly<br />
or monthly depending on the number<br />
of consumers for each scheme.***<br />
Our potable water met safety<br />
standards in 85% of the district.<br />
√ √ √ √<br />
*Average score over three questions relating to pressure and flow of water (86%), appearance and taste (79%).<br />
**We have been working to improve the safety standard of potable water in the district each year and last year we reached 85%.<br />
***Each scheme, dependent on its risks at intake (shallow through river gallery would be high risk), has a monitoring regime associated with<br />
its need for sampling and testing for e-coli and total coliforms. The higher the risk, the more tests required for the scheme. High risk - once per<br />
week, low risk (deep intake) - once per month. A failure is an e-coli reading >1, which requires retesting until it achieves three clear results.<br />
√<br />
√<br />
√<br />
√<br />
√<br />
Financial Summary<br />
A financial summary for this activity is shown on the next page.<br />
77
www.hurunui.govt.nz<br />
Water Supplies - Group Activity Financial Summary<br />
Annual <strong>Plan</strong> Year 1 Year 2 Year 3 Year 4 Year 5 Year 6 Year 7 Year 8 Year 9 Year 10<br />
2011/<strong>2012</strong> <strong>2012</strong>/2013 2013/2014 2014/2015 2015/2016 2016/2017 2017/2018 2018/2019 2019/2020 2020/2021 2021/<strong>2022</strong><br />
Operating Statement<br />
Operating Revenue<br />
<strong>District</strong> Wide Rates 0 0 0 0 271,471 271,471 271,471 271,471 271,471 271,471 271,471<br />
Targeted Rates 3,865,925 4,216,961 4,457,076 4,708,071 4,886,798 5,073,337 5,195,456 5,397,543 5,608,551 5,828,920 6,059,113<br />
Other Income 109,485 221,616 111,380 114,772 118,411 122,310 125,788 129,341 133,434 137,927 142,441<br />
Internal Interest Received 9,777 8,998 6,282 7,175 7,174 18,473 44,853 73,948 103,961 133,439 170,799<br />
Development Contributions 351,193 129,978 135,200 139,651 144,432 158,431 164,570 171,222 178,498 186,590 177,157<br />
Total Operating Revenue 4,336,380 4,577,553 4,709,939 4,969,669 5,428,287 5,644,022 5,802,138 6,043,525 6,295,915 6,558,347 6,820,981<br />
Operating Expenditure<br />
Employee Benefits 592,896 619,190 638,571 658,013 678,880 701,233 721,171 741,542 765,009 790,768 816,650<br />
Direct Operating Expenditure 1,585,555 1,777,070 1,832,692 1,888,492 1,931,934 1,995,544 2,052,283 2,110,255 2,177,037 2,250,340 2,323,994<br />
Internal Interest Paid 385,126 309,960 385,568 372,162 358,493 331,971 355,551 352,948 340,269 322,951 305,297<br />
<strong>Council</strong> Overheads Expenditure 873,937 909,309 938,215 968,821 995,825 1,026,094 1,053,709 1,081,800 1,115,190 1,147,304 1,181,450<br />
Depreciation 850,000 932,086 967,325 959,417 1,063,748 1,055,069 1,058,271 1,160,750 1,147,615 1,137,668 1,315,536<br />
Total Operating Expenditure 4,287,514 4,547,615 4,762,371 4,846,905 5,028,879 5,109,911 5,240,984 5,447,296 5,545,121 5,649,030 5,942,927<br />
Operating Surplus (Deficit) 48,866 29,938 (52,432) 122,763 399,407 534,111 561,154 596,229 750,794 909,318 878,055<br />
Capital Statement<br />
Capital Expenditure<br />
<strong>District</strong> Wide Water 96,602 32,713 33,996 35,127 36,335 50,835 52,770 54,908 57,250 59,865 49,835<br />
<strong>District</strong> Wide Water - Miox Treatment 0 758,000 0 0 0 0 0 0 0 0 0<br />
Amberley Water 14,678 261,500 10,392 279,220 142,170 448,773 108,700 0 0 0 0<br />
Leithfield Beach Water 7,920 0 0 0 0 0 0 0 0 0 0<br />
Ashley Rural Water 137,914 310,000 176,664 182,546 188,819 195,619 203,065 211,293 220,303 230,367 374,194<br />
Culverden Town Water 60,125 5,000 72,432 7,517 48,982 5,754 5,973 8,700 6,480 6,776 9,922<br />
Waiau Town Water 8,659 205,500 520 537 555 575 597 621 648 678 709<br />
Amuri Plains Water 0 4,500 4,676 4,832 4,998 5,178 5,375 5,593 5,832 6,098 6,378<br />
Balmoral Water 15,756 16,000 2,078 3,221 4,443 3,452 2,389 4,972 2,592 2,710 5,670<br />
Waiau Rural Water 25,500 23,500 24,421 17,718 18,327 18,987 19,709 20,508 139,309 22,359 23,387<br />
Cheviot Water 707,957 81,000 143,410 81,609 84,413 87,453 90,782 94,460 98,488 102,988 107,722<br />
Waipara Town Water 2,112 20,000 0 0 0 0 0 0 0 0 0<br />
Hanmer Springs Water 245,657 162,000 25,980 23,624 22,214 31,069 23,890 27,344 25,918 36,588 652,004<br />
Hawarden-Waikari Water 16,520 3,000 0 46,173 4,443 575 3,703 51,332 5,184 678 0<br />
<strong>Hurunui</strong> Rural Water 196,688 209,000 209,918 211,539 218,808 312,415 235,317 244,851 255,292 266,955 279,228<br />
Total Capital Expenditure 1,536,088 2,091,713 704,488 893,662 774,506 1,160,685 752,269 724,583 817,295 736,060 1,509,048<br />
Funds Required<br />
Operating Deficit 0 0 52,432 0 0 0 0 0 0 0 0<br />
Capital Expenditure 1,536,088 2,091,713 704,488 893,662 774,506 1,160,685 752,269 724,583 817,295 736,060 1,509,048<br />
Increase to Reserve Funds 0 47,261 61,613 86,502 371,630 1,009,549 1,119,895 1,209,217 1,270,884 1,439,669 1,388,383<br />
Repayment of Internal Loans from Operating Income 898,866 914,763 853,280 995,678 1,091,525 579,631 499,530 547,762 627,525 607,317 805,208<br />
2,434,954 3,053,737 1,671,813 1,975,842 2,237,662 2,749,865 2,371,695 2,481,561 2,715,705 2,783,046 3,702,639<br />
Funded by<br />
Operating Surplus 48,866 29,938 0 122,763 399,407 534,111 561,154 596,229 750,794 909,318 878,055<br />
Non Cash Expenditure - Depreciation 850,000 932,086 967,325 959,417 1,063,748 1,055,069 1,058,271 1,160,750 1,147,615 1,137,668 1,315,536<br />
Capital Expenditure funded from existing Reserve Funds 0 124,855 36,074 85,059 45,776 251,057 282,233 343,634 418,531 353,244 686,544<br />
Capital Expenditure funded through Internal Loans 1,536,088 1,966,858 668,413 808,604 728,730 909,628 470,036 380,949 398,765 382,816 822,504<br />
2,434,954 3,053,737 1,671,813 1,975,842 2,237,662 2,749,865 2,371,695 2,481,561 2,715,705 2,783,046 3,702,639<br />
H:\<strong>Long</strong> <strong>Term</strong> <strong>Plan</strong> Workings\<strong>Hurunui</strong> <strong>District</strong> <strong>Council</strong> LTP Budgets <strong>2012</strong>-<strong>2022</strong> - Post Submissions.xls 31/05/<strong>2012</strong> 9:34 a.m.<br />
78
Sewerage<br />
Overview<br />
Sewerage covers the following activity described below:<br />
Activity 1: Sewerage (township and rural sewer schemes)<br />
Our Aim<br />
To provide proficient, cost effective sewage disposal schemes<br />
relevant to the needs of the community.<br />
Why is the <strong>Council</strong> Involved?<br />
<strong>Council</strong> provides a sewerage service to support the development<br />
of the <strong>District</strong> and to protect the physical environment and<br />
health of the community through good sanitary practice. We<br />
try to ensure that adverse environmental impacts are avoided,<br />
minimised or eased.<br />
<strong>Community</strong> Outcomes<br />
The Water Supply activity described in this section, primarily<br />
contributes to three of our community outcomes:<br />
1. A desirable and safe place to live:<br />
• We have attractive well designed townships<br />
• Communities have access to adequate health and<br />
emergency services and systems and resources<br />
are available to meet civil defence emergencies<br />
• Risks to public health are identified and<br />
appropriately managed<br />
2. A place that demonstrates environmental responsibility:<br />
• We protect our environment while preserving<br />
people’s property rights<br />
• We minimise solid waste to the fullest extent,<br />
and manage the rest in a sustainable way<br />
3. A place with essential infrastructure:<br />
• We have a strong emphasis on service delivery<br />
across all infrastructure including roading, water<br />
(for drinking and development), waste water,<br />
stormwater and solid waste<br />
Major Projects <strong>Plan</strong>ned<br />
Project<br />
Amberley pipe upgrade $474,000<br />
<strong>Hurunui</strong> <strong>Community</strong> <strong>Long</strong> <strong>Term</strong> <strong>Plan</strong> <strong>2012</strong> - <strong>2022</strong><br />
Year <strong>Plan</strong>ned<br />
<strong>2012</strong>/13 2013/14 2014/15<br />
Amberley pond desludging $96,642<br />
Amberley wastewater plant<br />
renewals<br />
$12,240 $10,780 $78,256<br />
Cheviot wave board correction $30,882<br />
Greta Valley wastewater plant<br />
renewals<br />
Motunau Beach wastewater<br />
plant renewals<br />
Hanmer Springs pond<br />
desludging<br />
Hanmer Springs disposal to<br />
land option<br />
Hanmer Springs treatment<br />
pond aeration improvements<br />
$17,000 $18,255<br />
$35,000<br />
$220,000<br />
Significant Negative Effects<br />
$93,528<br />
$1,288,560<br />
There are significant negative effects for environmental,<br />
economic, cultural and social wellbeing from this activity. The<br />
disposal of treated effluent to land and waterways carries<br />
physical and health risks, although these are minimised by<br />
ensuring that the reticulation and disposal systems comply<br />
with the appropriate resource consents. All facilities are based<br />
around pond treatment, which means any overflow or failure<br />
at these locations will involve release of treated or partially<br />
treated material. The lack of reticulated sewerage systems is<br />
affecting the environmental and social wellbeing of some local<br />
communities. However, the cost of installing such systems at<br />
this stage, have an even bigger negative effect on the economic<br />
wellbeing of these communities.<br />
Emergency Management<br />
In an emergency, particularly a civil defence emergency, we will<br />
continue to deliver services as long as it is safe and practical<br />
to continue to do so. Sewerage issues will receive priority in<br />
the event of a civil emergency and every effort will be made to<br />
effectively and safely dispose of sewerage to minimise health<br />
risks.<br />
Financial Summary<br />
A financial summary for this group of activities is shown at the<br />
end of the Sewerage activity.<br />
79
www.hurunui.govt.nz<br />
Activity 1: Sewerage<br />
Overview<br />
The Sewerage activity includes the various functions of the<br />
seven sewerage schemes in the <strong>District</strong>.<br />
Current Situation<br />
The district operates 7 separate sewerage schemes, serving all<br />
but 4 urban localities. All use oxidation ponds for treatment of<br />
sewage and 14 pump stations are operated within the pipework.<br />
Table 1, sets out the number of connections each sewerage<br />
scheme services.<br />
1. The current situation for each of the sewerage schemes<br />
is outlined below:<br />
2. Amberley: Reticulation was installed between 1974<br />
and 1977 with a staged multi-pond treatment and land<br />
disposal onto pasture (free draining sandy soil) adjacent<br />
to the coast.<br />
3. Cheviot: Reticulation and aeration tank was installed in<br />
1964, upgraded to single oxidation pond plus borderdyke<br />
disposal in 1982 and further improved in 1999/00<br />
to a multi-pond facility with spray irrigation to pasture<br />
and overland flow polishing prior to discharge to<br />
adjacent waterway when the irrigation area is saturated.<br />
4. Greta Valley: Reticulation and treatment/disposal<br />
facility was installed in 1979 for a <strong>Council</strong> funded<br />
subdivision with one pond treatment and disposal to<br />
land (travelling irrigator) or to nearby waterway when<br />
the soil conditions are too wet for irrigating.<br />
5. Motunau Beach: Reticulation, treatment and disposal<br />
area was installed in 1987 in response to meet<br />
community and public health expectations, using a dual<br />
pond for treatment (with aeration) and land based<br />
discharge onto pasture (private title) with border dyke<br />
application.<br />
6. Hanmer Springs: Reticulation was installed 1971 with<br />
dual pond treatment and discharge to the Chatterton<br />
River, replacing the older reticulation and settling tank<br />
(installed in 1949 in the hospital property) which was<br />
not meeting local expectations. A further upgrade<br />
including additional ponds and aerators was completed<br />
in 2007/08.<br />
7. Hawarden: Reticulation and treatment/disposal facility<br />
was installed in 1966 with twin ponds and overflow to<br />
an open drain.<br />
8. Waikari: Reticulation and treatment/disposal facility<br />
was installed in 1967 with twin ponds and overflow to<br />
the Waikari River with discharge altered to land disposal<br />
via spray in 1996 on an adjacent farmland. It has been<br />
further upgraded in 2005 with an additional pond and<br />
an increased effluent disposal area.<br />
Recently, we investigated the feasibility of two new sewerage<br />
schemes for Culverden and Waipara. Public feedback on the<br />
results, and particularly the cost of the building the schemes was<br />
not favourable. There clearly is the sentiment “don’t fix what’s<br />
not broken”,therefore, reticulated schemes for Culverden and<br />
Waipara are not planned at this stage. Should there be any<br />
changes in legislation or adverse effects to groundwater are<br />
noted (in terms of effluent contamination), then this democratic<br />
approach will be revisited for alternative consideration.<br />
The levels of service for our sewerage schemes can be found<br />
in the appendices section of this plan. These levels of service<br />
are monitored internally and will not be reported in the Annual<br />
Report.<br />
Table 1: Sewerage Connections<br />
Scheme<br />
Active<br />
Connections<br />
Undeveloped<br />
Sites (half<br />
connections)<br />
Pan Connection<br />
Equivalents<br />
(includes multiple<br />
pans)<br />
Amberley 1,042 106 1,350<br />
Leithfield 172 25 203<br />
Cheviot 208 8 328<br />
Greta Valley 28 12 59<br />
Motunau Beach 119 18 137<br />
Hanmer Springs<br />
1114 293 1,923<br />
Hawarden 120 11 169<br />
<strong>Plan</strong>s for the future<br />
New pipelines in Amberley are to be built. <strong>Plan</strong>t renewals will<br />
be undertaken as identified in our Activity Management <strong>Plan</strong><br />
for wastewater.<br />
We have an ‘Assessment of Water and Sanitary Services”. This<br />
assessment will be reviewed from time to time during the life<br />
of this plan and is due for its next review in the 2013/14 year.<br />
Works associated with current resource consent requirements<br />
for Hanmer Springs and Cheviot wastewater treatment plants<br />
requires us to look towards disposal to land as alternative<br />
adopted approaches to disposal to waterways (by 2014/15).<br />
Hanmer Springs wastewater treatment plant ponds exhibited<br />
seasonally low dissolved oxygen (DO) levels, which could result<br />
in odour problems to nearby residential properties (dependent<br />
upon the prevailing wind at the time). Aerator upgrades will be<br />
required to eliminate this potential problem and ensure that<br />
council remains within the tolerated minimum acceptable values<br />
for DO.<br />
80
<strong>Hurunui</strong> <strong>Community</strong> <strong>Long</strong> <strong>Term</strong> <strong>Plan</strong> <strong>2012</strong> - <strong>2022</strong><br />
Operational Costs:<br />
Funding<br />
• Operation and loan repayments are funded by way of a<br />
wastewater Uniform Annual Charge:<br />
• on each connection<br />
• for connected commercial properties a charge of<br />
1 for the first pan<br />
• ½ charges on the second pan<br />
• ¼ charges on the third and subsequent pans<br />
• Serviceable properties within the urban sewerage<br />
scheme will be charged ½ the Uniform Annual Charge.<br />
• <strong>Council</strong> may allow capital contributions to be made at<br />
its discretion in place of a loan Uniform Annual Charge.<br />
Capital Costs:<br />
• Significant <strong>Council</strong> capital expenditure are funded by a<br />
loan as per the <strong>Council</strong>’s Internal Financing Policy<br />
• If loans are not raised, then it will be from targeted<br />
rates<br />
• <strong>Council</strong> may loan/fund sewerage main extensions with<br />
the loan repayments met by those properties directly<br />
benefiting where the majority of the property owners<br />
agree to the extension<br />
• If any of the Capital Expenditure caters for future<br />
growth of the scheme, then that portion of the<br />
expenditure that relates to growth may be funded<br />
from future users via Development Contributions and<br />
Financial Contributions<br />
• Landowners with new connections will pay the cost of<br />
connecting to the nearest main plus, if a new subdivide,<br />
putting in the sub-main<br />
• Property owners wanting new connections will pay<br />
those costs necessary for the connection and any levies<br />
as specified in the Development Contributions policy<br />
• <strong>Council</strong> should pay any costs of scheme requirements<br />
that are over and above those necessary for the<br />
connection and the direct costs<br />
<strong>Council</strong> Owned Assets<br />
Sewerage schemes in:<br />
• Amberley<br />
• Cheviot<br />
• Greta Valley<br />
• Motunau Beach<br />
• Hanmer Springs<br />
• Hawarden<br />
• Waikari<br />
Table 2 shows the sewerage network valuations as at 30 June 2011 which<br />
includes all pipe, point and plant assets.<br />
Table 2: Sewerage Network Valuations<br />
Network Replacement Cost Depreciation Values<br />
Amberley $7,505,640.48 $4,689,448.33<br />
Cheviot $1,593,516.79 $644,791.07<br />
Greta Valley $465,836.98 $226,644.78<br />
Hanmer Springs $7,979,250.47 $5,633,596.60<br />
Hawarden $868,863.41 $295,961.48<br />
Motunau Beach $869,115.26 $517,905.72<br />
Waikari $1,755,490.76 $737,717.77<br />
Maintenance and Operating Implications<br />
We intend to retain ownership of all wastewater assets on<br />
behalf of the communities they serve. Asset management, basic<br />
design work, contract documentation, tendering, record keeping,<br />
operation and routine repairs and maintenance is to be carried<br />
out by our staff.<br />
Larger budget capital works may be let as contracts. Decisions<br />
affecting wastewater networks will be made in consultation<br />
with ward committees and Residents Associations.<br />
Larger repairs and emergency works may also be contracted to<br />
preferred or available contractors. Preference will be given to<br />
locally based contractors for these activities where their prices<br />
are competitive. External consultants will be engaged only for<br />
specialised tasks, where we do not have the skills, or another<br />
opinion is required.<br />
Assumptions and Risks<br />
Effort is on-going to establish the useful lifespan of underground<br />
and fixed wastewater assets. Most of the reticulation is AC pipe<br />
and is affected by both sewage and soil conditions. Much of<br />
the newer reticulation is PVC. Expected life for manholes and<br />
PVC is 80 years and AC, 50 years. External stresses determine<br />
useful life of assets, being soil conditions, quality of installation,<br />
additional loadings, and maintenance. The inability to pin-point<br />
these means approximate values are applied. The inherent<br />
variations in-situ makes it difficult to accurately formulate<br />
renewals priority programme, but will be refined as additional<br />
information is obtained.<br />
All wastewater networks operate under current resource<br />
consents for all emissions and discharges. These conditions are<br />
generally agreed between us and Canterbury Regional <strong>Council</strong>.<br />
Most of the consent terms will not expire until 2018 – 2030.<br />
81
www.hurunui.govt.nz<br />
Goals and Performance Measures<br />
<strong>Community</strong> Outcomes<br />
1. A desirable and safe place to live<br />
2. A place that demonstrates environmental responsibility<br />
3. A place with essential infrastructure<br />
Goals<br />
Protect public health through<br />
ensuring good sanitary<br />
standards<br />
How we will achieve our<br />
Goals<br />
Maintain sewerage disposal<br />
and treatment facilities in<br />
most urban areas<br />
Performance Measures Current Situation 11/12 12/13 13/14 14/15 15+<br />
All major and significant<br />
non-compliances for our<br />
sewerage disposal resource<br />
consents reduce until we<br />
have 0% non-compliance<br />
All sewer breaks are<br />
repaired within 12 hours of<br />
notification<br />
We have 14 resource<br />
consents relating to<br />
wastewater, which have 186<br />
conditions to comply with.<br />
We had 2.2% major and<br />
significant non-compliance to<br />
date this year*<br />
No major breaks occurred<br />
and minor breaks were<br />
repaired within 12 hours of<br />
receiving the notification<br />
2% 1% 0% 0%<br />
√ √ √ √<br />
* The non-compliance issues have related to matters such as late reports and failure to complete log books. These were initially minor<br />
noncompliance matters but accelerated to major and significant non-compliance as they were not remedied within the allotted timeframes<br />
set by the Regional <strong>Council</strong>.<br />
Financial Summary<br />
A financial summary for this activity is shown on the next page.<br />
82
<strong>Hurunui</strong> <strong>Community</strong> <strong>Long</strong> <strong>Term</strong> <strong>Plan</strong> <strong>2012</strong> - <strong>2022</strong><br />
Sewerage - Group Activity Financial Summary<br />
Annual <strong>Plan</strong> Year 1 Year 2 Year 3 Year 4 Year 5 Year 6 Year 7 Year 8 Year 9 Year 10<br />
2011/<strong>2012</strong> <strong>2012</strong>/2013 2013/2014 2014/2015 2015/2016 2016/2017 2017/2018 2018/2019 2019/2020 2020/2021 2021/<strong>2022</strong><br />
Operating Statement<br />
Operating Revenue<br />
Targeted Rates 588,808 618,127 683,846 758,360 842,193 937,618 1,046,410 1,170,631 1,312,674 1,475,324 1,661,819<br />
Other Income 317 320 330 340 351 362 373 383 395 409 422<br />
Internal Interest Received 5,504 2,158 322 634 788 1,317 0 0 0 0 0<br />
Development Contributions 175,529 70,086 72,788 75,187 77,757 104,721 108,678 113,076 117,927 123,282 109,270<br />
Total Operating Revenue 770,158 690,691 757,286 834,522 921,089 1,044,019 1,155,461 1,284,090 1,430,996 1,599,015 1,771,511<br />
Operating Expenditure<br />
Employee Benefits 50,270 52,454 54,096 55,743 57,511 59,404 61,093 62,819 64,807 66,989 69,182<br />
Direct Operating Expenditure 168,439 236,920 249,492 251,775 254,277 256,987 270,117 271,759 286,537 289,800 305,879<br />
Internal Interest Paid 259,221 295,001 360,119 374,948 487,096 502,193 511,283 533,576 524,281 501,287 465,873<br />
<strong>Council</strong> Overheads Expenditure 126,363 134,154 138,419 143,502 146,961 151,478 155,588 159,770 165,414 169,566 174,678<br />
Depreciation 320,000 366,060 373,326 368,475 408,244 415,129 411,244 456,681 449,510 441,295 491,252<br />
Total Operating Expenditure 924,293 1,084,588 1,175,452 1,194,443 1,354,089 1,385,191 1,409,325 1,484,606 1,490,549 1,468,937 1,506,864<br />
Operating Surplus (Deficit) (154,135) (393,897) (418,166) (359,922) (433,000) (341,172) (253,864) (200,516) (59,553) 130,078 264,647<br />
Capital Statement<br />
Capital Expenditure<br />
<strong>District</strong> Wide Sewer 96,602 32,713 33,996 35,127 36,335 50,835 52,770 54,908 57,250 59,865 49,835<br />
Amberley Sewer 0 486,240 10,780 174,898 20,948 12,384 243,678 7,961 0 0 0<br />
Cheviot Sewer 10,000 40,046 0 10,994 77,749 0 0 36,498 0 0 0<br />
Greta Valley Sewer 2,684 19,000 2,078 20,402 2,221 2,301 2,389 2,486 2,592 2,710 2,835<br />
Motunau Beach Sewer 0 35,000 0 0 12,218 12,658 119,450 0 0 0 0<br />
Hanmer Springs Sewer 31,840 235,000 103,920 1,304,667 11,107 17,261 11,945 18,644 12,959 20,327 14,174<br />
Hawarden Sewer 8,000 0 0 4,939 0 141,536 0 0 0 0 0<br />
Waikari Sewer 0 71,000 0 0 7,775 0 34,641 7,457 0 0 0<br />
Total Capital Expenditure 149,126 918,999 150,774 1,551,028 168,353 236,975 464,873 127,953 72,801 82,902 66,844<br />
Funds Required<br />
Operating Deficit 154,135 393,897 418,166 359,922 433,000 341,172 253,864 200,516 59,553 0 0<br />
Capital Expenditure 149,126 918,999 150,774 1,551,028 168,353 236,975 464,873 127,953 72,801 82,902 66,844<br />
Repayment of Internal Loans from Operating Income 165,865 760 53 8,553 5 73,957 157,380 256,165 389,957 571,373 755,899<br />
469,126 1,313,656 568,993 1,919,503 601,358 652,104 876,117 584,634 522,311 654,274 822,742<br />
Funded by<br />
Operating Surplus 0 0 0 0 0 0 0 0 0 130,078 264,647<br />
Non Cash Expenditure - Depreciation 320,000 366,060 373,326 368,475 408,244 415,129 411,244 456,681 449,510 441,295 491,252<br />
Transfer from Special Funds 0 28,597 44,893 0 24,761 0 0 0 0 0 0<br />
Capital Expenditure funded through Internal Loans 149,126 918,999 150,774 1,551,028 168,353 236,975 464,873 127,953 72,801 82,902 66,844<br />
469,126 1,313,656 568,993 1,919,503 601,358 652,104 876,117 584,634 522,311 654,274 822,742<br />
H:\<strong>Long</strong> <strong>Term</strong> <strong>Plan</strong> Workings\<strong>Hurunui</strong> <strong>District</strong> <strong>Council</strong> LTP Budgets <strong>2012</strong>-<strong>2022</strong> - Post Submissions.xls 31/05/<strong>2012</strong> 9:34 a.m.<br />
83
www.hurunui.govt.nz<br />
Roads and Footpaths<br />
Overview<br />
Roads and Footpaths covers the following activity described<br />
below:<br />
Activity 1: Roads (roads, bridges, footpaths, street lighting, and<br />
road safety)<br />
Our Aim<br />
To provide a transport network that is safe and accessible for all<br />
people throughout the <strong>District</strong>.<br />
Why is the <strong>Council</strong> Involved?<br />
We undertake the professional and technical work involved in<br />
providing the on-going management of the <strong>District</strong>’s roading<br />
network. Partial funding for road construction projects and<br />
on-going maintenance requirements is received from the New<br />
Zealand Transport Agency (NZTA). Public ownership of the<br />
roads and footpaths ensures appropriate property access and<br />
unimpeded rite of passage for the freedom of travel throughout<br />
the area.<br />
<strong>Community</strong> Outcomes<br />
The Roads and Footpaths activity described in this section,<br />
primarily contributes to two of our community outcomes:<br />
1. A desirable and safe place to live:<br />
• We have attractive well designed townships<br />
• Communities have access to adequate health and<br />
emergency services and systems and resources are<br />
available to meet civil defence emergencies<br />
• Risks to public health are identified and appropriately<br />
managed<br />
Major Projects <strong>Plan</strong>ned<br />
Project<br />
Bridge maintenance<br />
and repairs<br />
Sealed Road<br />
resurfacing<br />
Minor improvement<br />
programme<br />
Pavement<br />
rehabilitation<br />
programme<br />
Traffic services<br />
renewals - street<br />
lighting<br />
Year <strong>Plan</strong>ned<br />
<strong>2012</strong>/13 2013/14 2014/15 2015+<br />
$269,106 $279,900 $285,858 $299,435<br />
$1,000,371 $1,040,519 $1,062,647 $1,113,118<br />
$270,999 $281,874 $287,869 $301,541<br />
$580,215 $603,501 $616,336 $645,608<br />
$207,703 $216,039 $220,633 $231,112<br />
Significant Negative Effects<br />
<strong>Hurunui</strong>’s land transport network affords people a high degree<br />
of mobility, but this, and other economic and social benefits, has<br />
some significant environmental costs. High volumes of traffic<br />
produce noise, air, and light pollution. Dust from unsealed roads<br />
causes a nuisance on neighbouring properties and impacts on<br />
road safety due to decreased visibility. At present our transport<br />
infrastructure needs outweigh the negative effects on our<br />
environmental wellbeing and are sustainable at least for the<br />
period of this plan. Alternatives for the future will need to be<br />
sought if this balance shifts.<br />
Emergency Management<br />
In an emergency, particularly a civil defence emergency, we will<br />
continue to deliver services as long as it is safe and practical to<br />
continue to do so. The roading network will receive priority in<br />
the event of a civil emergency and every effort will be made to<br />
make the roads clear and safe to drive on.<br />
Financial Summary<br />
A financial summary for this group of activities is shown at the<br />
end of the Roads and Footpaths activity.<br />
2. A place with essential infrastructure:<br />
• We have a strong emphasis on service delivery across<br />
all infrastructure including roading, water (for drinking<br />
and development), waste water, stormwater and solid<br />
waste<br />
Princes Street, Waikari - Road & <strong>Community</strong> Improvement Programme<br />
84
Activity 1: Roads and Footpaths<br />
Overview<br />
The Roads and Footpaths activity includes the various functions<br />
of street lighting, bridges and road safety, as well as roads and<br />
footpaths.<br />
<strong>Hurunui</strong> <strong>Community</strong> <strong>Long</strong> <strong>Term</strong> <strong>Plan</strong> <strong>2012</strong> - <strong>2022</strong><br />
We are an active member of the ‘<strong>Hurunui</strong> <strong>District</strong> Road Safety<br />
Coordinating Committee’. The committee has a Road Safety<br />
Strategy which provides a framework for a road safety policy<br />
and initiatives in our district, together with practical, long term<br />
community solutions.<br />
Current Situation<br />
The Roading Network activity deals with the day-to-day<br />
operations, maintenance and improvements of road pavement<br />
(renewals, improvements and upgrades), signs, street lighting,<br />
parking, cleaning, bridge maintenance, corridor management,<br />
overweight and oversize permits, licenses to occupy and<br />
various road safety activities. These initiatives are supported<br />
through policy development and forward planning, including<br />
linking in with transport and land use planning and road safety<br />
coordination.<br />
Our roads are maintained and built using subsidy funds from<br />
New Zealand Transport Agency (NZTA) and moneys collected<br />
through local rates. This excludes state highways which are<br />
funded and maintained solely through NZTA. Three years ago,<br />
central government deliberately cut maintenance funding to<br />
all district councils, as it decided to focus on capital works to<br />
national state highways (Roads of National Significance) and the<br />
Auckland roading network needs as priorities. Our funding was<br />
cut by $600,000 per annum on average, for the full funding cycle<br />
2009/<strong>2012</strong>.<br />
Our Asset Management <strong>Plan</strong> (AMP) for roading is an important<br />
plan when it comes to planning and deciding on upgrades,<br />
maintenance and new work. An ongoing challenge is to match<br />
the level of service provided by the roading asset with the<br />
expectations of our community.<br />
The district’s roading network comprises of approximately<br />
1455 kilometres of local roads (excluding state highways), 278<br />
bridges, 94,204 square metres of footpaths, 60kilometres of<br />
kerb and channeling, 886 streetlights, 4622 traffic signs and 43<br />
kilometres of culvert pipes. Each road in the roading network<br />
has been categorized into a roading hierarchy (in the <strong>District</strong><br />
<strong>Plan</strong>) based on the road’s purpose and level of use. Of the 1455<br />
km local roads, 1380 kilometres are rural and 75 kilometres are<br />
urban. 602 kilometres of the road network is sealed, with 853<br />
kilometres remaining unsealed to date.<br />
Current desirable levels of service have been defined against<br />
urban and rural road hierarchy categories. These are 6<br />
carriageway service indicators (Quality, Safety, Environment,<br />
Efficiency, Comfort/Convenience and capacity and 5 associated<br />
roading asset service indicators (kerb and channel; bridges;<br />
street lighting; road marking; and signs). The road hierarchy<br />
established is designed to meet the expected levels of service<br />
(as per the AMP), although incomplete inventory data for some<br />
assets limits a full assessment. The levels of service defined in<br />
the AMP inform the performance measures set out in this plan.<br />
<strong>Plan</strong>s for the future<br />
The roading network uses a significant share of our annual<br />
expenditure (almost 25%), and it is planned that this will continue<br />
on a long term basis. Whereas the AMP provides important<br />
information for the work programme, we also routinely monitor,<br />
audit and assess, using traffic counts on a rotational basis to<br />
collect data about trends. <strong>Hurunui</strong> is a large district with a small<br />
population (rating base), therefore it is crucial that priority is<br />
given to roads and bridges that serve important functions, such<br />
as road safety, and have high traffic use.<br />
NZTA have released indicative allocation budget figures for<br />
road maintenance through <strong>2012</strong>-2015, which are 5% less than<br />
our original Regional Land Transport Programme submission<br />
requests. Although these budget amounts are 3.4% more than<br />
the 2009-<strong>2012</strong> budget allocations, they equate to $226,000<br />
less per annum across the three year programme. Coming to<br />
grips with a total $1.6 million reduced budget is going to be<br />
major challenge to both assets and operations alike. Our Asset<br />
Management <strong>Plan</strong>s (AMPs) tell us when, how and why we need<br />
to do work on each of our roads to ensure maximum wholeof-life<br />
for this asset (maximum return on investment approach);<br />
but we do not have the required subsidised income to maintain<br />
our roading network to the level our AMPs stipulate. We<br />
will continue to retain our funding as previously indicated as<br />
unsubsidised work and the rate impact for roading will continue<br />
as previously stated in the plan. We have made the assumption<br />
that the reduced level of NZTA funding will continue through<br />
the life of the LTP.<br />
We have done our best to get greater efficiencies within our<br />
current road maintenance contracts, without affecting the<br />
current levels of service (LoS). At the end of this period, our<br />
maintenance contracts will be renewed with cost escalations<br />
included. NZTA have declared that they will not pick up contract<br />
price escalations through their road maintenance subsidy<br />
scheme. This implies that the ratepayer will have to cover this<br />
shortfall otherwise less and less will be physically spent on<br />
maintenance outputs resulting in loss of road asset life and<br />
potentially putting road’s lives at risk driving on a compromised<br />
infrastructure. Thus, NZTA and Central Government are<br />
imposing more and more responsibility upon the local ratepayer<br />
to fund their roading infrastructure’s needs, unless the Minister<br />
of Transport is lobbied by all affected stakeholders to reverse<br />
this tactic and strategy.<br />
The financial savings effected through the last road maintenance<br />
tender round will sustain the infrastructure for the following<br />
year (<strong>2012</strong>-2013), but after that, we will have to seriously<br />
consider what elements of the planned works will have to be<br />
85
www.hurunui.govt.nz<br />
deferred to divert these funds back to essential maintenance<br />
works.<br />
So far, we have done much better than the national averages in all<br />
areas of our road performance assessment measures (roughness,<br />
smoothness and road integrity). We expect to remain above<br />
national average in these areas throughout the ten year period<br />
covered by this plan, given that all Road Controlling Authorities<br />
have been affected financially and more importantly, that we are<br />
not watching and waiting, but rather taking proactive steps to<br />
mitigate loss of asset life through rational and judicious decision<br />
making. We will continue to monitor our key performance<br />
indicators for road condition to establish if there is any loss<br />
of predicted asset life and the extent of any decline in levels<br />
of service. Over a long period of time, if our funding continues<br />
to be significantly less that our AMPs indicate, levels of service<br />
will gradually decrease. Increasing rates for roads in the future<br />
may be the only way to maintain current levels of service, or we<br />
could accept that a reduced level of service is necessary and<br />
decide what that will be.<br />
This is a problem we are not facing alone. Nationally, there are<br />
investigations into how we establish the point of critical failure<br />
for our roads so that we are able to proactively intervene. At<br />
this stage, we do not have the answers, but expect that this will<br />
continue to be a key issue when we review our long term plan<br />
again in three years. By then, with continued monitoring and<br />
exploring the how we can continue to do more for less, as well<br />
as on-going national discussion on this topic, we will have more<br />
information and options for consideration going forward.<br />
We have been undertaking only minor seal extensions over<br />
the past few years. The last major work was carried out on<br />
Woodbank Road, completed in 2010. We plan to take advantage<br />
of any external funds available or funding opportunities through<br />
the Road Seal Extensions Policy to reduce the length of unsealed<br />
roads in the district. Other processes for dust suppression<br />
will continue to be investigated. Bridge maintenance and<br />
replacements are also a priority focus during the next several<br />
years.<br />
Many timber bridges built after World War II are now nearly<br />
at the end of their economic lives, and will have to be replaced<br />
during the life of this plan. We have been working through a<br />
bridge replacement plan according to the priorities established<br />
after we contracted OPUS to investigate the state of our<br />
bridges in 2009. To date priority bridges which include Lyndon<br />
No.3 Bridge (Lyndon Road), MacFarlanes Bridge (Conway Flat<br />
Road), Humpback Bridge (Gore Bay Road), Williams Bridge<br />
(Glenmark Drive), Coops Bridge (Parkview Road), Gola Peaks<br />
Bridge (Virginia Road), Charwell No. 1 Bridge (Stag and Spey<br />
Road), Thompsons Bridge (Glenmark Drive) and Jamiesons<br />
Bridge (Megowans Road) have been completed.<br />
Bridges targeted for the <strong>2012</strong>/2015 period include Broxton<br />
Bridge (Broxton Road), Mandamus Bridge (Tekoa Road), Lower<br />
<strong>Hurunui</strong> Swing Bridge (Blythe Road), Okuku Pass Bridge<br />
(Okuku Pass Road), Uphams Bridge (Conway Flat Road), Mid<br />
Waipara Bridge (Greys Road), Blythe No.1 Culvert (Blythe<br />
Road), Crossleys Bridge (Leader Road East), Brophys Bridge<br />
(Brophys Road), Armco Culvert (Ngaroma Road), Jacks Creek<br />
(Lake Sumner Road). Because of the significant costs associated<br />
with bridge maintenance and improvements, it may be a better<br />
solution to replace bridges with fords instead, subject to location<br />
and traffic counts. This will only be considered where there is<br />
low traffic volume and few people affected (sometimes there<br />
is only one household). Consultation with relevant people and<br />
sectors of the community will be done before any decisions<br />
such as this are made. A budget provision has been made for<br />
the bridge repairs.<br />
We have been working through a programme of installing School<br />
Active Warning Signs where schools are positioned on busy<br />
roads. Warning signs have been installed for Amberley, Cheviot,<br />
Amuri, Leithfield, Rotherham, Broomfield, Waiau, Waikari<br />
and Greta Valley Schools. Further signs are programmed for<br />
<strong>Hurunui</strong> College, Hanmer Springs, Waipara and Omihi during<br />
<strong>2012</strong>/2015, at an approximately cost of $7,500 per sign.<br />
Roading challenges coming up include:<br />
• Binding up of metal material to unsealed roads so that they<br />
are sustainable and durable<br />
• Blending of metals to improve structural strength and<br />
enhanced mosaic aggregate interlocking<br />
• Improved open drains for land drainage requirements<br />
• Deciding on effective sealed road widths for improved traffic<br />
conveyance, and ways to reduce maintenance expenditure<br />
Funding Model<br />
Roads<br />
Operational Costs:<br />
• <strong>Council</strong>’s contribution is 100% <strong>District</strong> Rate for operations,<br />
roads and bridges known as the ‘Roading Rate’<br />
Capital Costs:<br />
• Capital improvements above $100,000 may be funded<br />
by reserves or loans pursuant to the <strong>Council</strong>’s Internal<br />
Financing Policy<br />
• Other Capital Expenditure to be funded as operational<br />
• If a community wants new sealing work done that does not<br />
qualify for a government subsidy, the Road Seal Extension<br />
policy allows for ratepayers to meet 50% of the costs,<br />
with the <strong>Council</strong> contributing the remaining 50% from the<br />
General Rate<br />
• If any of the Capital Expenditure caters for future growth,<br />
then that portion of the expenditure that relates to growth<br />
may be funded from future users via Financial Contributions<br />
Footpaths<br />
Operational Costs:<br />
• Township maintenance 100% local amenity rate on ward or<br />
community rating area<br />
Capital Costs:<br />
• Township maintenance 100% local amenity rate on ward or<br />
community rating area<br />
86
<strong>Hurunui</strong> <strong>Community</strong> <strong>Long</strong> <strong>Term</strong> <strong>Plan</strong> <strong>2012</strong> - <strong>2022</strong><br />
Maintenance and Operating<br />
The New Zealand Transport Agency (NZTA) subsidizes up to<br />
60% (confirmed by NZTA as fixed for <strong>Hurunui</strong> from July <strong>2012</strong><br />
to June 2015) of improvement projects such as seal extensions<br />
and minor improvement works that meet its funding criteria<br />
and requirements. A 50% financial assistance rate (FAR) is<br />
confirmed for ongoing maintenance requirements to ensure<br />
whole-of-life objectives of the asset are competently met.<br />
As a national core driver from central government, all road<br />
controlling authorities are being tasked to manage their roading<br />
assets with less and less subsidy funding. This means every<br />
authority must revisit the way they have done business in the<br />
past and look hard at improving output efficiencies, productivity,<br />
effectiveness of asset management decisions and resultant works<br />
programmes, value-for-money and best for asset outcomes. The<br />
reality is that councils are tasked to do “more (outputs) with<br />
less (money)” and ensure that the assets meet their fit-forpurpose<br />
objectives, whilst being affordable and pragmatic. This<br />
strategic approach, across the country (applicable to both local<br />
and national highways), has resulted in essential works (need<br />
to have) being completed, with less latitude for lavish (nice to<br />
have) outcomes. We are concerned about this reduced funding<br />
approach on a continued long-term basis, given that this has the<br />
latitude to erode the asset life of the infrastructure, resulting<br />
in expensive renewal works that could have been mitigated<br />
by prompt and timeously co-ordinated maintenance works,<br />
given the right level of subsidy funding. This situation is being<br />
meticulously monitored through asset condition ratings, visual<br />
inspections and customer service requests to ensure that the<br />
asset continues to meet the levels of service demanded by the<br />
ratepayers of this district for transportation requirements.<br />
Consideration is required on the ongoing ownership and<br />
management of very low trafficked roads and bridges currently<br />
justified on a community and social basis. In consultation with<br />
the Police and NZTA, we maintain and annually review a road<br />
safety strategy for the district, which is then implemented<br />
through an action plan.<br />
Assumptions and Risks<br />
Increases in population, vehicle ownership, industrial growth and<br />
development in both the primary and value-added sectors, as<br />
well as the popularity of our district as a tourist destination, all<br />
have an impact on the use of our roads and footpaths.<br />
Increasing traffic volumes are most significantly expected<br />
to impact on the district’s arterial road network and aging<br />
bridge structures. Project costs are based on current best<br />
practice, industry standards and local knowledge of materials,<br />
construction costs and geotechnical profiling.<br />
Strategic planning, scoping of works, initial investigations,<br />
preliminary designs, cost estimates and forward work plans for<br />
the roading network have been based on the assumption that<br />
<strong>Council</strong> will qualify for subsidy funding from NZTA for certain<br />
road-related capital, improvement and maintenance projects.<br />
Inflation has not been allowed for in NZTA’s funding assistance<br />
into the future and councils have been tasked to manage the<br />
cost impact. If we maintain the current rates take for road<br />
maintenance and not provide for the effects of escalation, then<br />
less money will be spent on physical maintenance works thus<br />
leaving the road asset at critical risk of failure and loss of asset<br />
life. Compound this with the effects of Peak Oil (and the resultant<br />
bitumen cost increases) and drainage and environmental<br />
impacts, then the situation becomes more bleak. We either put<br />
up our annual rates to provide more local unsubsidised funds to<br />
keep our roads in their current condition, or we can accept that<br />
there will be a deterioration in our road conditions (structural,<br />
appearance and driving quality) from 2013/2014 onwards.<br />
The level of cost that has been allowed for in the <strong>Long</strong> <strong>Term</strong><br />
<strong>Plan</strong> falls significantly short of what was provided for in the<br />
Asset Management <strong>Plan</strong> (AMP) which was developed prior to<br />
the change in NZTA funding. The difference over the next ten<br />
years between what was scheduled in the AMP and what NZTA<br />
have provided, less than what was requested in the Regional<br />
Land Transport Programme (RLTP), the shortfall is now closer<br />
to $18 million, which would need to be covered by rates.<br />
Our asset register was been prepared based on the best available<br />
asset management information. Some work still needs to be done<br />
to ascertain the exact relevant details of all of the roading assets,<br />
and to be able to accurately ascertain their current condition,<br />
current serviceability and future useful life, and from there to<br />
accurately predict the future needs and requirements to ensure<br />
continued sustainability and safe condition. Valuations shown for<br />
each network asset type are as at <strong>2012</strong> and are prepared using<br />
our historical cost estimates and current contract prices. These<br />
are approximate replacement values and may not reflect market<br />
values.<br />
We have a comprehensive Risk Management Strategy for the<br />
roading assets which identifies risks such as land use change,<br />
seasonal impacts on roading requirements, fluctuating oil prices<br />
and quality supply and the effect to the bitumen and petroleum<br />
industry, peak oil, climate change, demand for recreational<br />
facilities with associated access interlinks, the demand for cycling<br />
as alternative transportation mode and geographic issues and<br />
inherent fault lines. The risk management strategy includes ways<br />
to mitigate these factors.<br />
Shared Services<br />
We have a shared maintenance agreement with Waimakariri<br />
<strong>District</strong> <strong>Council</strong> for Sicon (their maintenance contractor) to<br />
undertake the maintenance of Okuku Pass Road and Balcairn/<br />
Amberley Road, which is a shared road with both <strong>District</strong>s.<br />
The costs are shared between both <strong>Council</strong>s.<br />
We also have a shared service contract with Mainpower for<br />
street lighting for economy of scale efficiencies, and another<br />
one for network assessments with BECA.<br />
87
www.hurunui.govt.nz<br />
<strong>Community</strong> Outcomes<br />
1. A desirable and safe place to live<br />
2. A place with essential infrastructure<br />
Goals and Performance Measures<br />
Goals<br />
How we will achieve our<br />
Goals<br />
Maintain the Contract out road<br />
district’s roads to a<br />
maintenance and<br />
monitor performance<br />
standard appropriate accordingly<br />
to their use<br />
Ensure that all<br />
bridges are safe and<br />
well maintained<br />
Undertake a residents<br />
satisfaction survey<br />
Contract out bridge<br />
maintenance and<br />
monitor performance<br />
accordingly<br />
Performance Measures Current Situation 11/12 12/13 13/14 14/15 15+<br />
<strong>Hurunui</strong> roads will compare<br />
favourably with the national rural<br />
road averages using the measures<br />
shown below:<br />
The smoothness of our roads<br />
The roughness of our roads<br />
The strength of our roads<br />
Residents consider the overall<br />
standard of road maintenance<br />
to be satisfactory (more than<br />
70%)<br />
Replace priority bridge<br />
structures according to<br />
the bridge replacement<br />
programme<br />
Overall, our roads compared better than the<br />
national average as shown below:<br />
Overall, our roads compare better than the<br />
national average as shown below:<br />
Smooth travel exposure – <strong>Hurunui</strong>’s roading<br />
network is 97%. The national average is 86%<br />
(a higher value is better)<br />
Overall, our roads compare better than the<br />
national average as shown below:<br />
Percentage rough roads in the <strong>Hurunui</strong> is<br />
4.2%. The national average is 9.1% (a lower<br />
value is better)<br />
Overall, our roads compare better than the<br />
national average as shown below:<br />
The strength of our roads is measured by a<br />
pavement Integrety Index (PII). The PII for<br />
the <strong>Hurunui</strong> is 96.6% The national average is<br />
93.7% (a higher value is better)<br />
Resident satisfaction levels have improved<br />
since 2007. In 2011 they were 73% satisfied<br />
Bridge repairs have commenced after a<br />
bridge structural component replacement<br />
programme was identified<br />
√ √ √ √<br />
√ √ √ √<br />
√ √ √ √<br />
√<br />
√<br />
√ √ √ √<br />
Financial Summary<br />
A financial summary for this activity is shown on the next page.<br />
Happy Valley Road, Emergency Preventative Maintenance<br />
88
Roading and Footpaths - Group Activity Financial Summary<br />
Annual <strong>Plan</strong> Year 1 Year 2 Year 3 Year 4 Year 5 Year 6 Year 7 Year 8 Year 9 Year 10<br />
2011/<strong>2012</strong> <strong>2012</strong>/2013 2013/2014 2014/2015 2015/2016 2016/2017 2017/2018 2018/2019 2019/2020 2020/2021 2021/<strong>2022</strong><br />
Operating Statement<br />
Operating Revenue<br />
<strong>District</strong> Wide Rates 2,530,693 3,330,774 3,448,061 3,581,566 3,676,230 3,803,429 3,954,195 4,065,093 4,217,827 4,410,833 4,557,402<br />
Targeted Rates 0 181,043 182,746 183,293 189,419 196,059 215,275 217,578 220,162 224,947 235,288<br />
Other Income 3,681,103 3,417,324 3,537,973 3,650,457 3,771,539 3,901,663 4,031,387 4,171,048 4,326,697 4,498,895 4,677,661<br />
Internal Interest Received 730,877 0 0 0 0 0 0 0 0 0 0<br />
Development Contributions 452,926 152,662 158,646 163,928 169,561 237,230 246,260 256,238 267,165 279,370 232,563<br />
Total Operating Revenue 7,395,599 7,081,803 7,327,426 7,579,245 7,806,748 8,138,381 8,447,116 8,709,957 9,031,851 9,414,044 9,702,914<br />
Operating Expenditure<br />
Direct Operating Expenditure 2,783,808 2,835,517 2,923,593 3,034,095 3,106,987 3,208,862 3,323,755 3,393,032 3,500,804 3,644,415 3,736,813<br />
Internal Interest Paid 2,779 2,162 1,953 1,729 1,489 1,231 955 659 341 0 0<br />
<strong>Council</strong> Overheads Expenditure 621,618 597,985 617,912 638,714 659,260 682,123 702,541 723,397 748,335 773,703 800,141<br />
Depreciation 2,900,000 2,863,125 3,182,179 3,191,330 3,202,063 3,557,671 3,568,108 3,580,853 4,009,038 4,020,758 4,035,406<br />
Total Operating Expenditure 6,308,205 6,298,789 6,725,637 6,865,869 6,969,798 7,449,888 7,595,359 7,697,941 8,258,518 8,438,876 8,572,360<br />
Operating Surplus (Deficit) 1,087,394 783,013 601,789 713,376 836,950 688,493 851,757 1,012,016 773,333 975,169 1,130,554<br />
Capital Statement<br />
Capital Expenditure<br />
Subsidised Roading 3,915,811 3,426,258 3,560,567 3,679,116 3,805,544 4,004,157 4,156,571 4,324,991 4,509,418 4,715,420 4,872,558<br />
Special Purpose Roading 10,708 16,000 16,627 17,181 17,771 18,411 19,112 19,886 20,734 21,682 22,678<br />
Unsubsidised Roading 26,526 25,000 25,980 26,845 27,768 28,768 29,863 31,073 32,398 33,878 35,435<br />
Amberley Ward Roadside Construction 42,440 33,000 29,098 24,697 25,546 26,466 39,419 34,801 29,806 31,167 32,600<br />
Amuri Ward Roadside Construction 50,243 22,000 22,862 23,624 24,435 25,315 26,279 27,344 28,510 29,812 31,183<br />
Cheviot Ward Roadside Construction 25,625 30,000 31,176 32,214 33,321 34,521 35,835 37,287 38,877 40,653 42,522<br />
Hanmer Springs Ward Roadside Construction 85,000 75,000 77,940 80,535 83,303 86,303 89,588 93,218 97,193 101,633 106,305<br />
<strong>Hurunui</strong> Ward Roadside Construction 16,000 16,000 16,627 17,181 17,771 18,411 19,112 19,886 20,734 21,682 22,678<br />
Total Capital Expenditure 4,172,353 3,643,258 3,780,878 3,901,392 4,035,459 4,242,352 4,415,777 4,588,486 4,777,670 4,995,926 5,165,960<br />
Funds Required<br />
Capital Expenditure 4,172,353 3,643,258 3,780,878 3,901,392 4,035,459 4,242,352 4,415,777 4,588,486 4,777,670 4,995,926 5,165,960<br />
Repayment of Internal Loans from Operating Income 0 2,880 3,090 3,314 3,553 3,811 4,088 4,384 4,702 0 0<br />
4,172,353 3,646,139 3,783,967 3,904,706 4,039,013 4,246,164 4,419,865 4,592,869 4,782,371 4,995,926 5,165,960<br />
<strong>Hurunui</strong> <strong>Community</strong> <strong>Long</strong> <strong>Term</strong> <strong>Plan</strong> <strong>2012</strong> - <strong>2022</strong><br />
Funded by<br />
Operating Surplus 1,087,394 783,013 601,789 713,376 836,950 688,493 851,757 1,012,016 773,333 975,169 1,130,554<br />
Non Cash Expenditure - Depreciation 2,900,000 2,863,125 3,182,179 3,191,330 3,202,063 3,557,671 3,568,108 3,580,853 4,009,038 4,020,758 4,035,406<br />
Capital Expenditure funded through Internal Loans 219,308 0 0 0 0 0 0 0 0 0 0<br />
4,206,702 3,646,139 3,783,967 3,904,706 4,039,013 4,246,164 4,419,865 4,592,869 4,782,371 4,995,926 5,165,960<br />
C:\Users\jab\Desktop\Fuck Up with Subsidised Roading\<strong>Hurunui</strong> <strong>District</strong> <strong>Council</strong> LTP Budgets <strong>2012</strong>-<strong>2022</strong> - Post Submissions - with Option 2 for Subsidised Roading.xls 27/06/<strong>2012</strong> 2:31 p.m.<br />
89
www.hurunui.govt.nz<br />
Stormwater and Drainage<br />
Overview<br />
Stormwater and Drainage covers the following activity described<br />
below:<br />
Activity 1:<br />
Our Aim<br />
Stormwater and Drainage<br />
To prevent or minimise adverse effects of surface flooding and<br />
stormwater discharge.<br />
Why is the <strong>Council</strong> Involved?<br />
Both our <strong>Council</strong> and the Canterbury Regional <strong>Council</strong><br />
(Environment Canterbury) have joint responsibilities regarding<br />
the management of stormwater drainage, flood control and<br />
stormwater quality in our district. We provide drainage services<br />
where a community has requested our involvement or where<br />
it is efficient to be involved. This includes managing drainage<br />
in localised areas to protect them from the effects of surface<br />
flooding. Stormwater is rain that has run off hard surfaces such<br />
as roofs, roads and car parks. Our aim is to protect human<br />
and ecological values by preventing or reducing the effects<br />
of stormwater on the human and aquatic environment. We<br />
monitor stormwater systems to ultimately minimise flooding<br />
and damage to property or the environment.<br />
<strong>Community</strong> Outcomes<br />
The Water Supply activity described in this section, primarily<br />
contributes to two of our community outcomes:<br />
1. A desirable and safe place to live:<br />
• We have attractive well designed townships<br />
• Communities have access to adequate health and<br />
emergency services and systems and resources<br />
are available to meet civil defence emergencies<br />
Major Projects <strong>Plan</strong>ned<br />
Project<br />
Construct new drains for<br />
Eastern Drain and Dry<br />
Gully, Amberley, direct to<br />
the lagoons<br />
Capital works on existing<br />
infrastructure<br />
Year <strong>Plan</strong>ned<br />
<strong>2012</strong>/13 2013/14 2014/15<br />
$294,000 $69,042<br />
Significant Negative Effects<br />
$62,352<br />
There is potential for significant negative impacts on<br />
environmental and cultural wellbeing due to this activity, but<br />
this is offset by ensuring that the disposal of stormwater is done<br />
in a manner that minimises contaminants and eases peak flows.<br />
Drainage systems may not always cope with changes in volumes<br />
of rainfall, with subsequent negative effects of flooding on roads<br />
and properties. This may cause additional social problems in<br />
living quality, public health and access to and safety of transport<br />
systems. However, such problems are mitigated to some extent<br />
by the provision of stormwater systems to cope with flooding.<br />
Drain clearances can have adverse effects on biodiversity,<br />
ecosystems and water quality, but such clearances are obviously<br />
necessary, and the negative effects that they have are short lived,<br />
with no implications for sustainability.<br />
Emergency Management<br />
In an emergency, particularly a civil defence emergency, we will<br />
continue to deliver services as long as it is safe and practical<br />
to continue to do so. Stormwater and drainage will receive<br />
priority in the event of emergencies involving flooding.<br />
Financial Summary<br />
A financial summary for this group of activities is shown at the<br />
end of the Stormwater and Drainage activity.<br />
• Risks to public health are identified and<br />
appropriately managed<br />
2. A place with essential infrastructure:<br />
• We have a strong emphasis on service delivery<br />
across all infrastructure including roading, water<br />
(for drinking and development), waste water,<br />
stormwater and solid waste<br />
90
Activity 1: Stormwater and Drainage<br />
Overview<br />
The Stormwater and Drainage activity includes the various<br />
functions of land drainage schemes and flood protection.<br />
Current Situation<br />
We maintain four small land drainage schemes set up by the<br />
former North Canterbury Catchment Board. They are the<br />
Ashworths drains, Leithfield Outfall drain, Newcombes Road<br />
drains and the Jed River areas.<br />
We have only a very small quantity of stormwater pipes in<br />
our townships, as most stormwater is disposed of to kerb and<br />
channelling and open drains. There are approximately 100 metres<br />
of stormwater pipe in Hanmer Springs and approximately 560<br />
metres of pipe in Amberley. Much of the <strong>District</strong>’s stormwater<br />
disposal systems comprise infrastructure that is maintained by<br />
private individual property owners, such as on-site soakage<br />
disposal, open drains/creeks, piped networks outfalls, silt traps,<br />
and detention structures.<br />
After two significant rainfall events in and around Amberley in<br />
2008, we engaged a specialist consultant to review the adequacy<br />
of our stormwater systems. The recommendations were to<br />
carry out some major capital works to reduce the impact of<br />
surface flooding on both Amberley Township and Amberley<br />
Beach. The works were to include diversion drains to “behead”<br />
the surface flows from north of Amberley to discharge them to<br />
natural waterways outside the urban area, and realignment of<br />
drains discharging to the lagoons north and south of Amberley<br />
Beach.<br />
Because of the time taken to obtain resource consents,<br />
exacerbated by the Canterbury earthquakes and appeals lodged<br />
against the consents granted after a lengthy hearing, only two<br />
major physical works have been completed. These were the<br />
flood diversion from Dock Creek along Lawcocks Road, and a<br />
piped outfall of the Leithfiled Outfall Drain to the sea.<br />
However with consents now finalised for three more significant<br />
capital projects, work is expected to be completed for flood<br />
diversion works in the Amberley swamp area (to include an<br />
outlet culvert under Stanton Rd) and from Dry Gully across to<br />
Mimimoto lagoon before the end of the 2011/12 year.<br />
<strong>Plan</strong>s for the future<br />
<strong>Hurunui</strong> <strong>Community</strong> <strong>Long</strong> <strong>Term</strong> <strong>Plan</strong> <strong>2012</strong> - <strong>2022</strong><br />
2016/17 budget for unspecified improvements. All funding is<br />
from a special rate struck over the entire Amberley Ward.<br />
A global consent for discharge of stormwater from the Amberley<br />
Urban area was heard in 2011, along with the other 15 consents<br />
for flood mitigation works described above. This was put on<br />
hold pending as there was not enough information and a new<br />
application will be made in the <strong>2012</strong>/13 year.<br />
AECOM Consultants will finalise an application in the <strong>2012</strong>/13<br />
year for a global consent for management of stormwater<br />
from future residential developments in Hanmer Springs. In<br />
anticipation of the stormwater management plan identifying some<br />
minor capital works being required on existing infrastructure, an<br />
allowance of $62,000 has been made in the 2013/14 year and<br />
a further $69,000 in the 2016/17 year. As in Amberley this will<br />
be funded by a separate rate over all properties in the Hanmer<br />
Springs Ward.<br />
We are proposing a new stormwater engineer to be appointed<br />
in 2013/2014 to manage this area of our work. This engineer<br />
will be responsible for developing district-wide stormwater<br />
catchment and management plans, and undertake the range of<br />
tasks required to ensure we have effective stormwater systems<br />
in place, inclusive of appropriate maintenance regimes.<br />
We will progressively move towards managing all of its urban<br />
stormwater responsibilities in a more holistic, integrated and<br />
life cycle way.<br />
Funding<br />
Operational Costs:<br />
• 100% Targeted Rate based on the area benefiting<br />
• Engineer for stormwater catchment and management<br />
plans funded through the General Rate<br />
Capital Costs:<br />
• Significant <strong>Council</strong> capital expenditure is funded by a<br />
loan as per the <strong>Council</strong>’s Internal Financing Policy<br />
• If loans are not raised, then it will be from targeted<br />
rates<br />
A flood flow diversion from Eastern Drain across to the<br />
Amberely North lagoon is proposed for the <strong>2012</strong>/13 year to<br />
complete the flood mitigation works covered by the 15 consents<br />
mentioned above.<br />
Detailed design and land ownership issues still have to be finalised,<br />
but a preliminary estimate of $298,000 has been allowed for in<br />
the <strong>2012</strong>/13 budget for this work and a further $84,000 in the<br />
• If any of the Capital Expenditure caters for future<br />
growth of the scheme, then that portion of the<br />
expenditure that relates to growth may be funded<br />
from future users via Development Contributions and<br />
Financial Contributions<br />
91
www.hurunui.govt.nz<br />
<strong>Council</strong> Owned Assets<br />
Land drainage schemes:<br />
• Ashworths drains<br />
• Leithfield Outfall drain<br />
• Newcombes Road drains<br />
• Jed River drains<br />
Maintenance and Operating Implications<br />
We plan to continue to maintain the 4 drainage systems as well<br />
as other drainage channels created as part of the improvement<br />
works described above. Annual maintenance has been limited to<br />
occasional drain clearing. Contractors will be engaged to carry<br />
out regular work to maintain the system as and when needed.<br />
Assumptions and Risks<br />
It is assumed that both global consent applications (Amberley<br />
and Hanmer Springs) will be approved and that land-owner<br />
approvals will be given to allow the flood mitigation construction<br />
works to proceed.<br />
<strong>Community</strong> Outcomes<br />
1. A desirable and safe place to live<br />
2. A place with essential infrastructure<br />
Goals and Performance Measures<br />
Goals<br />
Minimise the risk of<br />
flooding<br />
How we will achieve our<br />
Goals<br />
Maintain all drainage<br />
systems in accordance with<br />
resource consent conditions<br />
Employ an engineer to<br />
manage the stormwater and<br />
drainage portfolio<br />
Performance Measures Current Situation 11/12 12/13 13/14 14/15 15+<br />
All major and significant<br />
non-compliances for our<br />
stormwater resource<br />
consents reduce until we<br />
have 0% non-compliance<br />
<strong>District</strong> wide stormwater<br />
catchment and management<br />
plans have been put<br />
in place<br />
We have 30 resource<br />
consents relating to<br />
stormwater, which have 363<br />
conditions to comply with.<br />
We have had 0% major and<br />
significant non-compliance so<br />
far this year.<br />
We have a stormwater plan<br />
for the Amberley area but<br />
not for the other areas in the<br />
district<br />
2% 1% 0% 0%<br />
√<br />
Financial Summary<br />
A financial summary for this activity is shown on the next page.<br />
92
Stormwater and Drainage - Group Activity Financial Summary<br />
Annual <strong>Plan</strong> Year 1 Year 2 Year 3 Year 4 Year 5 Year 6 Year 7 Year 8 Year 9 Year 10<br />
2011/<strong>2012</strong> <strong>2012</strong>/2013 2013/2014 2014/2015 2015/2016 2016/2017 2017/2018 2018/2019 2019/2020 2020/2021 2021/<strong>2022</strong><br />
Operating Statement<br />
Operating Revenue<br />
<strong>District</strong> Wide Rates 0 0 103,130 106,270 109,640 113,250 116,470 119,760 123,550 127,710 131,890<br />
Targeted Rates 217,829 279,042 286,471 280,990 277,894 286,212 279,536 275,397 271,368 267,418 276,708<br />
Internal Interest Received 3,275 3,382 2,512 3,149 3,472 4,140 3,085 3,735 4,029 4,721 5,462<br />
Development Contributions 39,360 17,032 17,791 18,303 19,005 27,007 27,975 28,999 30,223 31,703 25,894<br />
Total Operating Revenue 260,464 299,457 409,903 408,712 410,011 430,609 427,066 427,892 429,170 431,552 439,953<br />
Operating Expenditure<br />
Employee Benefits 0 0 103,130 106,270 109,640 113,250 116,470 119,760 123,550 127,710 131,890<br />
Direct Operating Expenditure 19,535 58,500 34,549 20,723 13,705 73,046 9,900 46,108 10,502 12,132 89,026<br />
Internal Interest Paid 138,688 109,175 120,064 115,834 105,527 94,798 93,921 81,360 69,984 56,309 41,960<br />
<strong>Council</strong> Overheads Expenditure 10,744 12,850 13,255 14,474 14,082 14,530 14,933 15,345 16,759 16,324 16,837<br />
Depreciation 17,241 45,752 48,800 48,970 53,917 53,255 54,480 59,721 58,988 58,264 65,288<br />
Total Operating Expenditure 186,208 226,277 319,798 306,271 296,870 348,879 289,705 322,294 279,782 270,740 345,001<br />
Operating Surplus (Deficit) 74,256 73,180 90,106 102,441 113,141 81,730 137,361 105,598 149,388 160,812 94,952<br />
Capital Statement<br />
Capital Expenditure<br />
Amberley Stormwater 0 294,000 0 0 0 84,001 0 0 0 0 0<br />
Hanmer Springs Stormwater 0 0 62,352 0 0 69,042 0 0 0 0 85,044<br />
Total Capital Expenditure 0 294,000 62,352 0 0 153,043 0 0 0 0 85,044<br />
Funds Required<br />
Capital Expenditure 0 294,000 62,352 0 0 153,043 0 0 0 0 85,044<br />
Repayment of Internal Loans from Operating Income 91,497 118,932 138,906 151,411 167,058 134,985 191,841 165,319 208,376 219,076 160,240<br />
91,497 412,932 201,258 151,411 167,058 288,029 191,841 165,319 208,376 219,076 245,284<br />
Funded by<br />
Operating Surplus 74,256 73,180 90,106 102,441 113,141 81,730 137,361 105,598 149,388 160,812 94,952<br />
Non Cash Expenditure - Depreciation 17,241 45,752 48,800 48,970 53,917 53,255 54,480 59,721 58,988 58,264 65,288<br />
Capital Expenditure funded through Internal Loans 0 294,000 62,352 0 0 153,043 0 0 0 0 85,044<br />
91,497 412,932 201,258 151,411 167,058 288,029 191,841 165,319 208,376 219,076 245,284<br />
<strong>Hurunui</strong> <strong>Community</strong> <strong>Long</strong> <strong>Term</strong> <strong>Plan</strong> <strong>2012</strong> - <strong>2022</strong><br />
H:\<strong>Long</strong> <strong>Term</strong> <strong>Plan</strong> Workings\<strong>Hurunui</strong> <strong>District</strong> <strong>Council</strong> LTP Budgets <strong>2012</strong>-<strong>2022</strong> - Post Submissions.xls 31/05/<strong>2012</strong> 9:34 a.m.<br />
93
www.hurunui.govt.nz<br />
<strong>Community</strong> Services and Facilities<br />
Overview<br />
<strong>Community</strong> Services and Facilities covers the following 3 activity<br />
areas described below:<br />
Activity 1: <strong>Community</strong> Services (library, youth programme,<br />
community development and grants and services awards)<br />
Activity 2: Property (housing, public toilets, council offices,<br />
medical centres, halls, swimming pools and township<br />
maintenance)<br />
Activity 3:<br />
Our Aim<br />
Reserves (parks, reserves and cemeteries)<br />
To provide services that will support the community to lead<br />
healthy and fulfilled lives and meet and extend their recreational,<br />
cultural, educational development and information needs.<br />
Major Projects <strong>Plan</strong>ned<br />
Project<br />
Year <strong>Plan</strong>ned<br />
<strong>2012</strong>/13 2013/14 2014/15 2015+<br />
Cheviot <strong>Community</strong> Library<br />
to move into the Service $100,000<br />
Centre<br />
Toilet extension for <strong>Council</strong><br />
Chambers, Amberley<br />
$45,000<br />
Hanmer Springs Sports<br />
Stadium upgrade feasibility $30,000 $1,077,379<br />
study<br />
Hanmer Springs <strong>Community</strong><br />
Hall extension<br />
$193,284<br />
Purchase land to expand<br />
Balcairn cemetery $124,704<br />
Upgrade or rebuild of the<br />
Cheviot Medical Centre<br />
New public toilets built in<br />
Rotherham<br />
$1,150,700<br />
$103,563<br />
Why is the <strong>Council</strong> Involved?<br />
<strong>Council</strong> is involved with the activities within the <strong>Community</strong><br />
Services and Facilities group to provide for the social and<br />
cultural wellbeing of its people. All of the activities within this<br />
group are to do with ensuring our communities have the type<br />
of facilities and services reasonably expected to be provided<br />
by the <strong>Council</strong> and are unlikely to be privately supplied at an<br />
affordable cost. These activities also contribute to the long<br />
term achievement of our community outcomes.<br />
<strong>Community</strong> Outcomes<br />
The <strong>Community</strong> Services and Facilities described in this section,<br />
primarily contribute to two of our community outcomes:<br />
1. A desirable and safe place to live:<br />
• We have attractive well designed townships<br />
• Communities have access to adequate health and<br />
emergency services and systems and resources are<br />
available to meet civil defence emergencies<br />
• Risks to public health are identified and appropriately<br />
managed<br />
2. A place where our traditional rural values and heritage<br />
make <strong>Hurunui</strong> unique:<br />
• People have a range of opportunities to<br />
participate in leisure and culture activities<br />
• Our historic and cultural heritage is protected<br />
for future generations<br />
Significant Negative Effects<br />
Most of the activities in the <strong>Community</strong> Services and Facilities<br />
section do not pose any significant negative effects. We are<br />
mindful that in the Property area, there are some identified risks,<br />
such as car parks – particularly in Hanmer Springs where the<br />
volume of vehicle and pedestrian traffic is high during holiday<br />
periods. Every effort has been made to minimise the risk of<br />
accidents occurring through the design of the footpaths and car<br />
parks, and signage. Similarly with public toilets, car parks have<br />
been designed to reduce congestion and hazards. Public toilets<br />
are positioned in well-lit areas close to main roads to reduce<br />
incidents of vandalism and undesirable anti-social behaviours.<br />
Pensioner housing is only available in Amberley, Cheviot,<br />
Hanmer Springs and Waikari. This may inadvertently have<br />
social and cultural impacts upon the age demographics in local<br />
communities as the elderly population becomes concentrated<br />
in certain areas only. This may result in higher demands on<br />
some local services and facilities. There has not been a strong<br />
demand for pensioner housing in other areas in the <strong>District</strong>. If<br />
this changes, we will look at whether we can meet the demand<br />
at the time.<br />
Emergency Management<br />
In an emergency, particularly a civil defence emergency, we will<br />
continue to deliver services as long as it is safe and practical to<br />
continue to do so. Civil defence management plans provide<br />
the <strong>Council</strong> with guidance and contingencies. However, in an<br />
extreme emergency, most of the services in this group would<br />
not be considered to be essential.<br />
94
<strong>Hurunui</strong> <strong>Community</strong> <strong>Long</strong> <strong>Term</strong> <strong>Plan</strong> <strong>2012</strong> - <strong>2022</strong><br />
Financial Summary<br />
<strong>Community</strong> Services and Facilities - Group Activity Financial Summary<br />
Annual <strong>Plan</strong> Year 1 Year 2 Year 3 Year 4 Year 5 Year 6 Year 7 Year 8 Year 9 Year 10<br />
2011/<strong>2012</strong> <strong>2012</strong>/2013 2013/2014 2014/2015 2015/2016 2016/2017 2017/2018 2018/2019 2019/2020 2020/2021 2021/<strong>2022</strong><br />
Operating Statement<br />
Operating Revenue<br />
<strong>District</strong> Wide Rates 116,287 79,898 134,672 192,722 153,094 108,399 113,923 119,037 126,183 131,124 137,129<br />
Targeted Rates 1,489,962 1,444,655 1,486,789 1,511,809 1,549,173 1,596,583 1,678,487 1,734,096 1,791,966 1,845,129 1,900,155<br />
Other Income 728,501 756,270 700,577 723,575 746,419 770,489 791,958 813,894 839,163 866,900 894,770<br />
Internal Interest Received 96,304 35,250 35,797 40,963 46,085 48,170 52,981 54,398 58,737 59,462 63,445<br />
Development Contributions 317,240 238,682 247,626 255,938 253,498 234,236 242,264 250,106 251,357 263,546 232,096<br />
Total Operating Revenue 2,748,294 2,554,755 2,605,461 2,725,007 2,748,270 2,757,877 2,879,613 2,971,531 3,067,407 3,166,161 3,227,596<br />
Operating Expenditure<br />
Employee Benefits 772,836 876,883 821,337 846,344 873,183 901,934 927,578 953,780 983,964 1,017,094 1,050,384<br />
Direct Operating Expenditure 1,829,955 1,953,905 1,976,216 2,052,134 2,078,095 2,103,949 2,175,368 2,235,006 2,302,220 2,379,279 2,457,276<br />
Internal Interest Paid 298,170 297,186 293,193 281,858 279,090 332,437 385,884 373,819 357,336 365,904 344,141<br />
<strong>Council</strong> Overheads Expenditure 954,541 997,821 1,019,704 1,052,590 1,066,808 1,092,457 1,116,040 1,139,355 1,177,573 1,197,135 1,226,943<br />
Depreciation 350,974 397,951 399,752 460,108 484,813 487,427 517,458 519,239 521,096 542,425 544,456<br />
Total Operating Expenditure 4,206,476 4,523,747 4,510,203 4,693,035 4,781,988 4,918,204 5,122,328 5,221,200 5,342,189 5,501,838 5,623,200<br />
Operating Surplus (Deficit) (1,458,182) (1,968,992) (1,904,742) (1,968,028) (2,033,718) (2,160,327) (2,242,716) (2,249,669) (2,274,782) (2,335,676) (2,395,604)<br />
Capital Statement<br />
Capital Expenditure<br />
<strong>Community</strong> Services 92,654 65,000 67,548 69,797 72,196 74,796 77,643 80,789 84,234 88,082 92,131<br />
Property 46,637 115,500 61,832 229,256 24,991 1,280,154 38,821 26,751 261,124 30,490 31,892<br />
Reserves 115,831 260,146 306,716 152,906 2,344,865 126,745 256,992 155,544 401,011 142,483 156,121<br />
Total Capital Expenditure 255,122 440,646 436,096 451,959 2,442,051 1,481,694 373,456 263,083 746,368 261,055 280,143<br />
Funds Required<br />
Operating Deficit 1,458,182 1,968,992 1,904,742 1,968,028 2,033,718 2,160,327 2,242,716 2,249,669 2,274,782 2,335,676 2,395,604<br />
Capital Expenditure 255,122 440,646 436,096 451,959 2,442,051 1,481,694 373,456 263,083 746,368 261,055 280,143<br />
Transfer to Special Funds 341,814 199,265 231,358 237,120 248,751 232,374 236,254 248,506 255,204 240,990 216,298<br />
Transfer to General <strong>Council</strong> Reserves 145,013 154,805 143,785 159,691 161,603 150,859 169,146 170,928 172,892 178,004 180,288<br />
Repayment of Internal Loans from Operating Income 1,052,455 295,358 344,188 308,274 318,038 334,388 331,140 381,390 647,741 422,848 470,177<br />
3,252,586 3,059,065 3,060,170 3,125,072 5,204,161 4,359,643 3,352,711 3,313,576 4,096,987 3,438,572 3,542,511<br />
Funded by<br />
Transfer from Hanmer Springs Thermal Reserve 1,977,146 2,128,166 2,142,035 2,161,289 2,219,254 2,306,761 2,362,035 2,425,037 2,480,892 2,547,375 2,625,468<br />
Non Cash Expenditure - Depreciation 350,974 397,951 399,752 460,108 484,813 487,427 517,458 519,239 521,096 542,425 544,456<br />
Transfer from General <strong>Council</strong> Reserves 99,808 83,285 220,033 75,166 77,749 169,335 83,615 87,003 90,713 94,857 99,218<br />
Transfer from Special Funds 107,646 140,646 83,807 86,598 1,738,963 92,799 203,837 100,235 342,786 109,283 114,308<br />
Capital Expenditure funded through Internal Loans 717,012 309,017 214,542 341,911 683,383 1,303,320 185,765 182,061 661,499 144,632 159,060<br />
3,252,586 3,059,065 3,060,170 3,125,072 5,204,162 4,359,643 3,352,711 3,313,575 4,096,987 3,438,572 3,542,511<br />
95
www.hurunui.govt.nz<br />
Activity 1: <strong>Community</strong> Services<br />
Overview<br />
The <strong>Community</strong> Services activity includes the <strong>Council</strong>’s:<br />
• Library Service<br />
• <strong>Hurunui</strong> Youth Programme<br />
• <strong>Community</strong> Development Programme<br />
• Grants and Services Award Schemes<br />
Current Situation<br />
Library<br />
Our library system as we know it was established in 1993.<br />
Libraries are an important educational and recreational resource<br />
for the district, and a public library system ensures that there is<br />
equitable opportunity for people to access the information that<br />
they want and need.<br />
The library service is available throughout the district through<br />
our website and network of libraries. The libraries are well<br />
stocked with a wide range of resources in a variety of formats.<br />
Our library staff and volunteers provide assistance and support<br />
so that everyone can effectively access and use any of the library<br />
materials.<br />
• There are 8 libraries in the <strong>District</strong>. Four of these share<br />
premises with school libraries (Amuri, Cheviot, Greta<br />
Valley and Hawarden).<br />
• The <strong>Hurunui</strong> Memorial Library, based in Amberley, is<br />
the administrative centre for the district.<br />
• Branch libraries with paid staff are based at Hanmer<br />
Springs, Amuri, Cheviot and Hawarden.<br />
• There are 3 community libraries at Greta Valley, Waiau<br />
and Leithfield which are run solely by volunteers.<br />
• The Hanmer Springs Library/Service Centre and the<br />
Amuri Library/Service Centre are combined <strong>Council</strong><br />
Service Centre/libraries.<br />
• The library provides books to the Omihi School and<br />
Conway community.<br />
Volunteers are active at all libraries and support the library<br />
service with many hours of their time. The “Friends of the<br />
<strong>Hurunui</strong> <strong>District</strong> Libraries inc.” was formed in 2002 to support<br />
the library service , who along with other groups of volunteers<br />
contribute to the delivery of library services across the <strong>District</strong>.<br />
Without the many library volunteers throughout the <strong>District</strong>,<br />
we would either have to employ more staff to run them, or not<br />
operate as many libraries. The 3 community libraries which are<br />
solely run by volunteers would incur greater ratepayer expense<br />
if they were staffed.<br />
Since 2008 the library has provided free internet access for<br />
customers via the Aotearoa People’s Network Kaharoa (APNK).<br />
This is a national government subsidised initiative aimed at<br />
increasing New Zealanders access to digital information and<br />
technology. For the <strong>Hurunui</strong> libraries, this provides computer<br />
technology and software, including wireless access at some sites.<br />
This internet access is high speed and reliable and delivered<br />
through 17 computers throughout the <strong>District</strong>.<br />
Youth Programme<br />
Since 2008 we have run a Youth Programme within the <strong>District</strong>.<br />
Funding to support the first three years of the project was<br />
received from the Ministry of Youth Development. A youth<br />
coordinator was appointed to develop and run a programme<br />
with youth aged between 12 and 18 years. The programme has<br />
been developing and a number of initiatives and activities have<br />
been organised with the support and assistance of the youth<br />
concerned and the local Area schools. The Youth Programme<br />
has been a new area for <strong>Council</strong> and its success is a result of<br />
support from local communities, parents and schools for the<br />
programme to develop and continue and future funding.<br />
<strong>Community</strong> Development<br />
Programme<br />
Our successful application for government funding to run a<br />
<strong>Community</strong> Development programme commenced at the end<br />
of 2010. A community development advisor was appointed to<br />
work with the community to achieve an overall project aim to<br />
‘enable people living and working in <strong>Hurunui</strong> to live a “whole<br />
life” in the district; to strengthen the wellbeing of families and<br />
promote a strong sense of community belonging, encouraging<br />
people to be involved in local activities and support volunteer<br />
services’. The programme has a set of outcomes and initiatives<br />
for the community development advisor to deliver on. The<br />
programme is intended to be finite and to conclude at the end<br />
of June 2013.<br />
Grants and Service Awards<br />
We have 4 Service Awards which are presented annually. They<br />
are:<br />
1. <strong>Community</strong> Service Awards for those who have given<br />
extended periods of exceptional volunteer service.<br />
2. Secondary School Achievers Awards for promising<br />
secondary students who will benefit from additional<br />
financial assistance to undertake further study.<br />
3. MainPower <strong>Hurunui</strong> Natural Environment Fund to<br />
encourage and assist with voluntary work that benefits<br />
the natural environment.<br />
4. <strong>Hurunui</strong> Heritage Fund to encourage and assist with<br />
voluntary work that protects, enhances, explains or<br />
restores significant heritage values of the district.<br />
96
<strong>Hurunui</strong> <strong>Community</strong> <strong>Long</strong> <strong>Term</strong> <strong>Plan</strong> <strong>2012</strong> - <strong>2022</strong><br />
We also act as an agent and disburse grants on behalf of 2<br />
government funded initiatives:<br />
• Creative Communities Scheme to increase participation<br />
and diversity in the arts at the local level.<br />
• SPARC to encourage junior sporting teams to<br />
participate in sporting activities by assisting with travel<br />
costs.<br />
We also pay a contribution toward the:<br />
• Canterbury Museum which is a legislative requirement.<br />
We are represented on the Canterbury Museum<br />
Board as we share a North Canterbury member with<br />
Waimakariri <strong>District</strong> <strong>Council</strong>. We consistently send<br />
the message that the museum must be run as cost<br />
effectively as possible to minimise the rate burden on<br />
our community but at the same time, get value for<br />
money.<br />
• The North Canterbury Sport and Recreation Trust<br />
to recognise sporting excellence amongst our young<br />
people.<br />
<strong>Plan</strong>s for the future<br />
Library<br />
We are planning to move the Cheviot community library from<br />
the Cheviot Area School and position it in the Cheviot Service<br />
Centre building on the main street. This will be more accessible<br />
to all and parking will be available directly outside the building.<br />
Library and <strong>Council</strong> services will be delivered from the one site.<br />
The new hours and days it will be opening are being considered<br />
by a working group comprising of Cheviot local people.<br />
All library items will continue to be updated as appropriate to<br />
meet the needs of the district. One of our challenges is to<br />
keep up with technology and improvements while at the same<br />
time, be mindful of the cost to the ratepayer and assessing the<br />
value of any new service or product. Technology is an area that<br />
continues to develop at a fast pace and customers are generally<br />
receptive to these types of enhancements. Because of the fast<br />
pace of change, it is difficult to accurately predict what will be<br />
available in the near future, let alone the life of this plan.<br />
within the Canterbury region to enable our customers to use<br />
other libraries with a <strong>Hurunui</strong> library card and vice versa.<br />
Youth Programme<br />
We plan to continue to deliver the programme along similar<br />
lines to the current format. Whereas we do not have plans to<br />
change, incremental change will naturally occur in the ensuing<br />
years as the youth influence the look of the programme.<br />
<strong>Community</strong> Development<br />
Programme<br />
We plan to continue to deliver on the programme as anticipated<br />
when we applied for funding. There are no plans to continue<br />
the programme beyond 2013. The purpose of the programme<br />
is to increase the communities’ capabilities so that the<br />
programme is not actually required any longer. We committed<br />
to the programme on that basis and have not intended for it to<br />
continue beyond 2013.<br />
Grants and Service Awards<br />
Funding was agreed to in 2009 to support the North Canterbury<br />
Sport and Recreation Trust to help fund a primary school<br />
sport coaching programme for the 28 schools in the North<br />
Canterbury area. This initiative commenced in 2009 and was<br />
backed by SPARC for the first 3 years to get it up and running.<br />
<strong>Hurunui</strong> will contribute to the programme from year <strong>2012</strong> to<br />
enable the programme (and the expected long term benefits)<br />
to continue.<br />
Our levy to the Canterbury Museum for running costs is<br />
$53,842 for the 2011/<strong>2012</strong> year. This is set to increase over<br />
the 10 year period to an estimated $110,213 for 2021/<strong>2022</strong><br />
year. The Museum intends to proceed with a redevelopment<br />
project that has been signalled in their previous Annual <strong>Plan</strong>s.<br />
The redevelopment has been estimated at costing $63.7 million<br />
and is scheduled to occur between 2013 and 2016. The levy<br />
which will be imposed on our <strong>Council</strong> for the proposed capital<br />
development, in addition to the operational levy <strong>Council</strong> pays,<br />
has been budgeted at; $50,000 for 2013/2014; $100,000 for<br />
2014/2015; and $50,000 for 2015/2016. We have no ability to<br />
decline paying this fund once the Museum’s <strong>Plan</strong> and budget is<br />
approved by the Canterbury Museum Board.<br />
A review of our library hours is undertaken from time to time<br />
to check whether we are open to the public at the best times<br />
for most people. As an example the Hanmer Springs Library<br />
increased its opening hours in 2009.<br />
We work with other libraries to enhance the services offered<br />
to our district and to make efficiencies where possible. For<br />
example, we have shared agreements with some other libraries<br />
97
www.hurunui.govt.nz<br />
Funding<br />
Library<br />
Operational Costs:<br />
• Library user charges (overdue fines, book reserves etc).<br />
• The libraries in Amberley and Hanmer Springs are<br />
located on reserves, therefore, the net operational<br />
costs are funded through the surplus from the Hanmer<br />
Springs Thermal Reserve.<br />
• The libraries in Culverden, Hawarden and Cheviot are<br />
not located on reserves and as such, the funding of the<br />
operational costs for these is made from an allocation<br />
from the <strong>Council</strong>’s treasury surplus. Therefore, there is<br />
no rating input to operate the libraries.<br />
Capital Costs:<br />
• Significant Capital Expenditure on land and building may<br />
be funded from the Hanmer Springs Thermal Reserve<br />
surplus, <strong>Council</strong> reserves or loans according to the<br />
<strong>Council</strong>’s Internal Financing Policy.<br />
• If the Capital Expenditure caters for future growth, then<br />
the portion of the expenditure that relates to growth<br />
may be funded via Development Contributions.<br />
• The construction of the <strong>Hurunui</strong> Memorial Library was<br />
funded from two loans as per the <strong>Council</strong>’s Internal<br />
Financing Policy. The first loan represented the majority<br />
of the cost. The repayments of principal and interest for<br />
the majority of the loan are funded through development<br />
contributions. The second loan of $260,000 has been<br />
paid by the Amberley Ward ratepayers since 2004 at<br />
$16.00 per rating unit. This has been used to fund the<br />
interest and principal repayments.<br />
Youth Programme<br />
Operational Costs:<br />
• The Youth Programme is run via the Library service and<br />
funded through the Hanmer Springs Thermal Reserve<br />
surplus<br />
<strong>Community</strong> Development<br />
Programme<br />
Operational Costs:<br />
Grants and Service Awards<br />
Operational Costs:<br />
• Uniform Annual General Charge<br />
<strong>Council</strong> Owned Assets<br />
Library<br />
• <strong>Hurunui</strong> Memorial Library, Amberley<br />
• Hanmer Springs Service Centre/Library<br />
• Waiau Hall (which houses the community library)<br />
• Cheviot Service Centre (soon to include the community<br />
library)<br />
• Computers, hardware and software<br />
• Books, CDs, Videos etc<br />
Youth Programme<br />
• Vehicle<br />
• Programme tools (computers, cameras, projector,<br />
games etc)<br />
<strong>Community</strong> Development<br />
Programme<br />
• Not applicable<br />
Grants and Service Awards<br />
• Not applicable<br />
Maintenance and Operating Implications<br />
Library<br />
Apart from the initial alterations to the Cheviot Service Centre<br />
to accommodate the library, there is no real change planned<br />
for upcoming maintenance and operating costs, which includes<br />
routine repairs and keeping buildings in good condition.<br />
Library resources (books, videos etc) are purchased through an<br />
annual budget provision. Donated or locally fundraised items<br />
are either vested in the <strong>Council</strong> or ownership is held by the<br />
donor as agreed.<br />
Some of the library computers and software are owned and<br />
supported through a government funded programme (called the<br />
Aotearoa People’s Network). Maintenance and operating costs<br />
are through them.<br />
• Funded through a grant from the Department of<br />
Internal Affairs<br />
98
<strong>Hurunui</strong> <strong>Community</strong> <strong>Long</strong> <strong>Term</strong> <strong>Plan</strong> <strong>2012</strong> - <strong>2022</strong><br />
Youth Programme<br />
The <strong>Council</strong> plans to support the programme by providing<br />
funds to pay a youth coordinator and running costs for a vehicle.<br />
There is no provision for a replacement vehicle or to replace<br />
programme tools as the programme was not initially intended<br />
to progress beyond 3 years. It is intended that any replacement<br />
items needed would be paid for through fundraising.<br />
<strong>Community</strong> Development<br />
Programme<br />
The programme’s main resource is the community development<br />
advisor. There are no maintenance and operating implications as<br />
this is fully funded and supported by the Department of Internal<br />
Affairs.<br />
Grants and Service Awards<br />
<strong>Council</strong> acts as an agent in administering and distributing<br />
grants on behalf of 2 government funded initiatives (SPARC and<br />
Creative Communities). Both organisations provide assistance<br />
to manage the schemes by setting the criteria for funding<br />
distribution. <strong>Council</strong> staff administer the other grants and<br />
awards internally.<br />
Assumptions and Risks<br />
Library<br />
It is assumed that the Cheviot community library will move into<br />
the Cheviot Service Centre. We are planning to run the new<br />
Cheviot library/service centre at the same cost as it is to run<br />
the service centre and library staffing now.<br />
We are not planning to move any other libraries and assume<br />
they will continue to operate in their current buildings and<br />
locations. However, we do need to be mindful that at any stage<br />
the schools could opt to discontinue their association with the<br />
<strong>Council</strong> and choose to quit the community libraries from their<br />
schools. We do not have contingency plans if this was to be the<br />
case, but it is unlikely.<br />
The smaller volunteer run libraries are only likely to continue<br />
as long as there are people willing to take on this responsibility<br />
on a volunteer basis. The cost of transferring these libraries to<br />
the <strong>District</strong> library network and staffing them is likely to be cost<br />
prohibitive.<br />
The libraries have computers and internet services supplied<br />
through the national APNK programme at no cost to us. We<br />
cannot guarantee that this will be available to NZ’s libraries<br />
for ever and at some point, we may need to carry this cost or<br />
reconsider ongoing free internet usage.<br />
Youth Programme<br />
It is assumed that the Youth Programme will continue throughout<br />
the life of the long term plan and be funded via profits from the<br />
Hanmer Springs Thermal Reserve. If this method of funding was<br />
no longer available, (for example, if the profits were less than<br />
anticipated and there was less to spend), the programme would<br />
be funded through general rates instead. It is also assumed that<br />
there will be on going alternative funding opportunities to apply<br />
for grants to support the programme and thereby reduce the<br />
reliance on the thermal reserve profits or general rates. In the<br />
event there is no funding available, and the community is not<br />
prepared to fund it, the programme would cease to continue.<br />
<strong>Community</strong> Development<br />
Programme<br />
It is assumed that the <strong>Community</strong> Development Programme will<br />
cease once the government funding finishes in June 2013. In the<br />
event the community and the <strong>Council</strong> consider the programme<br />
worth continuing beyond 2013, the cost would likely to be met<br />
via general rates.<br />
Grants and Service Awards<br />
It is assumed that the grants and service awards currently<br />
provided for will continue. Some external funding is received<br />
toward these and should this cease to be available, <strong>Council</strong> will<br />
need to reconsider its position regarding the on-going financial<br />
support of its grants.<br />
Shared Services<br />
Library<br />
We operate our community library service in conjunction with<br />
school libraries in three district area schools (Amuri, Cheviot<br />
and <strong>Hurunui</strong>). Our new library management programme was<br />
a shared purchase with several other libraries throughout New<br />
Zealand. This has a shared helpdesk and IT support.<br />
Grants and Service Awards<br />
The Mainpower <strong>Hurunui</strong> Natural Environment Fund is a joint<br />
collaboration between Mainpower, which donates $4,000<br />
towards it, and we match it with another $4,000 each year.<br />
Under legislation, <strong>Hurunui</strong>, Waimakariri and Selwyn <strong>District</strong><br />
<strong>Council</strong>’s along with Christchurch City <strong>Council</strong> contribute to<br />
the cost of running the Canterbury Museum. The Museum is<br />
overseen by a Board, of which we share a membership role with<br />
Waimakariri <strong>Council</strong>.<br />
99
www.hurunui.govt.nz<br />
Goals and Performance Measures<br />
<strong>Community</strong> Outcomes<br />
1. A desirable and safe place to live<br />
2. A place where our traditional rural values and heritage make <strong>Hurunui</strong> unique<br />
Goals<br />
Provide community services<br />
that are valued by people in<br />
the <strong>District</strong><br />
How we will achieve our<br />
Goals<br />
Run a youth programme that<br />
meets the needs of our local<br />
youth*<br />
Run the <strong>Community</strong><br />
Development Programme<br />
with specific outcomes<br />
Undertake a residents<br />
satisfaction survey<br />
Reward and recognise<br />
outstanding contribution<br />
from people in the <strong>District</strong><br />
Performance Measures Current Situation 11/12 12/13 13/14 14/15 15+<br />
Youth events attendances<br />
reach no less than the<br />
minimum desired<br />
The projects short term<br />
outcomes will be achieved<br />
Satisfaction with library<br />
customers is maintained or<br />
continues to improve<br />
Awards and funds are<br />
dispersed according to the<br />
criteria annually<br />
Attendance numbers have<br />
been documented for each<br />
event, they have not been<br />
analysed over the year<br />
The programme is behind<br />
schedule due to staffing gaps<br />
but we aim to catch up by<br />
Dec <strong>2012</strong><br />
Satisfaction levels with those<br />
who use the current library<br />
service is 96% by those who<br />
use the service, and 84% if we<br />
count those who do not use<br />
the library<br />
All awards were distributed<br />
and most funds dispersed.<br />
A small sum of funds was<br />
transferred to the next<br />
year from the Creative<br />
Communities fund.<br />
√ √ √ √<br />
√<br />
√<br />
√<br />
√ √ √ √<br />
*We have found that a successful event held for youth has a good attendance. It can be difficult to measure what a ‘good’ attendance is. For<br />
each event, we estimate how many attendees there need to be to make it worthwhile. This is not necessarily based on cost and depends very<br />
much on the type of event. Some events (eg: dances) can have up to 100 attendees, whereas others (eg: photography) might only cater for 10.<br />
Financial Summary<br />
A financial summary for this activity is shown on the next page.<br />
100
<strong>Hurunui</strong> <strong>Community</strong> <strong>Long</strong> <strong>Term</strong> <strong>Plan</strong> <strong>2012</strong> - <strong>2022</strong><br />
<strong>Community</strong> Services - Activity Financial Summary<br />
Annual <strong>Plan</strong> Year 1 Year 2 Year 3 Year 4 Year 5 Year 6 Year 7 Year 8 Year 9 Year 10<br />
2011/<strong>2012</strong> <strong>2012</strong>/2013 2013/2014 2014/2015 2015/2016 2016/2017 2017/2018 2018/2019 2019/2020 2020/2021 2021/<strong>2022</strong><br />
Operating Statement<br />
Operating Revenue<br />
<strong>District</strong> Wide Rates 111,231 125,256 183,171 245,584 207,940 164,669 171,323 178,239 186,694 193,770 202,051<br />
Targeted Rates 1,322,703 659,430 690,448 690,512 712,141 750,247 759,789 804,281 830,932 859,808 899,290<br />
Other Income 152,809 171,950 94,828 97,715 100,814 104,133 107,094 110,119 113,604 117,429 121,273<br />
Internal Interest Received 1,577 282 772 1,441 1,924 2,381 3,167 4,256 5,678 7,210 8,191<br />
Development Contributions 40,698 37,854 38,777 40,624 30,798 0 0 0 0 0 0<br />
Total Operating Revenue 1,629,018 994,772 1,007,996 1,075,878 1,053,617 1,021,430 1,041,373 1,096,896 1,136,908 1,178,217 1,230,804<br />
Operating Expenditure<br />
Employee Benefits 481,512 559,940 494,474 509,529 525,687 542,996 558,434 574,209 592,381 612,326 632,368<br />
Direct Operating Expenditure 317,643 340,680 394,078 459,864 429,735 395,907 406,697 420,157 437,672 451,487 468,077<br />
Internal Interest Paid 181,808 139,671 140,484 137,711 144,326 175,475 171,652 169,787 166,044 165,085 156,667<br />
<strong>Council</strong> Overheads Expenditure 443,281 502,662 513,161 529,880 537,137 550,357 562,698 574,570 594,306 605,220 620,842<br />
Depreciation 118,136 109,842 109,842 112,344 112,444 112,444 114,121 114,121 114,121 116,611 116,611<br />
Total Operating Expenditure 1,542,380 1,652,796 1,652,039 1,749,328 1,749,329 1,777,179 1,813,602 1,852,844 1,904,523 1,950,729 1,994,565<br />
Operating Surplus (Deficit) 86,638 (658,024) (644,043) (673,451) (695,712) (755,749) (772,229) (755,948) (767,615) (772,512) (763,761)<br />
Capital Statement<br />
Capital Expenditure<br />
Library 92,654 65,000 67,548 69,797 72,196 74,796 77,643 80,789 84,234 88,082 92,131<br />
Total Capital Expenditure 92,654 65,000 67,548 69,797 72,196 74,796 77,643 80,789 84,234 88,082 92,131<br />
Funds Required<br />
Operating Deficit 0 658,024 644,043 673,451 695,712 755,749 772,229 755,948 767,615 772,512 763,761<br />
Capital Expenditure 92,654 65,000 67,548 69,797 72,196 74,796 77,643 80,789 84,234 88,082 92,131<br />
Transfer to General <strong>Council</strong> Reserves 72,953 72,953 72,953 72,953 72,953 72,953 72,953 72,953 72,953 72,953 72,953<br />
Repayment of Internal Loans from Operating Income 956,180 162,794 184,904 176,509 172,428 132,823 136,712 171,372 182,237 203,973 236,812<br />
1,121,787 958,771 969,448 992,710 1,013,288 1,036,320 1,059,536 1,081,062 1,107,038 1,137,520 1,165,656<br />
Funded by<br />
Operating Surplus 86,638 0 0 0 0 0 0 0 0 0 0<br />
Transfer from Hanmer Springs Thermal Reserve 824,359 770,644 792,057 810,569 828,649 849,081 867,773 886,153 908,684 932,827 956,914<br />
Non Cash Expenditure - Depreciation 118,136 109,842 109,842 112,344 112,444 112,444 114,121 114,121 114,121 116,611 116,611<br />
Transfer from General <strong>Council</strong> Reserves 92,654 78,285 67,548 69,797 72,196 74,796 77,643 80,789 84,234 88,082 92,131<br />
1,121,787 958,771 969,448 992,710 1,013,288 1,036,320 1,059,536 1,081,062 1,107,038 1,137,520 1,165,656<br />
H:\<strong>Long</strong> <strong>Term</strong> <strong>Plan</strong> Workings\<strong>Hurunui</strong> <strong>District</strong> <strong>Council</strong> LTP Budgets <strong>2012</strong>-<strong>2022</strong> - Post Submissions.xls 31/05/<strong>2012</strong> 9:34 a.m.<br />
101
www.hurunui.govt.nz<br />
Activity 2: Property<br />
Overview<br />
The Property activity includes the <strong>Council</strong>’s:<br />
• Buildings (housing, medical centres, and halls)<br />
• Public toilets<br />
• Swimming pools<br />
• Township maintenance (street cleaning, grass mowing,<br />
and township maintenance)<br />
Current Situation<br />
Buildings<br />
We own and maintain a variety of buildings as shown below:<br />
• Some commercial premises that are leased to small<br />
businesses<br />
• 34 housing units for the elderly – 12 in Amberley, 13 in<br />
Cheviot, 4 in Hanmer Springs and 5 in Waikari<br />
• 3 residential houses – 1 in Leithfield Beach, 1 in Cheviot<br />
and 1 in Hanmer Springs.<br />
• 5 water and sewerage depots<br />
• 4 <strong>Council</strong> service centres / libraries<br />
• 5 closed landfills<br />
• 5 transfer stations<br />
• 4 medical centres - Cheviot, Hanmer Springs, Rotherham<br />
and Waikari<br />
• 2 doctors houses - Cheviot and Rotherham<br />
• 14 halls throughout the <strong>District</strong><br />
Public Toilets<br />
Throughout the district, there are:<br />
• 14 toilet blocks located on reserves<br />
• 16 district public toilets sited either on reserves or<br />
<strong>Council</strong> freehold property<br />
• 2 privately owned toilets which we contribute to the<br />
maintenance of<br />
All of the district toilets have been built or renovated within the<br />
last 10 years so are in a very good condition. The toilets are<br />
cleaned mainly via contracted services.<br />
Swimming Pools<br />
Our most well-known pool complex is the Hanmer Springs<br />
Thermal Pools and Spa. This complex is not included in this<br />
section and has a chapter of its own under the same name.<br />
This section refers to our other public swimming pools located<br />
in Amberley and Rotherham. Both pools only operate during<br />
the summer months. The Amberley swimming pool is staffed<br />
and operates as a public swimming pool. It is covered, but<br />
not heated and is reliant on the sun to heat the water. The<br />
Rotherham swimming pool is not covered or heated either and<br />
is managed by the local swimming club and school, and they<br />
determine who uses the pool. Only the Amberley swimming<br />
pool has paid life guards and staff.<br />
Township Maintenance<br />
Ratepayers in each of the wards pay an amenity rate to fund<br />
the general maintenance of their townships. Managing the<br />
township maintenance this way seems to be popular by locals<br />
as this enables people to have a say on where their rates are<br />
spent. Ward and community type committees are very active in<br />
the <strong>District</strong> with regard to planning and maintaining their areas.<br />
We employ some gardeners and maintenance staff, but contract<br />
out most township work to contractors for the likes of grass<br />
mowing and general maintenance work.<br />
<strong>Plan</strong>s for the future<br />
Buildings<br />
A toilet expansion is planned for the Amberley <strong>Council</strong> Office<br />
in <strong>2012</strong>/13. The toilet block inside the building, beside <strong>Council</strong><br />
Chambers is the original toilet block built over 30 years ago and<br />
is inadequate to meet the needs of public meetings nowadays.<br />
The cost estimated to extend and update these toilets is<br />
$45,000.<br />
For some years now, it has been planned to move the Amberley<br />
Transfer Station from its current site due to the resource<br />
conditions expiring. A new location is nearing confirmation and<br />
the move will occur in the <strong>2012</strong>/13 year. The cost of building<br />
a new station has been carried over and into the long term<br />
budget from earlier years.<br />
The Cheviot medical centre is outdated and $1 million has been<br />
factored into the 2016/17 budget to either upgrade the existing<br />
facility or to build a new medical centre. A full project scope<br />
will be done before any building takes place to ensure that what<br />
is built does meet the needs of the community into the future.<br />
The $1 million has been based on the recent medical centre<br />
built in Rotherham. Inflation has been added to the million for<br />
the 2016/17 year.<br />
A major upgrade of the Hanmer Springs sport stadium is planned<br />
for 2015/16 at a budgeted cost of $1 million. This is an estimate<br />
102
<strong>Hurunui</strong> <strong>Community</strong> <strong>Long</strong> <strong>Term</strong> <strong>Plan</strong> <strong>2012</strong> - <strong>2022</strong><br />
only at this stage. $30,000 of that fund will be advanced to the<br />
<strong>2012</strong>/13 year to undertake a feasibility study before the upgrade<br />
is done.<br />
Also in Hanmer Springs, it is planned to extend the community<br />
hall which has been found inadequate for the use it gets.<br />
$194,000 has been set in the 2014/15 budget with a further<br />
$10,000 to be spent in <strong>2012</strong>/13 to repair the hall stage.<br />
With all of the above capital expenditure planned, although<br />
these figures are mainly estimates until further scoping is done,<br />
we consider these amounts to be maximum amounts and of<br />
primary importance, is what local communities consider to be<br />
affordable.<br />
Public Toilets<br />
An upgrade of the old toilet block in Hanmer Springs is planned<br />
for <strong>2012</strong>/13 at a cost of $30,000.<br />
A budget provision of $90,000 has been identified in 2017/18<br />
to build a new toilet block in Rotherham. There are no public<br />
toilets currently there. However, before committing to this<br />
expenditure, the need for public toilets in Rotherham will be<br />
reviewed again when the next long term plan is developed in<br />
2015.<br />
Swimming Pools<br />
The Amberley swimming pool is reaching the end of its useful<br />
life and it is estimated that it will last another 7 years or so.<br />
This pool has been the subject of much discussion in the past,<br />
with a community desire to have a recreational swimming pool<br />
facility that is heated, covered and can operate all year round. It<br />
has been argued that this type of facility would attract a more<br />
patrons to the pool from throughout the district and other<br />
areas. The existing facility is being maintained in the meantime,<br />
but the Amberley Ward Committee has been investigating<br />
options to either replace or remediate the current pool.<br />
$3 million had been budgeted in the previous long term plan,<br />
but this provision has been removed until the Ward Committee<br />
is able to recommend their preferred course of action and the<br />
cost involved. The original $3 million was proposed to have<br />
been funded 3 equal ways; Amberley Amenities Rate, <strong>Council</strong><br />
general rate and community fundraising. No fundraising has<br />
yet taken place. Before a budget is identified and put to the<br />
public to consider, more information is being sought. Therefore,<br />
while there is no current budget identified at this stage, we are<br />
prepared to provide for this once we have more information to<br />
provide the community with first. We are planning to consult<br />
with the public once we have more information and facts to<br />
communicate so that people can make a considered opinion.<br />
Township Maintenance<br />
Various township maintenance plans are to occur over the<br />
next few years and this is shown in more detail in the Township<br />
Profile section earlier in this document.<br />
Our main aim is to continue to maintain the existing local<br />
facilities to a suitable standard depending on their use. The<br />
demand for local facilities and maintenance plans is assessed<br />
by taking into account residential, tourism and business growth<br />
patterns, facility usage patterns, surveys and submissions.<br />
Funding<br />
Buildings<br />
Rented Properties Operational Costs:<br />
• Rents are intended to be affordable, but consideration<br />
to the local market is given. In most cases, the rental<br />
covers all operational costs.<br />
• Any shortfall to be met from a local amenity rate (in<br />
the case of medical centres or local amenities), or from<br />
the <strong>District</strong> Rate on Capital Value (for pensioner and<br />
residential housing).<br />
Rented Properties Capital Costs:<br />
• Any portion of expenditure relating to growth may<br />
be funded from future lots or units of demand within<br />
the ward or community rating area via development<br />
contributions.<br />
Medical Centres Operational Costs:<br />
• 100% user charges with any shortfall funded by a medical<br />
centre rate within the relevant ward or community<br />
rating area.<br />
Medical Centres Capital Costs:<br />
• Loan funded by a medical centre rate within the relevant<br />
ward or community rating area.<br />
• If the <strong>District</strong> should contribute (in the past, there has<br />
been a $150,000 contribution made to each community)<br />
then the amount of the contribution is subtracted from<br />
the loan.<br />
• Any portion of expenditure relating to growth may<br />
be funded from future lots or units of demand within<br />
the ward or community rating area via development<br />
contributions.<br />
103
www.hurunui.govt.nz<br />
Public Toilets<br />
Toilets Provided on Tourist Routes:<br />
• 100% <strong>District</strong> Rate or use of surpluses from the Hanmer<br />
Springs Thermal Reserve.<br />
Ward or <strong>Community</strong> Rating Area Toilets:<br />
• Included in Township Maintenance is 100% local amenity<br />
rate on the local ward or community rating area.<br />
• If the <strong>Council</strong> decides to apply some of the surplus<br />
from the Hanmer Springs Thermal Reserve, the amount<br />
of the contribution is subtracted from the <strong>District</strong> Rate.<br />
• If any of the Capital Expenditure caters for future<br />
growth, then that portion of the expenditure that<br />
relates to growth may be funded from future lots via<br />
Development Contributions and loans.<br />
Swimming Pools<br />
Operational Costs:<br />
• 100% Local Amenity Rate.<br />
Capital Costs:<br />
• This depends on who will use the pool. If mainly the<br />
local ward, then loan funded within the relevant ward<br />
or rating area. If use is also expected to be district wide,<br />
a portion may be decided to be funded via the <strong>District</strong><br />
Rate. <strong>Community</strong> fundraising may also be expected.<br />
Township Maintenance<br />
Operational and Capital Costs:<br />
• 100% local amenity rate.<br />
<strong>Council</strong> Owned Assets<br />
Buildings<br />
• Commercial premises<br />
• 34 pensioner housing units<br />
• 3 residential houses<br />
• 5 water and sewerage depots<br />
• 4 <strong>Council</strong> service centres / libraries<br />
• 5 closed landfills<br />
• 5 transfer stations<br />
• 4 medical centres<br />
• 2 doctors houses<br />
• 14 halls<br />
Public Toilets<br />
• 14 public toilet blocks<br />
• 16 district public toilets<br />
Swimming Pools<br />
• 2 public swimming pools (excluding Hanmer Springs<br />
Thermal Pools and Spa)<br />
Township Maintenance<br />
• Not applicable<br />
Maintenance and Operating Implications<br />
Buildings<br />
A property review is undertaken every several years to assess<br />
the state of the property portfolio and to enable a suitable<br />
maintenance programme to be put in place. Generally, all<br />
properties are maintained to a level that keeps them functional.<br />
Maintenance and upkeep is undertaken by contractors.<br />
Public Toilets<br />
The maintenance of these facilities, including cleaning and<br />
replenishing of supplies is contracted out.<br />
Swimming Pools<br />
Both swimming pools are aged pools and maintained to a basic<br />
level to keep them operational and safe. Both pools, particularly<br />
the Amberley swimming pool, have regular maintenance and<br />
repair costs to keep them functional. Most work on the<br />
Amberley pool is done by staff, but contractors are used for<br />
specialist jobs (such as plumbing).<br />
Township Maintenance<br />
We intend to retain ownership of the properties and facilities as<br />
outlined in this section. The local Ward Committees and Boards<br />
have the delegated responsibility to authorise improvements in<br />
their particular Ward through the use of amenity rating. For<br />
physical works, we employ some gardeners and cleaners (mostly<br />
part time), however most work in this activity area is done by<br />
contractors. Many of the <strong>District</strong>’s halls are managed by the<br />
local Reserve Committee or Hall Committee.<br />
104
<strong>Hurunui</strong> <strong>Community</strong> <strong>Long</strong> <strong>Term</strong> <strong>Plan</strong> <strong>2012</strong> - <strong>2022</strong><br />
Assumptions and Risks<br />
Buildings<br />
It is assumed that we will continue to own the buildings we<br />
currently have, and we are not planning on increasing our stock.<br />
There is some risk in this, such as:<br />
• We only provide pensioner housing in Amberley,<br />
Cheviot, Hanmer Springs and Waikari. This may<br />
inadvertently have social and cultural impacts upon the<br />
age demographics in local communities as the elderly<br />
population becomes concentrated in certain areas<br />
only. This may result in higher demands on some local<br />
services and facilities. Demand for pensioner housing in<br />
some parts of the <strong>District</strong> at times is greater than our<br />
supply. This could result in some older people leaving<br />
the <strong>District</strong> when we are in fact keen for residents of all<br />
ages to be able to live in the community of their choice.<br />
Township Maintenance<br />
It is assumed that the current facilities as described in this<br />
section will continue to be needed by the local communities.<br />
It is also assumed that the communities expect us to maintain<br />
the facilities and amenities at the lowest cost possible. As the<br />
population in the <strong>District</strong> changes, there are possible issues for<br />
rate payers when having to fund facilities to match residents’ and<br />
visitors’ expectations. Given the rural nature of the district, and<br />
consequential small population, the costs can pose challenges.<br />
• The <strong>Hurunui</strong> <strong>District</strong> has an aging population that is<br />
expected to increase for the next several years. This<br />
is expected to place additional demand for low cost<br />
housing options for aging and retired people, as well<br />
as retirement homes and villages. We believe that this<br />
demand is best met by the private sector.<br />
We have assumed that the community will continue to support<br />
the need for us to build medical centres and keep them<br />
relevant to the needs of modern medicine to attract medical<br />
professionals to our <strong>District</strong>.<br />
Public Toilets<br />
We intend to continue to own, control and manage public<br />
toilets throughout the district and replace them or build more<br />
as required and can be properly justified. Discussion does take<br />
place from time to time on the funding model for public toilets,<br />
and whether or not the public should directly pay to use them.<br />
Free use has been assumed for this long term plan.<br />
Swimming Pools<br />
Aside from routine maintenance and repairs, there is no budget<br />
put aside to replace or significantly upgrade the two existing<br />
swimming pools. There is a risk that the cost of doing so will<br />
be greater than the community is prepared to pay. In the event<br />
that the pools do fail and are not replaced, the local community<br />
could be disadvantaged by not having this service at its disposal.<br />
It is assumed that there is significant public support to either<br />
replace or upgrade any pools before committing to the cost<br />
involved.<br />
105
www.hurunui.govt.nz<br />
Goals and Performance Measures<br />
<strong>Community</strong> Outcomes<br />
1. A desirable and safe place to live<br />
2. A place where our traditional rural values and heritage make <strong>Hurunui</strong> unique<br />
Goals<br />
To provide and maintain<br />
buildings to support activities<br />
and recreational needs for local<br />
communities<br />
To maintain townships so they<br />
are neat and tidy<br />
How we will achieve our<br />
Goals<br />
Maintain, upgrade or build<br />
new medical centres<br />
suitable for modern<br />
medical procedures<br />
Consult with the<br />
community about the<br />
future of the Amberley<br />
swimming pool<br />
Investigate complaints<br />
about the standard of any<br />
<strong>Council</strong> owned facilities<br />
Undertake a residents<br />
satisfaction survey<br />
Performance Measures Current Situation 11/12 12/13 13/14 14/15 15+<br />
Build a new medical<br />
centre (or significantly<br />
upgrade the existing one)<br />
Decide on the course of<br />
action to be taken (build<br />
or upgrade or abandon)<br />
depending on community<br />
views<br />
All complaints are<br />
followed up within 48<br />
hours<br />
Resident satisfaction<br />
over attractiveness<br />
and neatness of their<br />
townships is maintained<br />
or improved<br />
The Cheviot medical centre<br />
requires a rebuild or upgrade<br />
but identified as inadequate<br />
for the future<br />
The current swimming pool<br />
in Amberley is expected<br />
to last for another five or<br />
so years before it will no<br />
longer be usable. The Ward<br />
Committee is considering<br />
where to from here. There<br />
is no financial provision for<br />
a new or upgraded pool at<br />
this stage<br />
Complaints have been<br />
recorded in variable ways<br />
up until now. We have a<br />
customer service request<br />
programme to log all<br />
complaints and show when<br />
they have been actioned<br />
90% of residents considered<br />
their townships to be well<br />
kept and 85% said they were<br />
attractive<br />
√<br />
√<br />
√<br />
√ √ √ √<br />
√<br />
√<br />
Financial Summary<br />
A financial summary for this activity is shown on the next page.<br />
106
<strong>Hurunui</strong> <strong>Community</strong> <strong>Long</strong> <strong>Term</strong> <strong>Plan</strong> <strong>2012</strong> - <strong>2022</strong><br />
Property - Activity Financial Summary<br />
Annual <strong>Plan</strong> Year 1 Year 2 Year 3 Year 4 Year 5 Year 6 Year 7 Year 8 Year 9 Year 10<br />
2011/<strong>2012</strong> <strong>2012</strong>/2013 2013/2014 2014/2015 2015/2016 2016/2017 2017/2018 2018/2019 2019/2020 2020/2021 2021/<strong>2022</strong><br />
Operating Statement<br />
Operating Revenue<br />
<strong>District</strong> Wide Rates * 5,056 (45,358) (48,498) (52,863) (54,846) (56,270) (57,400) (59,202) (60,511) (62,646) (64,922)<br />
Targeted Rates 167,259 535,296 544,235 559,364 576,635 577,339 641,446 645,308 667,497 681,234 687,458<br />
Other Income 398,690 400,800 413,345 425,930 439,437 453,906 466,812 479,998 495,188 511,862 528,615<br />
Development Contributions 92,691 60,911 63,460 65,489 67,573 74,640 76,814 79,761 83,219 87,003 70,694<br />
Total Operating Revenue 663,696 951,649 972,542 997,921 1,028,799 1,049,614 1,127,671 1,145,865 1,185,394 1,217,453 1,221,846<br />
Operating Expenditure<br />
Employee Benefits 141,524 143,127 147,607 152,101 156,924 162,091 166,700 171,409 176,833 182,787 188,770<br />
Direct Operating Expenditure 793,641 756,820 728,428 747,323 787,895 790,847 820,904 848,284 871,794 900,126 934,203<br />
Internal Interest Paid 115,490 156,772 150,187 141,812 132,642 122,612 180,222 169,595 157,942 145,145 131,091<br />
<strong>Council</strong> Overheads Expenditure 151,854 114,233 116,946 121,232 122,518 125,543 128,272 131,046 136,017 137,683 141,156<br />
Depreciation 170,037 222,270 224,071 280,936 305,541 308,155 336,171 337,952 339,809 357,573 359,604<br />
Total Operating Expenditure 1,372,546 1,393,222 1,367,238 1,443,403 1,505,520 1,509,249 1,632,268 1,658,287 1,682,395 1,723,314 1,754,825<br />
Operating Surplus (Deficit) (708,850) (441,573) (394,696) (445,482) (476,721) (459,635) (504,597) (512,422) (497,002) (505,861) (532,979)<br />
Capital Statement<br />
Capital Expenditure<br />
Rental Property 20,000 0 31,176 0 0 0 0 0 0 0 0<br />
Public Toilets 0 0 0 0 0 103,563 0 0 0 0 0<br />
Medical Centres 0 0 0 0 0 1,150,700 0 0 0 0 0<br />
Halls 15,000 25,000 2,078 206,170 2,221 2,301 2,389 2,486 2,592 2,710 2,835<br />
Pools 0 2,000 2,078 2,148 2,221 2,301 2,389 2,486 2,592 2,710 2,835<br />
Township Maintenance 11,637 88,500 26,500 20,939 20,548 21,288 34,043 21,779 255,940 25,069 26,222<br />
Total Capital Expenditure 46,637 115,500 61,832 229,256 24,991 1,280,154 38,821 26,751 261,124 30,490 31,892<br />
Funds Required<br />
Operating Deficit 708,850 441,573 394,696 445,482 476,721 459,635 504,597 512,422 497,002 505,861 532,979<br />
Capital Expenditure 46,637 115,500 61,832 229,256 24,991 1,280,154 38,821 26,751 261,124 30,490 31,892<br />
Transfer to Special Funds 70,040 46,842 48,609 50,378 51,941 54,008 55,527 57,492 59,967 62,769 51,242<br />
Transfer to General <strong>Council</strong> Reserves 72,060 81,825 70,805 86,710 88,621 77,878 96,163 97,945 99,910 105,020 107,305<br />
Repayment of Internal Loans from Operating Income 96,275 97,719 121,146 130,750 141,353 157,247 146,300 158,477 171,627 185,796 195,231<br />
993,862 783,459 697,089 942,577 783,627 2,028,921 841,408 853,086 1,089,629 889,936 918,648<br />
Funded by<br />
Transfer from Hanmer Springs Thermal Reserve 355,401 395,953 365,540 377,741 398,142 400,218 411,160 433,147 433,624 447,155 473,019<br />
Non Cash Expenditure - Depreciation 170,037 222,270 224,071 280,936 305,541 308,155 336,171 337,952 339,809 357,573 359,604<br />
Transfer from General <strong>Council</strong> Reserves 0 0 22,585 0 0 88,786 0 0 0 0 0<br />
Transfer from Special Funds 36,000 0 0 0 0 0 0 0 0 0 0<br />
Capital Expenditure funded through Internal Loans 432,424 165,236 84,892 283,900 79,944 1,231,762 94,077 81,987 316,196 85,208 86,026<br />
993,862 783,459 697,089 942,577 783,627 2,028,921 841,408 853,086 1,089,629 889,936 918,648<br />
* Surpluses from Other Property and Residential Housing is used to offset the <strong>District</strong> Wide Rates<br />
H:\<strong>Long</strong> <strong>Term</strong> <strong>Plan</strong> Workings\<strong>Hurunui</strong> <strong>District</strong> <strong>Council</strong> LTP Budgets <strong>2012</strong>-<strong>2022</strong> - Post Submissions.xls 31/05/<strong>2012</strong> 9:34 a.m.<br />
107
www.hurunui.govt.nz<br />
Activity 3: Reserves<br />
Overview<br />
The Reserves activity includes the <strong>Council</strong>’s:<br />
• Parks and Reserves<br />
• Cemeteries<br />
Current Situation<br />
Parks & Reserves<br />
There are currently 160 parks, reserves and recreation areas<br />
in our district. This includes the Hanmer Springs Thermal<br />
Reserve, now known as the ‘Hanmer Springs Thermal Pools and<br />
Spa’. This section does not discuss the pools and spa as this<br />
is a significant activity on its own right. Please refer to the<br />
Hanmer Springs Thermal Pools and Spa section of this plan. The<br />
reserves discussed in this section cover the 29 parks (picnic<br />
areas/playgrounds), 10 camping grounds and 146 developed and<br />
undeveloped reserves and plantation areas in the district. The<br />
reserve portfolio now includes approximately 6.0 hectares of<br />
the Queen Mary Hospital Historic Reserve in Hanmer Springs<br />
(formerly owned by the Canterbury <strong>District</strong> Health Board).<br />
Our reserves are highly regarded by those who use and<br />
benefit from them. <strong>Council</strong>’s committee structure includes<br />
several Reserve and Ward Committees which are delegated<br />
responsibilities to ensure reserves are maintained and useful<br />
for people to enjoy. The committees’ memberships include<br />
volunteers and <strong>Council</strong>lors. The work of all of these groups is<br />
sincerely appreciated by <strong>Council</strong>.<br />
In 2011, The <strong>Council</strong> approved a smokefree strategy in<br />
conjunction with Smokefree Canterbury. Our starting point is<br />
to encourage no smoking around children’s playgrounds.<br />
Cemeteries<br />
There are 9 open cemetery reserves throughout our district<br />
located at Balcairn, Cheviot (Homeview), Culverden, Glenmark,<br />
Hanmer Springs, Horsley Down, Rotherham, Waiau, and Waikari.<br />
We also own the Jed Cemetery Reserve in Gore Bay, Cheviot,<br />
which is open only to ashes interments of family members<br />
previously buried there.<br />
Each of the cemeteries has more than enough vacant plots to<br />
last for at least the next 10 years. Of the 9 cemeteries, Balcairn<br />
Cemetery is used the most frequently with approximately 22<br />
plots sold on average each year. In contrast, our least frequently<br />
used cemetery is Rotherham, with an average of 2 plots sold<br />
each year.<br />
Whereas we own the cemetery reserves, we do not employ<br />
staff to dig graves or maintain the cemetery grounds. Instead,<br />
we contract the services of sextons, gardeners and trades<br />
people. Cemetery plots are sold by <strong>Council</strong> staff. Anyone is<br />
able to purchase a plot or to be buried in the cemeteries – they<br />
are not only for <strong>Hurunui</strong> district residents.<br />
<strong>Plan</strong>s for the future<br />
Parks & Reserves<br />
We have had a comprehensive <strong>District</strong> Reserve Management<br />
<strong>Plan</strong> since 2008. The <strong>Plan</strong> is being reviewed to update the<br />
Governance and Management responsibilities and to identify<br />
future development plans for each of the reserves. The current<br />
plan identifies capital projects for some of the reserves but<br />
these are to be removed. Instead capital projects will be<br />
identified through the <strong>Long</strong> <strong>Term</strong> <strong>Plan</strong> process. Each ward is<br />
being allocated money form the Hanmer Springs Thermal Pools<br />
and Spa surplus, known as the ‘contestable fund’ to pay for the<br />
capital projects.<br />
The Queen Mary Hospital Historic Reserve Management <strong>Plan</strong> is<br />
a new plan confirmed in late 2011 and approved by the Minister<br />
of Conservation. That plan sets out the overall management goal<br />
for the reserve and is supported by policies in the plan. It can be<br />
found on our website: www.hurunui.govt.nz and use the search<br />
to find the Queen Mary Hospital Historic Reserve Management<br />
<strong>Plan</strong>. The plan includes a landscape plan for the reserve and<br />
conservation management plans for each of the three historic<br />
buildings on the site. We will be seeking expressions of interest<br />
for the use of the buildings in <strong>2012</strong>. Before we confirm or<br />
agree to any proposals for the use of these buildings, public<br />
consultation will be undertaken first to make sure any proposal<br />
has the support of the wider community.<br />
we will be progressing our Smokefree strategy to include all<br />
<strong>Council</strong> awned reserves. The approach we are taking is to<br />
encourage non smoking in public outdoor areas, but not to<br />
regulate.<br />
Cemeteries<br />
There is a budget provision to purchase land beside the Balcairn<br />
cemetery when it becomes available to future proof our most<br />
popular cemetery. $120,000 has been put aside for 2013/14 to<br />
do this although there is no immediate concern that we will run<br />
out of space for some years.<br />
Most of our cemeteries have many years remaining before they<br />
will run out of space. It is predicted that the demand for plots<br />
within the district’s cemeteries will increase gradually over<br />
the next 50 years, due to the increasing age of the population<br />
within the district. There is generally an increasing trend away<br />
from cemetery burials as people are moving towards cremation<br />
108
<strong>Hurunui</strong> <strong>Community</strong> <strong>Long</strong> <strong>Term</strong> <strong>Plan</strong> <strong>2012</strong> - <strong>2022</strong><br />
services, but this has not impacted on the sales of plots within<br />
the <strong>Hurunui</strong>.<br />
Apart from the purchase of land, there are no major plans for<br />
any of the cemeteries other than to keep them maintained to a<br />
good standard and make sure they look tidy and attractive.<br />
Funding<br />
Parks & Reserves<br />
Operational Costs:<br />
• Amenity Reserves are 100% local amenity rates on<br />
the ward or community rating in which the reserve is<br />
located.<br />
• <strong>District</strong> Reserves are 100% <strong>District</strong> Rate and/or<br />
Hanmer Springs Thermal Reserves surpluses.<br />
• Camping Grounds are 100% user charge with any<br />
shortfall met by a local amenity rate in the ward or<br />
community rating area. Four of the ten Camping<br />
grounds are managed by a lessee, <strong>Council</strong> receives a<br />
portion of the annual turnover for these camps as a<br />
rental.<br />
• If long term funding is required, it can be catered for<br />
under the <strong>Council</strong>’s Internal Financing Policy. The<br />
monies needed to meet the loan costs under the Internal<br />
Financing Policy should be treated as operational<br />
expenditure.<br />
Capital Costs:<br />
• <strong>District</strong> Reserves are funded100% by the <strong>District</strong> Rate<br />
and / or the Hanmer Springs Thermal Reserve surpluses.<br />
• Amenity Reserves are funded100% by the local amenity<br />
rate on the ward or community rating area within<br />
which the reserve in question is located.<br />
• If any of the capital expenditure caters for future<br />
growth, then that portion of the expenditure that<br />
relates to growth maybe funded from future lots or<br />
units of demand via development contributions.<br />
• Contestable Funding is provided each year from the<br />
surpluses from the Hanmer Springs Thermal Reserve to<br />
each Ward or Rating area that may be used for meeting<br />
development costs on amenity reserves.<br />
Cemeteries<br />
Operational Costs:<br />
• Interment costs and purchase of plots are charged as<br />
user charges. Any shortfall in operational costs will<br />
be charged as a <strong>District</strong> Rate and/or Hanmer Springs<br />
Thermal Reserves surpluses<br />
Capital Costs:<br />
• If the <strong>Council</strong> decides to apply some of the surplus<br />
from the Hanmer Springs Thermal Reserve, the amount<br />
oft he contribution is subtracted fromt he <strong>District</strong> Rate,<br />
otherwise the total is met via the <strong>District</strong> Rate.<br />
<strong>Council</strong> Owned Assets<br />
Parks & Reserves<br />
• 160 parks and reserves<br />
Cemeteries<br />
• 9 open cemetery reserves at Balcairn, Cheviot<br />
(Homeview), Culverden, Glenmark, Hanmer Springs,<br />
Horsley Down, Rotherham, Waiau, and Waikari.<br />
• Jed Cemetery Reserve in Gore Bay.<br />
Maintenances and Operating Implications<br />
Parks & Reserves<br />
We act as an administering body for a large number of parks<br />
and reserves in the <strong>District</strong>. The parks and reserves are either<br />
owned by <strong>Council</strong> or vested in <strong>Council</strong> to administer and<br />
maintain. Those that are vested are owned by the Crown. We<br />
have given our Reserve Committees delegations to run the day<br />
to day maintenance and development of most of the reserves.<br />
Lawn mowing and heavy maintenance is largely undertaken by<br />
contractors in the main, but we do employ some gardeners.<br />
Cemeteries<br />
General maintenance and upkeep such as grass mowing,<br />
weed spraying, rubbish removal, fencing, grave topping, digging<br />
and landscaping, is undertaken by contractors. Generally, all<br />
cemeteries within the district are well maintained.<br />
Resident satisfaction surveys have confirmed consistent high<br />
levels of satisfaction with our cemeteries.<br />
Assumptions and Risks<br />
Parks & Reserves<br />
It is assumed that the district’s communities will continue to<br />
support the preservation of the district’s reserves and parks<br />
through the Reserve Committees currently in place. It is also<br />
assumed that the historic buildings on the Queen Mary Hospital<br />
Historic Reserve will be leased to external parties for commercial<br />
use. If this does not occur, we will continue to keep the buildings<br />
in good condition but we do not plan to do any upgrades or<br />
developments funded by the ratepayer.<br />
109
www.hurunui.govt.nz<br />
Cemeteries<br />
The biggest risk to our reserves is natural weather and<br />
environmental conditions. In our recent past, the floods of 2008<br />
caused severe damage in some of the reserves and dramatically<br />
altered the landscape of some of them. We have not included<br />
additional funding in this long term plan to restore reserves in<br />
the event they are severely damaged in future.<br />
<strong>Plan</strong>s for our cemeteries are based on the assumption that our<br />
nine cemeteries will continue to meet the needs of our aging (and<br />
at times, growing) population for many years to come. There is<br />
always a risk that a natural disaster could severely damage any<br />
of the cemeteries, such as an earthquake or flooding. This has<br />
not been the case to date, but if it did, alternative sites (or site)<br />
may need to be identified.<br />
Goals and Performance Measures<br />
<strong>Community</strong> Outcomes<br />
• A desirable and safe place to live<br />
• A place where our traditional rural values and heritage make <strong>Hurunui</strong> unique<br />
Goals<br />
To provide parks and reserves<br />
for people to enjoy<br />
Our cemeteries meet the<br />
needs of our communities<br />
How we will achieve our<br />
Goals<br />
Involve local communities<br />
in the planning and<br />
development of their<br />
reserves<br />
Manage the Queen Mary<br />
Historic Hospital Reserve in<br />
a manner consistent with its<br />
Management <strong>Plan</strong><br />
Undertake a residents<br />
satisfaction survey<br />
Performance Measures Current Situation 11/12 12/13 13/14 14/15 15+<br />
Reserve and / or Ward<br />
Committees spend their<br />
annual budgets on projects<br />
identified for that year<br />
Lease the historic buildings<br />
on the Reserve accordance<br />
with the <strong>Plan</strong> or keep it<br />
in good condition, if no<br />
suitable proposals are<br />
found<br />
No less than 90% of<br />
residents who have visited<br />
a cemetery are satisfied<br />
The allocated funding<br />
has not yet been spent,<br />
but committees have the<br />
delegation to spend on<br />
identified reserve projects<br />
The buildings are currently<br />
mothballed<br />
93% of those who had<br />
visited a <strong>District</strong> cemetery<br />
were satisfied with the<br />
standard<br />
√ √ √ √<br />
√<br />
√<br />
√<br />
Financial Summary<br />
A financial summary for this activity is shown on the next page.<br />
<strong>Community</strong> volunteers working at the Rutherford Reserve Playground<br />
110
<strong>Hurunui</strong> <strong>Community</strong> <strong>Long</strong> <strong>Term</strong> <strong>Plan</strong> <strong>2012</strong> - <strong>2022</strong><br />
Reserves - Activity Financial Summary<br />
Annual <strong>Plan</strong> Year 1 Year 2 Year 3 Year 4 Year 5 Year 6 Year 7 Year 8 Year 9 Year 10<br />
2011/<strong>2012</strong> <strong>2012</strong>/2013 2013/2014 2014/2015 2015/2016 2016/2017 2017/2018 2018/2019 2019/2020 2020/2021 2021/<strong>2022</strong><br />
Operating Statement<br />
Operating Revenue<br />
Targeted Rates 0 249,929 252,106 261,932 260,397 268,997 277,251 284,507 293,537 304,087 313,407<br />
Other Income 177,002 183,520 192,403 199,929 206,168 212,449 218,052 223,776 230,371 237,609 244,882<br />
Internal Interest Received 94,727 34,968 35,025 39,522 44,162 45,789 49,815 50,142 53,059 52,252 55,255<br />
Development Contributions 183,851 139,917 145,389 149,825 155,127 159,596 165,450 170,345 168,138 176,543 161,402<br />
Total Operating Revenue 455,580 608,334 624,923 651,208 665,853 686,832 710,568 728,770 745,105 770,491 774,946<br />
Operating Expenditure<br />
Employee Benefits 149,800 173,816 179,256 184,714 190,572 196,847 202,443 208,162 214,750 221,980 229,246<br />
Direct Operating Expenditure 718,671 856,405 853,710 844,947 860,465 917,195 947,768 966,565 992,754 1,027,666 1,054,996<br />
Internal Interest Paid 872 743 2,523 2,335 2,121 34,349 34,010 34,437 33,351 55,675 56,383<br />
<strong>Council</strong> Overheads Expenditure 359,406 380,926 389,597 401,478 407,153 416,557 425,070 433,739 447,250 454,232 464,945<br />
Depreciation 62,801 65,839 65,839 66,828 66,828 66,828 67,166 67,166 67,166 68,241 68,241<br />
Total Operating Expenditure 1,291,550 1,477,730 1,490,926 1,500,303 1,527,140 1,631,776 1,676,458 1,710,069 1,755,270 1,827,794 1,873,811<br />
Operating Surplus (Deficit) (835,970) (869,395) (866,003) (849,095) (861,286) (944,944) (965,890) (981,299) (1,010,165) (1,057,304) (1,098,865)<br />
Capital Statement<br />
Capital Expenditure<br />
<strong>District</strong> Reserves 71,646 71,646 74,455 116,933 1,230,277 82,443 85,581 89,049 92,846 97,087 101,551<br />
Cemeteries 5,265 5,000 129,900 5,369 5,554 5,754 5,973 6,215 6,480 6,776 7,087<br />
Amberley Reserves 18,172 20,000 83,136 10,738 11,107 11,507 23,890 37,287 277,711 13,551 14,174<br />
Amuri Reserves 8,424 8,500 8,833 9,127 9,441 15,534 10,153 10,565 11,015 11,518 19,135<br />
Hanmer Springs Reserves 12,324 110,000 10,392 10,738 1,088,486 11,507 131,395 12,429 12,959 13,551 14,174<br />
Total Capital Expenditure 115,831 260,146 306,716 152,906 2,344,865 126,745 256,992 155,544 401,011 142,483 156,121<br />
Funds Required<br />
Operating Deficit 835,970 869,395 866,003 849,095 861,286 944,944 965,890 981,299 1,010,165 1,057,304 1,098,865<br />
Capital Expenditure 115,831 260,146 306,716 152,906 2,344,865 126,745 256,992 155,544 401,011 142,483 156,121<br />
Transfer to General <strong>Council</strong> Reserves 0 27 27 28 28 28 29 29 29 30 30<br />
Transfer to Special Funds 271,774 152,423 182,749 186,742 196,810 178,366 180,727 191,014 195,237 178,221 165,056<br />
Repayment of Internal Loans from Operating Income 0 34,844 38,139 1,015 4,257 44,318 48,128 51,541 293,877 33,079 38,134<br />
1,223,575 1,316,835 1,393,634 1,189,785 3,407,246 1,294,401 1,451,766 1,379,427 1,900,319 1,411,116 1,458,206<br />
Funded by<br />
Transfer from Hanmer Springs Thermal Reserve 797,386 961,569 984,438 972,980 992,462 1,057,462 1,083,103 1,105,737 1,138,585 1,167,392 1,195,536<br />
Non Cash Expenditure - Depreciation 62,801 65,839 65,839 66,828 66,828 66,828 67,166 67,166 67,166 68,241 68,241<br />
Transfer from General <strong>Council</strong> Reserves 7,154 5,000 129,900 5,369 5,554 5,754 5,973 6,215 6,480 6,776 7,087<br />
Transfer from Special Funds 71,646 140,646 83,807 86,598 1,738,963 92,799 203,837 100,235 342,786 109,283 114,308<br />
Capital Expenditure funded through Internal Loans 284,588 143,781 129,649 58,011 603,439 71,558 91,688 100,074 345,303 59,424 73,035<br />
1,223,575 1,316,835 1,393,634 1,189,785 3,407,246 1,294,401 1,451,766 1,379,427 1,900,319 1,411,116 1,458,206<br />
H:\<strong>Long</strong> <strong>Term</strong> <strong>Plan</strong> Workings\<strong>Hurunui</strong> <strong>District</strong> <strong>Council</strong> LTP Budgets <strong>2012</strong>-<strong>2022</strong> - Post Submissions.xls 31/05/<strong>2012</strong> 9:34 a.m.<br />
111
www.hurunui.govt.nz<br />
Environment and Safety<br />
Overview<br />
Environment and Safety covers the following 4 activity areas<br />
described below:<br />
Activity 1:<br />
Emergency Services (civil defence and rural fire)<br />
Activity 2: Resource Management (administering the <strong>District</strong><br />
<strong>Plan</strong>, resource consents, township planning, policy and bylaw<br />
development)<br />
Activity 3: Compliance and Regulatory Functions (building<br />
controls, public health and liquor licencing, and animal control)<br />
Activity 4: Waste Minimisation (refuse, recycling, transfer<br />
stations, and litter bin collection)<br />
Our Aim<br />
To protect people, animals, and the environment from natural<br />
disaster, disease and hazards.<br />
Why is the <strong>Council</strong> Involved?<br />
The <strong>Council</strong> is involved with the activities within the Environment<br />
and Safety group to provide for the wellbeing of its people. All<br />
of the activities within this group are to do with ensuring our<br />
communities, including our environment, are protected from<br />
certain harm to preserve what we have and leave it in good<br />
condition for future generations. We want to help make our<br />
<strong>District</strong> a desirable place through managing adverse effects of<br />
activities and conditions through our policies, bylaws and plans.<br />
These activities also contribute to the long term achievement of<br />
our community outcomes.<br />
<strong>Community</strong> Outcomes<br />
The <strong>Community</strong> Services and Facilities described in this section,<br />
primarily contribute to two of our community outcomes:<br />
1. A desirable and safe place to live:<br />
• We have attractive well designed townships<br />
• Communities have access to adequate health and<br />
emergency services and systems and resources<br />
are available to meet civil defence emergencies<br />
• Risks to public health are identified and<br />
appropriately managed<br />
2. A place that demonstrates environmental responsibility:<br />
• We protect our environment while preserving<br />
people’s property rights<br />
• We minimise solid waste to the fullest extent,<br />
and manage the rest in a sustainable way<br />
Major Projects <strong>Plan</strong>ned<br />
Project<br />
New generator for the<br />
Amberley Office used as<br />
an emergency operation<br />
centre in a civil defence<br />
emergency<br />
Tsunami remote trigger to<br />
activate warning systems in<br />
place in beach settlements<br />
Tanker compliance survey $99,000<br />
Year <strong>Plan</strong>ned<br />
<strong>2012</strong>/13 2013/14 2014/15 2015+<br />
$50,000<br />
$25,980<br />
Purchase and install digital $30,000 $32,214 $33,321<br />
radios to replace defunct<br />
analogue radio system<br />
Tanker replacements $15,000 $99,963<br />
Waiau fire depot $93,528<br />
Waiau smoke chaser $40,000<br />
Engineer assessments on<br />
earthquake prone buildings<br />
Significant Negative Effects<br />
$23,000 $23,720 $24,442<br />
The main intention of this group of activities is to mitigate<br />
negative effects on the <strong>District</strong> and its environment. In the<br />
main, our actual activities do not cause any significant negative<br />
effects. The negative effects that this group of activities is aimed<br />
at negating or minimising includes:<br />
• Unclean and dangerous food handling can have<br />
significant detrimental effects on the public through<br />
sickness, therefore it is important we follow up<br />
complaints involving food premises promptly to prevent<br />
further spread of the disease. Similarly with water, as<br />
infection and illness can spread quickly via drinking<br />
water in particular.<br />
• We have a key role to reduce negative effects caused<br />
through sickness and alcohol abuse through the<br />
regulation of alcohol outlets (such as restaurants and<br />
retailers) and limiting the number of hours alcohol is<br />
for sale.<br />
• Unruly dogs and animals pose dangerous risks to people<br />
and stock. There have been several cases of extreme dog<br />
attacks in recent years within New Zealand which has<br />
112
<strong>Hurunui</strong> <strong>Community</strong> <strong>Long</strong> <strong>Term</strong> <strong>Plan</strong> <strong>2012</strong> - <strong>2022</strong><br />
raised people’s awareness of the potentially dangerous<br />
nature of dogs in particular and as a result, there is less<br />
tolerance to roaming animals or dog attacks. This has<br />
caused a demand for a higher level of service from us<br />
to respond quickly to complaints and to take measures<br />
to ensure compliance.<br />
• Standards in the <strong>District</strong> <strong>Plan</strong> and legislative acts, such<br />
as the Resource Management Act attempt to minimise<br />
potential negative impacts on the environment.<br />
• Unruly fires have obvious negative impacts and can lead<br />
to loss of life and property. Fire controls and having<br />
trained fire teams in the <strong>District</strong> are essential.<br />
• Waste and recycling activities have the potential<br />
to cause significant negative effects to people and<br />
the environment and we are serious about our<br />
duty to reduce and minimise those possible effects.<br />
Contractors carrying rubbish and recycling are required<br />
to have vehicles which meet stringent conditions to<br />
avoid contamination. Landfills (operational and nonoperational)<br />
are monitored to ensure any leachates are<br />
within acceptable levels. Health and safety standards<br />
are essential and a requirement of contracts pertaining<br />
to the collection of recycling and rubbish, and the<br />
management of the transfer stations.<br />
Emergency Management<br />
In an emergency, particularly a civil defence emergency, we will<br />
continue to deliver services as long as it is safe and practical<br />
to continue to do so. Many of the activities within this group<br />
will be required in an emergency, depending on the problem.<br />
Public health concerns are often of paramount importance in<br />
certain disasters particularly when there issues with water and<br />
sewerage disposal. In a civil defence situation, we will activate<br />
our emergency operation centre and manage the response<br />
and recovery with other agencies required (such as police, fire<br />
and ambulance). Following an earthquake, building services are<br />
necessary to check the safety of buildings. The fire service is an<br />
essential service in most situations, as well as in the case of a<br />
fire emergency.<br />
Financial Summary<br />
A financial summary for this group of activities is shown on the<br />
next page.<br />
113
www.hurunui.govt.nz<br />
Environment and Safety - Group Activity Financial Summary<br />
Annual <strong>Plan</strong> Year 1 Year 2 Year 3 Year 4 Year 5 Year 6 Year 7 Year 8 Year 9 Year 10<br />
2011/<strong>2012</strong> <strong>2012</strong>/2013 2013/2014 2014/2015 2015/2016 2016/2017 2017/2018 2018/2019 2019/2020 2020/2021 2021/<strong>2022</strong><br />
Operating Statement<br />
Operating Revenue<br />
<strong>District</strong> Wide Rates 1,920,698 2,144,156 2,247,608 2,325,111 2,352,458 2,444,188 2,516,215 2,588,731 2,679,636 2,766,418 2,859,066<br />
Targeted Rates 1,088,424 1,045,916 1,063,984 1,099,887 1,136,308 1,175,819 1,212,908 1,251,021 1,294,370 1,339,184 1,385,649<br />
Other Income 1,274,743 1,290,300 1,330,686 1,371,202 1,414,685 1,461,265 1,502,812 1,545,263 1,594,166 1,647,842 1,701,777<br />
Internal Interest Received 2,490 0 0 0 0 0 0 0 0 0 0<br />
Total Operating Revenue 4,286,355 4,480,372 4,642,278 4,796,200 4,903,451 5,081,272 5,231,935 5,385,015 5,568,172 5,753,444 5,946,492<br />
Operating Expenditure<br />
Employee Benefits 1,217,398 1,294,409 1,334,924 1,375,568 1,419,190 1,465,918 1,507,598 1,550,184 1,599,242 1,653,090 1,707,196<br />
Direct Operating Expenditure 2,303,507 2,378,330 2,465,147 2,558,270 2,573,064 2,682,700 2,733,353 2,836,911 2,899,508 3,025,233 3,095,234<br />
Internal Interest Paid 11,476 8,089 8,221 9,591 10,577 11,374 12,039 12,459 12,584 12,520 12,172<br />
<strong>Council</strong> Overheads Expenditure 694,939 717,137 742,428 776,148 796,465 826,621 853,715 881,038 921,757 948,389 983,590<br />
Depreciation 107,506 107,238 111,108 113,914 115,060 116,287 118,205 119,323 120,612 123,458 124,880<br />
Total Operating Expenditure 4,334,826 4,505,202 4,661,829 4,833,491 4,914,357 5,102,900 5,224,910 5,399,915 5,553,704 5,762,690 5,923,072<br />
Operating Surplus (Deficit) (48,471) (24,831) (19,551) (37,292) (10,906) (21,628) 7,025 (14,900) 14,468 (9,246) 23,420<br />
Capital Statement<br />
Capital Expenditure<br />
Emergency Services 107,406 234,000 119,508 59,059 133,284 103,563 137,368 0 0 33,878 0<br />
Resource Management & <strong>Plan</strong>ning 25,695 0 25,980 26,845 0 28,768 29,863 0 32,398 33,878 0<br />
Compliance & Regulatory Functions 0 0 51,960 26,845 0 57,535 29,863 0 64,795 33,878 0<br />
Waste Management 0 0 0 0 0 0 0 0 0 0 0<br />
Total Capital Expenditure 133,101 234,000 197,448 112,749 133,284 189,866 197,093 0 97,193 101,633 0<br />
Funds Required<br />
Operating Deficit 48,471 24,831 19,551 37,292 10,906 21,628 0 14,900 0 9,246 0<br />
Capital Expenditure 133,101 234,000 197,448 112,749 133,284 189,866 197,093 0 97,193 101,633 0<br />
Transfer to General <strong>Council</strong> Reserves 107,506 107,238 111,108 113,914 115,060 116,287 118,205 119,323 120,612 123,458 124,880<br />
Transfer to Special Funds 0 22,000 22,689 23,379 24,121 24,915 25,623 26,347 27,181 28,096 29,016<br />
Repayment of Internal Loans from Operating Income 6,554 15,372 0 0 0 0 (5,787) (1,726) 877 4,802 8,912<br />
295,632 403,441 350,796 287,334 283,370 352,696 335,134 158,844 245,863 267,235 162,807<br />
Funded by<br />
Operating Surplus 0 0 0 0 0 0 7,025 0 14,468 0 23,420<br />
Non Cash Expenditure - Depreciation 107,506 107,238 111,108 113,914 115,060 116,287 118,205 119,323 120,612 123,458 124,880<br />
General <strong>Council</strong> Reserves 149,949 234,000 197,448 112,749 133,284 189,866 197,093 0 97,193 101,633 0<br />
Transfer from Special Funds 35,435 45,000 23,344 47,069 24,036 37,373 12,812 39,521 13,591 42,144 14,508<br />
Capital Expenditure funded through Internal Loans 0 17,203 18,895 13,602 10,990 9,171 0 0 0 0 0<br />
292,890 403,441 350,796 287,334 283,370 352,696 335,134 158,844 245,863 267,235 162,807<br />
H:\<strong>Long</strong> <strong>Term</strong> <strong>Plan</strong> Workings\<strong>Hurunui</strong> <strong>District</strong> <strong>Council</strong> LTP Budgets <strong>2012</strong>-<strong>2022</strong> - Post Submissions.xls 31/05/<strong>2012</strong> 9:34 a.m.<br />
114
Activity 1: Emergency Services<br />
<strong>Hurunui</strong> <strong>Community</strong> <strong>Long</strong> <strong>Term</strong> <strong>Plan</strong> <strong>2012</strong> - <strong>2022</strong><br />
Overview<br />
The Emergency Services activity includes the <strong>Council</strong>’s:<br />
• Civil Defence<br />
• Rural Fire<br />
Current Situation<br />
Civil Defence<br />
In the <strong>Hurunui</strong> <strong>District</strong>, there are now nine Sector Posts<br />
(Cheviot, Culverden, Hawarden, Waiau, Mt Lyford, Hanmer<br />
Springs, Motunau Beach, Glenmark and Amberley), and a <strong>District</strong><br />
Headquarters at Amberley Office. Over 70 local volunteers from<br />
diverse backgrounds are involved in these centres. Volunteers<br />
are generally local people who receive training so they know<br />
what to do should a disaster or emergency situation arise.<br />
To strengthen our ability to manage in a disaster, key<br />
relationships have been established with our neighbouring<br />
<strong>District</strong> <strong>Council</strong>s (Waimakariri and Kaikoura), and those within<br />
the greater Canterbury Region, as well as the Ministry of Civil<br />
Defence Emergency Management (MCDEM), critical emergency<br />
service partners and support agencies from both Government<br />
and non-Government organisations (such as Red Cross, St<br />
Johns Ambulance, Ministry of Social Development, Canterbury<br />
<strong>District</strong> Health Board).<br />
The <strong>Hurunui</strong> <strong>District</strong> has 106 kilometres of coastline. With<br />
heightened public awareness about the risk of tsunamis<br />
worldwide, a locally activated warning system is in place<br />
at Amberley Beach and Leithfield Beach. No other beach<br />
Rural Fire<br />
We maintain a <strong>District</strong> Fire <strong>Plan</strong> which prescribes how we will<br />
meet our fire management responsibilities. Our Emergency<br />
Management Officer is appointed as the Principal Rural Fire<br />
Officer who manages rural fire on behalf of the <strong>Council</strong>. We<br />
have five Volunteer Rural Fire Force parties in the <strong>District</strong><br />
based in Waikari, Waiau, Conway Flat, Motunau Beach and Greta<br />
Valley. Collectively these fire parties provide approximately<br />
80 volunteers including 10 Rural Fire Officers and a Deputy<br />
Principal Rural Fire Officer. Each rural fire party has a minimum<br />
of one fire tanker and a portable pump. We provide tankers<br />
to the New Zealand Fire Service brigades located in Amberley,<br />
Waipara, Hanmer Springs and Cheviot. We are responsible for<br />
providing the public with information and warnings regarding fire<br />
hazard conditions. This includes placing fire bans during periods<br />
of extreme fire risk, and bylaws to carry out fire prevention and<br />
control measures.<br />
<strong>Plan</strong>s for the future<br />
Civil Defence<br />
Severe flooding in 2008 caused widespread damage within<br />
the <strong>Hurunui</strong> <strong>District</strong> and tested our civil defence capabilities.<br />
This confirmed that further Sector Posts and more volunteers<br />
within the <strong>District</strong> would be beneficial. We intend to continue<br />
increasing our capacity to deal more effectively with a civil<br />
defence emergency when the time arrives. Subject to voluntary<br />
community participation, we will seek to establish additional<br />
Sector Posts in Leithfield, Waipara, Motunau Beach, Scargill-<br />
Omihi area, Gore Bay, Conway Flat, Rotherham, and Waikari.<br />
Funding has been available to fully automate the warning systems<br />
at Amberley Beach and Leithfield Beach so that they do not<br />
need to be manually activated.<br />
We will continue to maintain an organisational structure of<br />
suitably trained and competent people, including volunteers,<br />
to manage civil defence emergencies. Recruitment drives for<br />
civil defence volunteers are essential to maintain the numbers<br />
of personnel needed in a civil defence emergency. Training is<br />
delivered locally by our Emergency Management Officer and<br />
regionally through the Canterbury CDEM Group for staff and<br />
community volunteers.<br />
Rural Fire<br />
General upgrading of all rural fire equipment and depots will<br />
continue to ensure that all Volunteer Rural Fire Force parties<br />
have the physical resources needed to fight fires. Investment in<br />
regional fire retardant depots will enhance our fire response<br />
capability. Investment in national research projects will educate<br />
people in the <strong>District</strong> on passive measures to help reduce the<br />
incidence of wild fires.<br />
Volunteers are crucial to this activity and recruitment drives<br />
must be on-going to sustain required numbers for each<br />
Volunteer Rural Fire Force established in our district. Numbers<br />
of volunteers have been dwindling over the past years which is<br />
of real concern. Full training is provided to volunteers to ensure<br />
they are able to carry out their duties safely.<br />
We will continue to promote, encourage and carry out<br />
appropriate fire prevention and control measures in the<br />
interests of public safety. This includes maintaining a written<br />
Fire <strong>Plan</strong>, observing and assessing fire weather conditions and<br />
other fire hazard conditions, and removing or reducing hazards<br />
which may trigger unwanted vegetation wild fires.<br />
Also being considered is a wider fire fighting agency to cover<br />
the Canterbury region. This is in its early considerations with<br />
115
www.hurunui.govt.nz<br />
the intended outcome to enhance the region’s ability to share<br />
resources and work together rather than each district have<br />
its own fire teams. We will do our bit to ensure that careful<br />
consideration is given to how this will work in the field and<br />
whether we will be better off under this system. We will also<br />
be concerned that the proposed model can be operated at an<br />
affordable price.<br />
Funding<br />
Civil Defence<br />
Operational Costs:<br />
• 100% <strong>District</strong> Rate after taking into account the small<br />
central government contribution via an annual grant<br />
Capital Costs:<br />
• Funded over the life of the asset and met through the<br />
<strong>District</strong> Rate<br />
Rural Fire<br />
Operational Costs:<br />
• Fighting fires – the property owner pays. In some<br />
instances there may be a portion of the fire fighting<br />
costs that may not be able to be recovered. Such costs<br />
will need to be recovered in line with ‘other costs’.<br />
• Other costs – after taking government grants into<br />
account, 80% from ratepayers in the Rural Fire<br />
Authority area and 20% from ratepayers outside the<br />
Rural Fire Authority area. Both will be collected by way<br />
of a Targeted Rate known as the Rural Fire Rate.<br />
Capital Costs:<br />
• Funded over the life of the asset and met through the<br />
targeted rate.<br />
<strong>Council</strong> Assets<br />
Civil Defence<br />
• Not applicable<br />
Rural Fire<br />
• Fire equipment and depots throughout the <strong>District</strong><br />
Maintenance and Operating Implications<br />
Civil Defence<br />
We will continue to manage and operate our civil defence<br />
emergency management functions from our Emergency<br />
Operations Centre at Amberley Office.<br />
Rural Fire<br />
We intend to continue to manage and operate our fire response<br />
functions as currently in place while a possible Canterbury wide<br />
fire fighting agency is considered.<br />
Assumptions and Risks<br />
Civil Defence<br />
<strong>Plan</strong>ning and preparing for an emergency situation that may not<br />
happen requires making assumptions. Civil Defence Emergency<br />
Management planning is based on the assumption that a serious<br />
disaster will occur, such as an earthquake. The <strong>Hurunui</strong> <strong>District</strong><br />
contains several fault lines that are said to be overdue to move. A<br />
significant part of the <strong>Hurunui</strong> <strong>District</strong> is coastal, and therefore<br />
at risk from tsunamis. Other major risks include flooding, wild<br />
fires and the impacts of adverse weather conditions. Good<br />
planning and preparation is crucial, therefore we have taken our<br />
role in civil defence emergency management very seriously.<br />
Rural Fire<br />
Our <strong>District</strong> is prone to extreme drought conditions during<br />
the summer months and it is then that callouts for fire services<br />
are particularly high. It is assumed that this trend will continue<br />
and that our fire services will continue to be frequently called<br />
out. Of significant risk to our rural community is the constant<br />
need to recruit, train and retain volunteers to be available when<br />
there are fires. A major risk is the issue of health and safety.<br />
Obviously, fighting fires is a dangerous activity and it is essential<br />
that volunteers are fully trained to prevent injury or loss of life<br />
to themselves and others. Fire plans and appropriate resources<br />
are critical to mitigate these risks.<br />
Shared Services<br />
Rural Fire<br />
<strong>District</strong>s usually build up their fire fighting resources to meet<br />
normal demands, but from time to time, local resources are<br />
inadequate. There is a general commitment to assist others<br />
when fighting larger fires. We bring in fire crews from outside<br />
the <strong>District</strong> to fight large fires when necessary or use private<br />
sector resources.<br />
116
<strong>Hurunui</strong> <strong>Community</strong> <strong>Long</strong> <strong>Term</strong> <strong>Plan</strong> <strong>2012</strong> - <strong>2022</strong><br />
<strong>Community</strong> Outcomes<br />
Goals and Performance Measures<br />
1. A desirable and safe place to live<br />
2. A place that demonstrates environmental responsibility<br />
Goals<br />
To be prepared for<br />
emergency situations which<br />
have adverse implications for<br />
the <strong>District</strong><br />
How we will achieve our<br />
Goals<br />
Ensure there are sufficient<br />
resources<br />
Performance Measures Current Situation 11/12 12/13 13/14 14/15 15+<br />
Educate the public on how<br />
to prepare themselves for<br />
an emergency<br />
Staff and volunteers are<br />
trained to deal with an<br />
emergency<br />
A new emergency planning<br />
guide was delivered to every<br />
house in the <strong>District</strong><br />
Staff training was delayed<br />
due to the earthquakes<br />
in Canterbury, but many<br />
received on the job practice.<br />
Fire crews received training<br />
every month.<br />
√ √ √ √<br />
√ √ √ √<br />
Financial Summary<br />
A financial summary for this activity is shown on the next page.<br />
117
www.hurunui.govt.nz<br />
Emergency Services - Activity Financial Summary<br />
Annual <strong>Plan</strong> Year 1 Year 2 Year 3 Year 4 Year 5 Year 6 Year 7 Year 8 Year 9 Year 10<br />
2011/<strong>2012</strong> <strong>2012</strong>/2013 2013/2014 2014/2015 2015/2016 2016/2017 2017/2018 2018/2019 2019/2020 2020/2021 2021/<strong>2022</strong><br />
Operating Statement<br />
Operating Revenue<br />
General Rates 159,516 156,046 160,658 166,125 170,351 175,760 180,583 185,498 192,131 197,468 203,757<br />
Targeted Rates 263,546 274,088 285,051 296,453 308,312 320,644 333,470 346,809 360,681 375,108 390,112<br />
Other Income 2,422 0 0 0 0 0 0 0 0 0 0<br />
Total Operating Revenue 425,484 430,134 445,710 462,578 478,662 496,404 514,053 532,307 552,812 572,576 593,870<br />
Operating Expenditure<br />
Employee Benefits 168,769 105,720 109,029 112,349 115,911 119,728 123,132 126,610 130,617 135,015 139,434<br />
Direct Operating Expenditure 182,347 177,900 183,468 183,741 189,568 195,809 201,377 207,065 213,618 220,811 228,038<br />
Internal Interest Paid 837 6,974 8,221 9,591 10,577 11,374 12,039 12,459 12,584 12,520 12,172<br />
<strong>Council</strong> Overheads Expenditure 97,166 99,764 103,038 107,999 109,951 113,790 117,235 120,724 126,651 129,251 133,715<br />
Depreciation 51,178 56,978 60,848 62,500 63,646 64,873 66,057 67,175 68,464 70,177 71,599<br />
Total Operating Expenditure 500,297 447,336 464,605 476,180 489,653 505,575 519,839 534,033 551,934 567,774 584,958<br />
Operating Surplus (Deficit) (74,813) (17,203) (18,895) (13,602) (10,990) (9,171) (5,787) (1,726) 877 4,802 8,912<br />
Capital Statement<br />
Capital Expenditure<br />
Emergency Services 107,406 234,000 119,508 59,059 133,284 103,563 137,368 0 0 33,878 0<br />
Total Capital Expenditure 107,406 234,000 119,508 59,059 133,284 103,563 137,368 0 0 33,878 0<br />
Funds Required<br />
Operating Deficit 74,813 17,203 18,895 13,602 10,990 9,171 5,787 1,726 0 0 0<br />
Capital Expenditure 107,406 234,000 119,508 59,059 133,284 103,563 137,368 0 0 33,878 0<br />
Transfer to General <strong>Council</strong> Reserves 51,178 56,978 60,848 62,500 63,646 64,873 66,057 67,175 68,464 70,177 71,599<br />
Repayment of Internal Loans from Operating Income 578 0 0 0 0 0 (5,787) (1,726) 877 4,802 8,912<br />
233,975 308,181 199,251 135,161 207,920 177,607 203,424 67,175 69,341 108,857 80,510<br />
Funded by<br />
Operating Surplus 0 0 0 0 0 0 0 0 877 4,802 8,912<br />
Non Cash Expenditure - Depreciation 51,178 56,978 60,848 62,500 63,646 64,873 66,057 67,175 68,464 70,177 71,599<br />
General <strong>Council</strong> Reserves 107,406 234,000 119,508 59,059 133,284 103,563 137,368 0 0 33,878 0<br />
Capital Expenditure funded through Internal Loans 0 17,203 18,895 13,602 10,990 9,171 0 0 0 0 0<br />
158,584 308,181 199,251 135,161 207,920 177,607 203,424 67,175 69,341 108,857 80,510<br />
H:\<strong>Long</strong> <strong>Term</strong> <strong>Plan</strong> Workings\<strong>Hurunui</strong> <strong>District</strong> <strong>Council</strong> LTP Budgets <strong>2012</strong>-<strong>2022</strong> - Post Submissions.xls 31/05/<strong>2012</strong> 9:34 a.m.<br />
118
<strong>Hurunui</strong> <strong>Community</strong> <strong>Long</strong> <strong>Term</strong> <strong>Plan</strong> <strong>2012</strong> - <strong>2022</strong><br />
Activity 2: Resource Management<br />
Overview<br />
<strong>Plan</strong>s for the future<br />
The Resource Management activity includes the various<br />
functions of Resource Management, such as administering the<br />
<strong>District</strong> <strong>Plan</strong>, resource consents, township planning, policy and<br />
bylaw development.<br />
Current Situation<br />
Resource Management<br />
Our <strong>District</strong> <strong>Plan</strong> has been in place since 2003. This plan<br />
identifies key resource management issues for the <strong>District</strong> and<br />
our objectives, policies and methods for addressing each of those<br />
issues. The <strong>District</strong> <strong>Plan</strong> is a legal document which affects the dayto-day<br />
lives of everybody in the <strong>Hurunui</strong> <strong>District</strong>. The <strong>Plan</strong> is a<br />
requirement of the Resource Management Act 1991 (RMA). The<br />
purpose of the RMA is the sustainable management of natural<br />
and physical resources while avoiding, remedying or mitigating<br />
adverse environmental effects and providing for the wellbeing of<br />
communities. The <strong>Plan</strong>’s framework provides objectives, policies<br />
and methods to manage the use and development of natural and<br />
physical resources to meet the purpose of the RMA. The current<br />
<strong>District</strong> <strong>Plan</strong> has not been frozen in time since 2003. We have<br />
processed 31changes to parts of the <strong>Plan</strong> then, responding to<br />
particular issues such as frost control fans, quarrying and mining,<br />
urban and rural subdivision standards. We are also required to<br />
review the <strong>Plan</strong> every 10 years.<br />
To achieve the objectives and policies set out in the <strong>District</strong> <strong>Plan</strong>,<br />
we set rules and standards which any developments must meet.<br />
We process a number of resource consent applications from<br />
applicants who want to do things that do not comply with the<br />
land use provisions of the plan or who want to subdivide their<br />
property. Two thirds of resource consents processed relate to<br />
subdivision consents. We grant about 98% of resource consent<br />
applications without public notification within 20 working days<br />
of the application been received. The remaining 2% of consents<br />
require notification for a variety of reasons, including situations<br />
where potentially affected parties have not given their written<br />
consents or the proposal sits outside the standard requirements<br />
of the <strong>District</strong> <strong>Plan</strong>.<br />
We develop bylaws and policies as well as review policy initiatives<br />
set by other government agencies, and changes to legislation.<br />
We also respond to plans prepared by other agencies to protect<br />
the interests of the <strong>Hurunui</strong> community. We responded to a<br />
proposed Regional Policy Statement and the proposed <strong>Hurunui</strong><br />
and Waiau River Regional <strong>Plan</strong>. We also lodged a submission to<br />
the proposed Biodiversity National Policy Statement and the<br />
National Policy Statement for Electricity Transmission which<br />
required us to modify our <strong>District</strong> <strong>Plan</strong> within 2 years.<br />
We are constantly monitoring the state of the district<br />
environment. The <strong>District</strong> <strong>Plan</strong> will be fully reviewed over the<br />
next 2 years and we aim to have it fully revised by the end of<br />
2013. It will then be available for public scrutiny before it is<br />
finalised. The purpose of this review will be to consider the ongoing<br />
relevance of the resource management issues identified in<br />
the current <strong>District</strong> <strong>Plan</strong> and the measures and standards used<br />
to manage these.<br />
We have already identified that intensification of land use<br />
through the availability of reliable irrigation water will need to<br />
be considered. We need to consider a policy position in relation<br />
to new data on fault lines and earthquake risk, liquefaction risk<br />
zones and possible tsunami hazard areas. In addition a number<br />
of new national policy statements require amendments to the<br />
<strong>District</strong> <strong>Plan</strong>. For example, electricity transmission. The issues<br />
will be fully canvassed and consulted on with the community<br />
prior to any significant amendments to the current <strong>District</strong> <strong>Plan</strong>.<br />
In 2008 we developed a non-regulatory Biodiversity Strategy<br />
and received a Department of Conservation grant to employ<br />
a biodiversity field advisor for 3 years which was extended<br />
for a further 3 years in <strong>2012</strong>. We will continue over the next<br />
three years to partner with other agencies to achieve positive<br />
biodiversity gains for the <strong>District</strong>. For example funding from the<br />
<strong>Hurunui</strong> Waiau Zone committee is being spent on biodiversity<br />
projects in the <strong>District</strong>. The focus is on collaboration and<br />
voluntary protection.<br />
Funding<br />
Operational Costs:<br />
• Resource Consents are 100% user charges. We may<br />
waive consent fees if provided for in the councils fee<br />
waivers, refunds and remissions policy.<br />
• Private <strong>District</strong> <strong>Plan</strong> Change costs are all met by the<br />
applicant.<br />
• <strong>Council</strong> initiated plan changes are funded by the<br />
General Rate.<br />
• Extraordinary planning issues will be assessed on a case<br />
by case basis to determine the appropriate method for<br />
funding.<br />
• The balance of any costs will be met by a <strong>District</strong> Rate<br />
(known as the planning rate).<br />
119
www.hurunui.govt.nz<br />
<strong>Council</strong> Owned Assets<br />
• Not applicable.<br />
Maintenance and Operating Implications<br />
We manage the Resource Management/<strong>Plan</strong>ning activity from<br />
our Amberley based office. We have our own policy and planning<br />
staff, and from time to time, will engage consultants for specialty<br />
areas or when demand exceeds staffing resources.<br />
Assumptions and Risks<br />
The Resource Management Act and the <strong>District</strong> <strong>Plan</strong> are the<br />
main drivers of this activity. The second phase of the reform<br />
of the Resource Management Act may impact on the focus of<br />
the <strong>District</strong> <strong>Plan</strong>. The review of the Act includes the section<br />
that covers matters of national significance that councils have<br />
to provide for in their planning documents. For example,<br />
protecting outstanding natural features and landscapes from<br />
inappropriate subdivision, use and development. The reform<br />
also looks at the protection of the environment and matters<br />
such as the effects of climate change. These are areas that we<br />
have to consider when exercising our powers and functions<br />
under the Resource Management Act. Any changes to the levels<br />
of importance placed on these matters will have a flow on effect<br />
to the significance and importance in the <strong>District</strong> <strong>Plan</strong>.<br />
We will continue to act in an advocacy role on other agency<br />
plans and actions where these may impact on the future<br />
prosperity of the <strong>District</strong>.<br />
Shared Services<br />
The Department of Conservation and Lane Neave Solicitors<br />
have funded our Biodiversity programme for the past 2 years.<br />
This funding expired in April 2011 and it has been confirmed<br />
that funding for a further 2 years has been approved by the<br />
Department of Conservation. Our new Biodiversity Field<br />
Advisor is now working with land owners in the <strong>Hurunui</strong>.<br />
<strong>Community</strong> Outcomes<br />
1. A desirable and safe place to live<br />
Goals and Performance Measures<br />
2. A place that demonstrates environmental responsibility<br />
Goals<br />
How we will achieve our Performance Measures Current Situation 11/12 12/13 13/14 14/15 15+<br />
To manage our natural<br />
resources as safely as<br />
possible and ensure they are<br />
protected for the future<br />
Goals<br />
Have good rules, standards<br />
and processes in place<br />
Protect the unique<br />
biodiversity values of the<br />
<strong>District</strong><br />
The <strong>District</strong> <strong>Plan</strong> review is<br />
complete<br />
95% *of all resource<br />
consents will be processed<br />
within 20 working days<br />
Work with land owners<br />
and communities to<br />
encourage restoring<br />
indigenous plants and<br />
animals<br />
The 2003 <strong>District</strong> <strong>Plan</strong> is<br />
currently being reviewed<br />
98% of resource consents<br />
were processed within 20<br />
working days<br />
√<br />
√ √ √ √<br />
New measure √ √ √<br />
*We aim to process all resource consents within 20 working days but 100% is largely unachievable. Some resource consents contain<br />
complexities that cannot be resolved in 20 days. The nature of the work means that consents do not arrive spread evenly throughout the year<br />
and having a small number of staff skilled to process these means that we are limited in our capacity to deal with multiple consents at once.<br />
Therefore, a 95% target still presents challenges to reach.<br />
Financial Summary<br />
A financial summary for this activity is shown on the next page.<br />
120
<strong>Hurunui</strong> <strong>Community</strong> <strong>Long</strong> <strong>Term</strong> <strong>Plan</strong> <strong>2012</strong> - <strong>2022</strong><br />
Resource Management - Activity Financial Summary<br />
Annual <strong>Plan</strong> Year 1 Year 2 Year 3 Year 4 Year 5 Year 6 Year 7 Year 8 Year 9 Year 10<br />
2011/<strong>2012</strong> <strong>2012</strong>/2013 2013/2014 2014/2015 2015/2016 2016/2017 2017/2018 2018/2019 2019/2020 2020/2021 2021/<strong>2022</strong><br />
Operating Statement<br />
Operating Revenue<br />
General Rates 721,346 837,737 879,285 908,393 921,972 953,830 982,289 1,011,227 1,046,136 1,081,841 1,118,901<br />
Targeted Rates 0 29,627 30,554 31,485 32,483 33,553 34,507 35,481 36,604 37,837 39,075<br />
Other Income 379,045 408,000 420,770 433,582 447,331 462,060 475,198 488,621 504,084 521,057 538,111<br />
Total Operating Revenue 1,100,391 1,275,364 1,330,610 1,373,459 1,401,786 1,449,443 1,491,993 1,535,329 1,586,824 1,640,735 1,696,087<br />
Operating Expenditure<br />
Employee Benefits 493,430 679,798 701,076 722,421 745,331 769,871 791,761 814,126 839,890 868,170 896,586<br />
Direct Operating Expenditure 325,120 317,570 341,948 352,359 348,184 359,648 369,874 380,322 392,358 405,569 418,843<br />
<strong>Council</strong> Overheads Expenditure 255,941 266,496 276,086 287,178 296,772 308,423 318,858 329,381 343,076 355,496 369,159<br />
Depreciation 10,900 11,500 11,500 11,500 11,500 11,500 11,500 11,500 11,500 11,500 11,500<br />
Total Operating Expenditure 1,085,391 1,275,364 1,330,610 1,373,459 1,401,786 1,449,443 1,491,993 1,535,329 1,586,824 1,640,735 1,696,087<br />
Operating Surplus (Deficit) 15,000 0 0 0 0 0 0 0 0 0 0<br />
Capital Statement<br />
Capital Expenditure<br />
Resource Management 0 0 25,980 0 0 28,768 0 0 32,398 0 0<br />
Subdivision Inspection 25,695 0 0 26,845 0 0 29,863 0 0 33,878 0<br />
Total Capital Expenditure 25,695 0 25,980 26,845 0 28,768 29,863 0 32,398 33,878 0<br />
Funds Required<br />
Capital Expenditure 25,695 0 25,980 26,845 0 28,768 29,863 0 32,398 33,878 0<br />
Transfer to General <strong>Council</strong> Reserves 10,900 11,500 11,500 11,500 11,500 11,500 11,500 11,500 11,500 11,500 11,500<br />
36,595 11,500 37,480 38,345 11,500 40,268 41,363 11,500 43,898 45,378 11,500<br />
Funded by<br />
Operating Surplus 15,000 0 0 0 0 0 0 0 0 0 0<br />
Non Cash Expenditure - Depreciation 10,900 11,500 11,500 11,500 11,500 11,500 11,500 11,500 11,500 11,500 11,500<br />
General <strong>Council</strong> Reserves 25,695 0 25,980 26,845 0 28,768 29,863 0 32,398 33,878 0<br />
51,595 11,500 37,480 38,345 11,500 40,268 41,363 11,500 43,898 45,378 11,500<br />
H:\<strong>Long</strong> <strong>Term</strong> <strong>Plan</strong> Workings\<strong>Hurunui</strong> <strong>District</strong> <strong>Council</strong> LTP Budgets <strong>2012</strong>-<strong>2022</strong> - Post Submissions.xls 31/05/<strong>2012</strong> 9:34 a.m.<br />
121
www.hurunui.govt.nz<br />
Activity 3: Compliance and Regulatory Functions<br />
Overview<br />
The Compliance and Regulatory Functions activity includes the<br />
<strong>Council</strong>’s:<br />
• Building Controls<br />
• Public Health and Liquor Licencing<br />
• Animal Control<br />
Current Situation<br />
adopted in 2010. This new policy changed the way we address<br />
earthquake prone buildings and we now have an active approach<br />
to identifying and upgrading EPB’s. We have budgeted $23,000<br />
for each of the first three years of this plan ($69,000 in total)<br />
to have independent engineers’ assessments of approximately<br />
90 identified earthquake prone buildings. This does not cover<br />
the cost of actual building strengthening work. We consider this<br />
to be an important piece of work to prevent the tragedies that<br />
occurred after the 22 February 2011 earthquake following the<br />
collapse of buildings.<br />
We process and issue building consents, and inspect buildings<br />
at several stages of their development to ensure that buildings<br />
constructed are safe and comply with the New Zealand Building<br />
Code. We issue between 400 and 650 building consents annually<br />
for private buildings, public buildings, and businesses. In recent<br />
years, the number of building consent applications has remained<br />
consistent but at a low level with around 400 issued in 2010<br />
and 2011. We expect to see an increase in those numbers in<br />
coming years due to the effects of the Canterbury earthquakes<br />
since 2010.<br />
We also handle complaints made regarding building compliance<br />
issues and administer the on going safety features of commercial<br />
buildings though the building warrant of fitness regime.<br />
Since the earthquakes, we have carried out a number of<br />
earthquake assessments (available free to any <strong>Hurunui</strong> resident<br />
concerned about the safety of their building). A number of<br />
buildings have consequently been identified as dangerous and/<br />
or needing repairs. We contributed to the “operation suburb”<br />
conducted by the Department of Building and Housing shortly<br />
after the 22 February 2010 Christchurch Earthquake.<br />
Recruiting and retaining experienced building staff is an issue<br />
for us (and the rest of New Zealand) due to the extra-ordinary<br />
demand of building compliance staff in Christchurch and<br />
Canterbury in general, for the ongoing assessments and re-build<br />
of Christchurch since the main earthquakes.<br />
Our private swimming pools are inspected to check that<br />
they comply with the ‘Fencing of Swimming Pools Act’. New<br />
Zealand has a history of accidental drownings and the Fencing<br />
of Swimming Pools Act is a national initiative to drive down the<br />
rate of drownings. Unfortunately, we have also had our share of<br />
tragedy, and we need to make sure that private swimming pools<br />
are safe and that owners have taken steps to prevent accidental<br />
drownings in their pools. We audit one third of registered<br />
private swimming pools annually.<br />
<strong>Plan</strong>s for the future<br />
Building Controls<br />
In 2011/12 we did a desk top study of earthquake prone<br />
buildings (EPB’s) as per our Earthquake Prone Building Policy<br />
We are required to become Building Consent Authorities (BCA)<br />
or to contract a BCA to carry out building inspection work on<br />
our behalf. Despite us becoming the third accredited BCA in the<br />
country in 2007, accreditation has ongoing costs. Our building<br />
officers have to be qualified and have quality assurance systems<br />
which are used and maintained. Our systems are externally<br />
audited every two years to ensure minimum standards are being<br />
met on an ongoing basis.<br />
We will continue to inspect private swimming pools once every<br />
three years as we did encounter a high number of pool safety<br />
issues requiring attention in previous pool audits.<br />
Public Health & Liquor Licencing<br />
Any growth in the district will continue to see an increase in<br />
liquor license applications and managers’ certificates. Likewise<br />
with health inspections as food premises and bars develop in<br />
the area.<br />
There will be a new environment for liquor and food safety<br />
throughout the <strong>District</strong> with the Sale of Liquor Act 1989, the<br />
Food Act 1981 and the Food Hygiene Regulations 1974 likely to<br />
be superseded by new legislation in <strong>2012</strong>. The implementation<br />
phases of these new pieces of legislation will require close<br />
liaison with licensees, managers and food premise operators.<br />
The new liquor laws will require changes to the current <strong>District</strong><br />
Licensing Agency structure.<br />
The new food legislation will require food service sector<br />
premises, e.g. restaurant, hotels, cafes, takeaways and caterers, to<br />
operate under Food Control <strong>Plan</strong>s which are a risk management<br />
based approach to food safety. While these are currently<br />
voluntary, they have been promoted among local premises with<br />
some now registered and operating under these plans.<br />
Animal Control<br />
We operate our dog control activity as per our dog policy and<br />
bylaw. Both need to be reviewed in 2013. We are investigating<br />
issuing infringement notices and charging fines to encourage<br />
responsible behaviour by the few animal owners who do not<br />
comply with the regulations.<br />
122
<strong>Hurunui</strong> <strong>Community</strong> <strong>Long</strong> <strong>Term</strong> <strong>Plan</strong> <strong>2012</strong> - <strong>2022</strong><br />
A small addition to the Pound at Balcairn is proposed in <strong>2012</strong>.<br />
A greater focus on educating owners about being responsible<br />
dog owners is proposed in spring <strong>2012</strong> including an education<br />
programme on permitted dog exercise areas.<br />
There are no major plans for the future other than ‘business as<br />
usual’.<br />
Funding<br />
Building Controls<br />
Operational Costs:<br />
• Building consents including inspections 100% user<br />
charges.<br />
• Building advice and complaint investigation funded via<br />
the <strong>District</strong> rate.<br />
• Costs relating to the Building Controls Authority<br />
accreditation process will be funded by a separate levy<br />
charged on building consents.<br />
• Swimming pool inspections - 100% of the costs will be<br />
recovered from a targeted rate, one rating unit where<br />
it is located.<br />
• Swimming pools which remain non-compliant will<br />
incur an inspection fee for any inspections.<br />
Public Health<br />
Operational Costs<br />
• User charges meet a portion of the cost with the<br />
shortfall to be met from the <strong>District</strong> Rate.<br />
Liquor Licencing<br />
Operational Costs<br />
• Maximum fees as set out in the Sale of Liquor Act with<br />
any short fall from the <strong>District</strong> Rate.<br />
Animal Control<br />
Operational Costs<br />
• Dog administration costs are funded by the dog<br />
registration fee.<br />
• Stock control costs are met 100% from the <strong>District</strong><br />
Rate.<br />
<strong>Council</strong> Owned Assets<br />
Building Controls<br />
• Vehicles to undertake inspections<br />
Public Health& Liquor Licencing<br />
• Vehicles to undertake inspections<br />
Animal Control<br />
• An animal pound in Balcairn<br />
Maintenance and Operating Implications<br />
Building Controls<br />
We intend to continue to undertake the building control activity<br />
from our office mainly through our staff and with contractors<br />
when demand exceeds our in-house capabilities. We expect to<br />
use external contractors during the next year or two depending<br />
on the work generated as a result of the earthquakes. We have a<br />
shared services agreement with Waimakairi and Selwyn <strong>District</strong><br />
<strong>Council</strong>s.<br />
Public Health & Liquor Licencings<br />
We use our own staff to undertake environmental health and<br />
liquor licensing functions.<br />
Animal Control<br />
This activity is dealt with through a mix of staff and contracted<br />
services. The contractor investigates complaints, collects animals<br />
and impounds dogs and stock when necessary at any time of the<br />
day or night depending on need. Our staff do the administrative<br />
tasks such as dog registration and collecting fees.<br />
Assumptions and Risks<br />
Building Controls<br />
We are unsure about the rate of growth we will have in the<br />
<strong>District</strong> in the coming years, but may experience an increase due<br />
to the impact of the Christchurch earthquakes. At the time of<br />
writing this plan, we had not experienced any real growth. If we<br />
do have a surge of new residents wanting to build, this will have<br />
an impact on staffing in an already tight market for experienced<br />
building personnel. We are not alone regarding this issue, as this<br />
is being felt New Zealand wide. We are working closely with<br />
our neighbouring <strong>Council</strong>s to find the best solutions for future<br />
collaboration. There is the possibility that the building controls<br />
work be centralised and removed from local government to<br />
oversee if local solutions cannot be found.<br />
123
www.hurunui.govt.nz<br />
Public Health & Liquor Licencing<br />
<strong>Long</strong> term projections for the district indicate that there will<br />
be growth. Therefore, it is assumed that there will at some<br />
stage be an increased demand for inspections and licensing. A<br />
big challenge for us is to find a medium step between enabling<br />
tourism to flourish (and therefore, enabling outlets to sell alcohol<br />
at all hours), and ensuring the communities and members of the<br />
public are not subjected to the effect of bad behaviour through<br />
alcohol abuse.<br />
Animal Control<br />
Shared Services<br />
Building Controls<br />
We have been working closely with the Selwyn and Waimakariri<br />
<strong>District</strong> <strong>Council</strong>s to share our building officers and resources to<br />
manage this area more efficiently. Skilled building officers have<br />
been in high demand and this is expected to continue for some<br />
years due to the impact of the Canterbury Earthquakes since<br />
September 2010.<br />
<strong>Council</strong> is assuming business as usual within this activity area.<br />
<strong>Community</strong> Outcomes<br />
Goals and Performance Measures<br />
1. A desirable and safe place to live<br />
2. A place that demonstrates environmental responsibility<br />
Goals<br />
Buildings are safe for the<br />
public<br />
Food and liquor premises are<br />
compliant with standards<br />
Dogs and stock do not cause<br />
a nuisance<br />
How we will achieve our<br />
Goals<br />
Inspect buildings in accord<br />
with NZ Building Standards<br />
Inspect food and liquor<br />
outlets to make sure they<br />
do not pose any risk to the<br />
public<br />
Investigate complaints about<br />
animals causing danger or<br />
nuisance<br />
Performance Measures Current Situation 11/12 12/13 13/14 14/15 15+<br />
By 2014/15 all earthquake<br />
prone buildings have been<br />
inspected<br />
80%* of building consents<br />
are processed within 20<br />
working days<br />
100% of licenced food and<br />
on licence liquor premises<br />
are inspected annually<br />
All serious** dog<br />
complaints are followed up<br />
within 24 hours<br />
This is a new measure<br />
94% of building consents<br />
were processed within 20<br />
working days<br />
√<br />
√ √ √ √<br />
100% were inspected √ √ √ √<br />
This is a new measure √ √ √ √<br />
*Due to the demand for building officers, we expect this performance measure to be difficult to achieve. Ideally, we would aim for 100% but<br />
this is unlikely in the foreseeable future.<br />
**Serious dog complaints involve dog attacks and/or biting incidents.<br />
Financial Summary<br />
A financial summary for this activity is shown on the next page.<br />
124
<strong>Hurunui</strong> <strong>Community</strong> <strong>Long</strong> <strong>Term</strong> <strong>Plan</strong> <strong>2012</strong> - <strong>2022</strong><br />
Compliance and Regulatory - Activity Financial Summary<br />
Annual <strong>Plan</strong> Year 1 Year 2 Year 3 Year 4 Year 5 Year 6 Year 7 Year 8 Year 9 Year 10<br />
2011/<strong>2012</strong> <strong>2012</strong>/2013 2013/2014 2014/2015 2015/2016 2016/2017 2017/2018 2018/2019 2019/2020 2020/2021 2021/<strong>2022</strong><br />
Operating Statement<br />
Operating Revenue<br />
<strong>District</strong> Wide Rates 168,765 266,135 295,666 308,755 289,287 311,813 321,307 330,851 345,748 354,500 366,843<br />
Targeted Rates 23,530 0 0 0 0 0 0 0 0 0 0<br />
Other Income 699,776 655,300 675,811 696,387 718,471 742,127 763,228 784,787 809,623 836,884 864,275<br />
Internal Interest Received 2,490 0 0 0 0 0 0 0 0 0 0<br />
Total Operating Revenue 894,561 921,435 971,477 1,005,143 1,007,758 1,053,941 1,084,535 1,115,638 1,155,371 1,191,384 1,231,119<br />
Operating Expenditure<br />
Employee Benefits 482,846 432,708 446,252 459,839 474,421 490,042 503,975 518,211 534,611 552,611 570,699<br />
Direct Operating Expenditure 223,550 261,050 267,158 298,672 257,161 290,543 273,180 307,244 289,787 327,640 309,348<br />
<strong>Council</strong> Overheads Expenditure 220,020 230,677 238,723 250,322 256,092 265,813 274,568 283,356 297,383 305,180 316,564<br />
Depreciation 20,428 20,000 20,000 20,000 20,000 20,000 20,000 20,000 20,000 20,000 20,000<br />
Total Operating Expenditure 946,844 944,435 972,133 1,028,832 1,007,674 1,066,398 1,071,723 1,128,812 1,141,781 1,205,432 1,216,611<br />
Operating Surplus (Deficit) (52,283) (23,000) (656) (23,690) 84 (12,458) 12,812 (13,174) 13,591 (14,048) 14,508<br />
Capital Statement<br />
Capital Expenditure<br />
Building Control 0 0 25,980 26,845 0 28,768 29,863 0 32,398 33,878 0<br />
Public Health 0 0 25,980 0 0 28,768 0 0 32,398 0 0<br />
Total Capital Expenditure 0 0 51,960 26,845 0 57,535 29,863 0 64,795 33,878 0<br />
Funds Required<br />
Operating Deficit 52,283 23,000 656 23,690 0 12,458 0 13,174 0 14,048 0<br />
Capital Expenditure 0 0 51,960 26,845 0 57,535 29,863 0 64,795 33,878 0<br />
Transfer to General <strong>Council</strong> Reserves 20,428 20,000 20,000 20,000 20,000 20,000 20,000 20,000 20,000 20,000 20,000<br />
Transfer to Special Funds 0 22,000 22,689 23,379 24,121 24,915 25,623 26,347 27,181 28,096 29,016<br />
72,711 65,000 95,304 93,914 44,121 114,908 75,486 59,521 111,976 96,022 49,016<br />
Funded by<br />
Operating Surplus 0 0 0 0 84 0 12,812 0 13,591 0 14,508<br />
Non Cash Expenditure - Depreciation 20,428 20,000 20,000 20,000 20,000 20,000 20,000 20,000 20,000 20,000 20,000<br />
General <strong>Council</strong> Reserves 16,848 0 51,960 26,845 0 57,535 29,863 0 64,795 33,878 0<br />
Transfer from Special Funds 35,435 45,000 23,344 47,069 24,036 37,373 12,812 39,521 13,591 42,144 14,508<br />
72,711 65,000 95,304 93,914 44,121 114,908 75,486 59,521 111,976 96,022 49,016<br />
H:\<strong>Long</strong> <strong>Term</strong> <strong>Plan</strong> Workings\<strong>Hurunui</strong> <strong>District</strong> <strong>Council</strong> LTP Budgets <strong>2012</strong>-<strong>2022</strong> - Post Submissions.xls 31/05/<strong>2012</strong> 9:34 a.m.<br />
125
www.hurunui.govt.nz<br />
Activity 4: Waste Minimisation<br />
Overview<br />
The Waste Minimisation activity includes the various functions<br />
of waste management, such as refuse, recycling, transfer stations<br />
and litter bin collection.<br />
Current Situation<br />
Our current delivery model for waste and recycling services<br />
has been in place since February 2009 The model came about<br />
after a major review due to concerns about rising costs and<br />
unsustainability into the future. We now contract the following<br />
providers to deliver our refuse and recycling services:<br />
• Waste Control New Zealand collect domestic and<br />
commercial waste and commercial recycling in all<br />
urban areas of the district and domestic waste from<br />
those rural address on the collection route who pay<br />
the appropriate rate. Waste Control is also contracted<br />
to provide domestic recycling collections in Hanmer<br />
Springs, which includes the pick-up of glass.<br />
• Waste Control New Zealand transports <strong>Council</strong>’s<br />
waste to Kate Valley, green waste to Envirocomp,<br />
e-waste to E-Scrap and dry waste and glass to Amberley.<br />
In addition the Cheviot, Culverden and Waiau transfer<br />
stations are run by Waste Control and they manage the<br />
Waikari drop off.<br />
• North Canterbury <strong>Community</strong> Resources (NCCR)<br />
collects (excluding Hanmer Springs) and processes the<br />
domestic kerbside recycling and operates the Amberley<br />
transfer station.<br />
• Container Waste backloads glass and dry waste (from<br />
our transfer stations) from Amberley to Christchurch<br />
for sorting and processing by New Zealand Recovery.<br />
We provide a weekly kerbside refuse collection service to<br />
our urban communities in Amberley, Amberley Beach, Cheviot,<br />
Culverden, Gore Bay, Greta Valley, Hanmer Springs, Hawarden,<br />
Leithfield, Leithfield Beach, Motanau Beach, Mt Lyford, Omihi,<br />
Rotherham, Scargill, Waiau, Waikari and Waipara. Due to the<br />
large size of the rural areas, it is too costly to run a routine rural<br />
kerbside collection service. However, the rural households<br />
which are situated along the collection route may use the<br />
kerbside collection service by paying the refuse collection rate<br />
and using the rural collection stickers we provide Other rural<br />
householders can also do the same as long as they drop their<br />
refuse at a location agreed with council, pay the appropriate rate<br />
and use the collection stickers.<br />
Glass containers are available at all five transfer stations for<br />
people to drop off glass for recycling at no cost, this is then<br />
crushed and used in roading. Dry waste from the northern sites<br />
is brought to Amberley for collection and is then backloaded<br />
to Christchurch using empty container waste trucks returning<br />
from Kate Valleyfor processing through NZ Recovery.<br />
Our five transfer stations are located at Cheviot, Hanmer<br />
Springs, Culverden, Amberley and Waiau. The Amberley<br />
Transfer Station is managed by NCCR. Waste Control New<br />
Zealand operates the Cheviot, Culverden and Waiau transfer<br />
stations and Waikari drop off and the Hanmer Springs transfer<br />
station is managed by <strong>Council</strong> staff. Recycling drop off points are<br />
also provided in Hanmer Springs and Culverden<br />
There are six closed landfills which have resource consents<br />
issued by Canterbury Regional <strong>Council</strong>. The closed landfills are<br />
located at Cheviot, Culverden, Hanmer Springs, Waiau, Waikari<br />
and Waipara. Groundwater levels are tested regularly at these<br />
landfills to ensure they present no risk to the environment.<br />
We are a shareholder of Transwaste Canterbury Ltd (TCL) which<br />
opened a regional landfill at Kate Valley in 2005 along with four<br />
other neighbouring local authorities who are also shareholders.<br />
This landfill is located inside the <strong>Hurunui</strong> district, and we have an<br />
on-going responsibility and commitment to ensure its operations<br />
comply at all times with the consent conditions granted by both<br />
our <strong>Council</strong> and Canterbury Regional <strong>Council</strong>. As a minor<br />
shareholder in TCL, <strong>Council</strong> receives annual dividends for the<br />
joint venture. We are expecting to receive $72,000 in dividends<br />
for the <strong>2012</strong>/2013 year.<br />
We supported Envirocomp to develop a commercial nappy<br />
composting plant in our district in early 2009 and agreed to a 15<br />
year lease on a council property. Envirocomp use green waste<br />
generated through our transfer stations as a bulking agent to<br />
aid the nappy composting process. This is the first commercial<br />
nappy composting facility in New Zealand able to compost all<br />
brands of disposable nappies and offers a credible and efficient<br />
alternative solution to landfill.<br />
<strong>Plan</strong>s for the future<br />
An on-going challenge to us (and the rest of the world) is how<br />
to deal with increasing amounts of packaging and waste material.<br />
We intend to administer our waste and recycling services as<br />
they are currently, but will continue to look for efficiencies to<br />
reduce the levels of refuse to landfill. The current contracts for<br />
our waste and recycling service providers are for 3 years and<br />
after that time, there is the option, with council approval, to<br />
extend the contracts for a further two years (3+1+1). After<br />
completion of the contracts, we will need to determine whether<br />
to further extend the contracts or re tender. The budget for<br />
future years is based on the current contracts (with inflation<br />
adjustments).<br />
The Kate Valley landfill has a useful life in excess of the 10 year<br />
planning period of this plan.<br />
126
<strong>Hurunui</strong> <strong>Community</strong> <strong>Long</strong> <strong>Term</strong> <strong>Plan</strong> <strong>2012</strong> - <strong>2022</strong><br />
In <strong>2012</strong>, <strong>Council</strong> adopted a new Waste Management and<br />
Minimisation <strong>Plan</strong>. The purpose of this plan is to:<br />
• Describe our vision for waste management and<br />
minimisation, whilst determining long term goals for the<br />
<strong>Hurunui</strong> district and providing direction as to how they<br />
will be achieved.<br />
• Initiate strategies, objectives, policies and activities to<br />
achieve these goals and determine how to measure<br />
progress.<br />
• Provide details regarding how we will fund the proposed<br />
activities over the coming six years.<br />
• Meet our legal requirements regarding waste<br />
management.<br />
A new transfer station will be built in Amberley in the <strong>2012</strong>/13<br />
year. This has been planned for several years. A new location<br />
has taken some time to identify. There are no major plans for<br />
the other stations at this time. We expect our facilities to be<br />
able to cope with increased volumes of material.<br />
Funding<br />
Operational Costs:<br />
• Refuse collection costs are met through targeted rates<br />
for each dwelling or business in each urban area based<br />
on the cost of collection in that urban area.<br />
• Rural ratepayers on the route can have their rubbish and<br />
recycling picked up, providing they pay the appropriate<br />
rate, the collection point is agreed in advance with<br />
council and the rural refuse collection stickers are used.<br />
• Transfer station costs are met through fees set at each<br />
transfer station. The fees are set to encourage use and<br />
discourage illegal dumping. Any shortfall in costs is<br />
met from a <strong>District</strong> Rate.<br />
• Litter bin collection costs are all met through a <strong>District</strong><br />
Rate.<br />
Capital Costs:<br />
• Any capital expenditure on the transfer stations is<br />
funded over the life of the asset through a <strong>District</strong> Rate.<br />
• Income from the <strong>Council</strong>’s share of the Government’s<br />
landfill levy may be used for capital purchases.<br />
<strong>Council</strong> Owned Assets<br />
Five transfer stations are located at:<br />
• Amberley<br />
• Cheviot<br />
• Culverden<br />
• Hanmer Springs<br />
• Waiau<br />
Maintenance and Operating Implications<br />
Most of our recycling and refuse services are contracted out<br />
and we see this as being the most economical and efficient<br />
method for the conceivable future.<br />
We own our transfer stations and contract out the running of<br />
most of them and the cartage of residual waste to the landfill<br />
and recycling to Christchurch.<br />
Assumptions and Risks<br />
Environmental consultants monitor groundwater bores at the<br />
district’s closed landfills.<br />
Although in recent years, the growth in the district has been slow,<br />
household waste is growing and we expect this to continue. The<br />
cost of waste disposal is likely to continue to increase unless we<br />
take proactive action. Therefore it is important that we educate<br />
consumers about alternative methods of dealing with waste in<br />
an effort to reduce it and ensure that services are provided<br />
in the most cost efficient and affordable manner. The price of<br />
fuel has increased since the collection service contracts were<br />
last negotiated which will impact on the cost of future contract<br />
tenders.<br />
The growth of disposable goods and packaging present us with<br />
an on-going challenge to ensure we are able to recycle and<br />
reuse as much waste as possible. Our modest transfer stations<br />
are expected to cope with these increasing volumes.<br />
One of our major challenges is to find affordable ways to<br />
encourage people to minimise or dispose of their waste in the<br />
most environmentally sustainable way. High waste disposal<br />
costs lead some people to illegally dump waste but setting<br />
charges too low means that everyone pays irrespective of their<br />
individual efforts to reduce waste. Higher standards for landfills<br />
add to the increasing costs.<br />
127
www.hurunui.govt.nz<br />
Shared Services<br />
The Kate Valley Landfill is situated within the <strong>Hurunui</strong> district<br />
but is a joint venture between Canterbury Waste Services<br />
Limited (which is owned by Transpacific Industries Group (NZ)<br />
Limited) and five Local authorities in Canterbury, including<br />
<strong>Hurunui</strong> <strong>District</strong> <strong>Council</strong>. The <strong>Council</strong>’s collective share is 50%<br />
with 1.2% of that belonging to the <strong>Hurunui</strong> <strong>District</strong> <strong>Council</strong>.<br />
The company name is Transwaste Canterbury Ltd.<br />
<strong>Community</strong> Outcomes<br />
1. A desirable and safe place to live<br />
2. A place that demonstrates environmental responsibility<br />
Goals and Performance Measures<br />
Goals<br />
How we will achieve our<br />
Goals<br />
Performance Measures Current Situation 11/12 12/13 13/14 14/15 15+<br />
To continue to work to<br />
reduce the quantities of<br />
residual waste from the<br />
district, disposed of to landfill.<br />
Encourage the community<br />
to recycle and reduce their<br />
residual waste<br />
Residual waste to landfill<br />
reduces each year<br />
Recycling levels increase<br />
each year<br />
In the 6 months to<br />
December 2011, 937 tonnes<br />
of waste went to the landfill<br />
– we will be looking at<br />
reducing this on a per capita<br />
basis over time.<br />
Recycling in the district<br />
reached 38.5% of waste in<br />
the 6 months to December<br />
2011 – we will be looking for<br />
increased levels of recycling<br />
over time<br />
√ √ √ √<br />
√ √ √ √<br />
Financial Summary<br />
A financial summary for this activity is shown on the next page.<br />
128
<strong>Hurunui</strong> <strong>Community</strong> <strong>Long</strong> <strong>Term</strong> <strong>Plan</strong> <strong>2012</strong> - <strong>2022</strong><br />
Waste Minimisation - Activity Financial Summary<br />
Annual <strong>Plan</strong> Year 1 Year 2 Year 3 Year 4 Year 5 Year 6 Year 7 Year 8 Year 9 Year 10<br />
2011/<strong>2012</strong> <strong>2012</strong>/2013 2013/2014 2014/2015 2015/2016 2016/2017 2017/2018 2018/2019 2019/2020 2020/2021 2021/<strong>2022</strong><br />
Operating Statement<br />
Operating Revenue<br />
<strong>District</strong> Wide Rates 871,071 884,238 911,999 941,838 970,848 1,002,785 1,032,036 1,061,155 1,095,622 1,132,609 1,169,564<br />
Targeted Rates 801,348 742,201 748,378 771,949 795,513 821,623 844,931 868,731 897,084 926,239 956,462<br />
Other Income 193,500 227,000 234,105 241,233 248,883 257,078 264,387 271,855 280,459 289,902 299,390<br />
Total Operating Revenue 1,865,919 1,853,439 1,894,482 1,955,020 2,015,244 2,081,485 2,141,354 2,201,741 2,273,164 2,348,750 2,425,416<br />
Operating Expenditure<br />
Employee Benefits 72,353 76,183 78,568 80,960 83,527 86,277 88,730 91,237 94,124 97,293 100,478<br />
Direct Operating Expenditure 1,572,490 1,621,810 1,672,573 1,723,497 1,778,152 1,836,700 1,888,922 1,942,280 2,003,746 2,071,213 2,139,005<br />
Internal Interest Paid 10,639 1,114 0 0 0 0 0 0 0 0 0<br />
<strong>Council</strong> Overheads Expenditure 121,812 120,200 124,582 130,649 133,651 138,594 143,054 147,577 154,646 158,462 164,152<br />
Depreciation 25,000 18,760 18,760 19,914 19,914 19,914 20,648 20,648 20,648 21,781 21,781<br />
Total Operating Expenditure 1,802,294 1,838,067 1,894,482 1,955,020 2,015,244 2,081,485 2,141,354 2,201,741 2,273,164 2,348,750 2,425,416<br />
Operating Surplus (Deficit) 63,625 15,372 0 0 0 0 0 0 0 0 0<br />
Capital Statement<br />
Capital Expenditure<br />
Transfer Stations 0 0 0 0 0 0 0 0 0 0 0<br />
Litter Bin Collection 0 0 0 0 0 0 0 0 0 0 0<br />
Refuse Collection 0 0 0 0 0 0 0 0 0 0 0<br />
Total Capital Expenditure 0 0 0 0 0 0 0 0 0 0 0<br />
Funds Required<br />
Capital Expenditure 0 0 0 0 0 0 0 0 0 0 0<br />
Transfer to General <strong>Council</strong> Reserves 25,000 18,760 18,760 19,914 19,914 19,914 20,648 20,648 20,648 21,781 21,781<br />
Repayment of Internal Loans from Operating Income 5,976 15,372 0 0 0 0 0 0 0 0 0<br />
30,976 34,132 18,760 19,914 19,914 19,914 20,648 20,648 20,648 21,781 21,781<br />
Funded by<br />
Operating Surplus 63,625 15,372 0 0 0 0 0 0 0 0 0<br />
Transfer from Hanmer Springs Thermal Reserve 0 0 0 0 0 0 0 0 0 0 0<br />
Non Cash Expenditure - Depreciation 25,000 18,760 18,760 19,914 19,914 19,914 20,648 20,648 20,648 21,781 21,781<br />
88,625 34,132 18,760 19,914 19,914 19,914 20,648 20,648 20,648 21,781 21,781<br />
H:\<strong>Long</strong> <strong>Term</strong> <strong>Plan</strong> Workings\<strong>Hurunui</strong> <strong>District</strong> <strong>Council</strong> LTP Budgets <strong>2012</strong>-<strong>2022</strong> - Post Submissions.xls 31/05/<strong>2012</strong> 9:34 a.m.<br />
129
www.hurunui.govt.nz<br />
<strong>District</strong> Promotion<br />
Overview<br />
<strong>District</strong> Promotion covers the following activity described<br />
below:<br />
Activity 1: <strong>District</strong> Promotion (economic development, tourism<br />
and events and district promotion)<br />
Our Aim<br />
To retain businesses and support their growth and prosperity,<br />
to attract investment, new businesses, tourists and visitors, and<br />
promote the <strong>Hurunui</strong> <strong>District</strong> to improve the local economy<br />
and wellbeing of the local community.<br />
Why is the <strong>Council</strong> Involved?<br />
We are involved in economic development and in tourism<br />
promotion because we recognise that the growth of business<br />
and visitor industry provides major economic benefits and are<br />
important for the future growth of the district. Growing existing<br />
business and attracting investment and new businesses into the<br />
district brings new job opportunities for residents, encourages<br />
more people to settle in the district and therefore, increases the<br />
breadth and depth of the economy. Rural community services<br />
and facilities are frequently under threat through depopulation;<br />
however, focusing on sustainable growth should negate this<br />
effect. We consider our district to be unique and that there are<br />
opportunities for diversification to encourage employment and<br />
business growth.<br />
Significant Negative Effects<br />
Any increase in business and tourism in the <strong>District</strong> may have<br />
a negative impact on environmental wellbeing as this will result<br />
in an increase in waste, air and noise pollution, traffic, and<br />
pressure on water and sewerage schemes. This is more likely<br />
to be evident in areas like Hanmer Springs, which is our most<br />
popular tourist town. As far as this can be controlled, this will<br />
be offset to some extent from the value derived from economic<br />
development and the tourism industry. With proper planning,<br />
any growth in business and tourism should be sustainable for<br />
the foreseeable future.<br />
Emergency Management<br />
In an emergency, particularly a civil defence emergency, we will<br />
continue to deliver services as long as it is safe and practical to<br />
continue to do so. Civil defence management plans provide<br />
the <strong>Council</strong> with guidance and contingencies. However, in an<br />
extreme emergency, the services in this group would not be<br />
considered essential.<br />
Financial Summary<br />
A financial summary for this group of activities is shown at the<br />
end of the <strong>District</strong> Promotion activity.<br />
<strong>Community</strong> Outcomes<br />
The <strong>District</strong> Promotion activity described in this section,<br />
primarily contributes to the following community outcome:<br />
1. A place with a thriving local economy:<br />
• We are seen as a good place to do business, to live and<br />
to visit<br />
Major Projects <strong>Plan</strong>ned<br />
Project<br />
Develop a new district<br />
promotion model<br />
Review the current Targeted<br />
Tourism Rate<br />
Year <strong>Plan</strong>ned<br />
<strong>2012</strong>/13 2013/14 2014/15 2015+<br />
√<br />
√<br />
130
<strong>Hurunui</strong> <strong>Community</strong> <strong>Long</strong> <strong>Term</strong> <strong>Plan</strong> <strong>2012</strong> - <strong>2022</strong><br />
Activity 1: <strong>District</strong> Promotion<br />
Overview<br />
The <strong>District</strong> Promotion activity includes the various functions of<br />
economic development, tourism events and district promotion.<br />
Current Situation<br />
Currently, we manage economic development and tourism as<br />
separate functions, and from time to time we do a small amount<br />
of what we would call more general promotion of the district.<br />
We are looking at moving from what we do at present, to<br />
maximise our returns and focus on a broader promotion of the<br />
whole district rather than the main emphasis being on tourism,<br />
as it is now.<br />
Tourism is a significant sector contributing major economic value<br />
across the district. Our tourism activity is delivered at present<br />
under the direction from one of our <strong>Council</strong> committees called<br />
the <strong>Hurunui</strong> Tourism Board. This Board is a <strong>Council</strong> committee.<br />
In addition, to four elected members, non-elected members<br />
are chosen for their business skills and insights relative to the<br />
tourism industry in <strong>Hurunui</strong>, as well as their knowledge and<br />
representation of the district.<br />
Tourism activity in the <strong>Hurunui</strong> district and New Zealand has<br />
been stable. The earthquake activity mainly in Christchurch<br />
since 2010 has had an impact on international visitor arrivals<br />
into Canterbury, but it is expected that overall visitor arrivals<br />
(domestic and international) into <strong>Hurunui</strong> will continue to<br />
remain stable. The domestic market greatly increased which<br />
made up for the reduction in overseas visitors. Domestic visitors<br />
staying overnight are forecast to make up a significant number of<br />
all Canterbury visits with most coming from Christchurch. The<br />
Australian market usually is the most significant international<br />
visitor market.<br />
Economic development is delivered through ‘Enterprise<br />
North Canterbury” (ENC) which is a joint <strong>Council</strong> controlled<br />
organisation formed with Waimakariri <strong>District</strong> <strong>Council</strong> in<br />
2002. ENC’s role is to enable and empower others in North<br />
Canterbury in terms of the economy to do better: to export<br />
more; to employ more people in well-paid jobs; and to<br />
contribute to the growth in the wealth of our community. This<br />
is achieved via a number of programmes. Core funding from the<br />
Waimakariri and <strong>Hurunui</strong> <strong>District</strong> <strong>Council</strong>s is leveraged with<br />
contracts from central government, and supported by projectspecific<br />
funding from local industries.<br />
Over the past several years, there has been a dramatic change<br />
in our district’s business landscape with multiple businesses<br />
having been established in Waipara Valley and Hanmer Springs in<br />
particular. There was some decline from late 2008 on account<br />
of the economic downturn and recovery has been slow. ENC<br />
works in conjunction with our district’s employers by providing<br />
access to information and assistance to establish, develop, train<br />
and strengthen local businesses.<br />
The <strong>Council</strong> is faced with a number of issues, challenges, and<br />
opportunities in its district promotion planning, such as:<br />
• A need to increase the level of spend on the domestic<br />
market.<br />
• Ensuring that all money spent on district promotion,<br />
including tourism and economic development is<br />
maximised and gains maximum leverage and advantage.<br />
• With Hanmer Springs being clearly a well-known<br />
destination in New Zealand, ensuring that other parts<br />
of the <strong>Hurunui</strong> <strong>District</strong> are also well promoted and<br />
have access to the same resources and opportunities<br />
that Hanmer Springs does.<br />
• We are a small district and have proportionally less to<br />
spend on promotion compared with other districts.<br />
• Ensuring that any economic growth is true growth<br />
rather than a redistribution of resources and business<br />
locations.<br />
• Overcome, where possible, any inefficiencies and<br />
duplication that exists between the separate operations<br />
(and cost centres) of Hanmer Springs Thermal Pools<br />
and Spa, <strong>Hurunui</strong> Tourism, and ENC.<br />
• Making sure that we are getting good value from ENC<br />
and that results can be quantified.<br />
<strong>Plan</strong>s for the future<br />
We think we can do better than we have been by promoting<br />
district and business activity generally rather than focusing on<br />
those involved in tourism. As such, we plan to redesign both<br />
the way we fund district promotion, including tourism, and<br />
what our activity might actually look like. Tourism is mostly<br />
funded through a ‘targeted tourism rate’ against businesses who<br />
are directly involved in the tourism sector. The issue of who<br />
benefits from tourism and who should fund it, is a challenging<br />
issue and we want to develop a better way to do this.<br />
We want to take a stronger leadership role in the general<br />
promotion of the district to include all businesses and people<br />
living here rather than only focusing on tourism. We plan to<br />
continue with the targeted tourism rate up to the end of the<br />
<strong>2012</strong>/13 (and 10 year budget for the meantime), but want to<br />
invite public views as to what district promotion and a future<br />
funding model could look like. Through this draft long term plan,<br />
the first stage of consultation on this subject will be initiated.<br />
After the plan is finalised, we will start to shape up good ideas<br />
and may consult with the public again before deciding on the<br />
best way forward.<br />
131
www.hurunui.govt.nz<br />
After taking into account public views, we will look at how we<br />
might phase out the current targeted tourism rate in 2013/14<br />
when a new model would take effect. We do not have any detail<br />
on a possible alternative model at this stage and plan to develop<br />
this thinking after consultation during the <strong>2012</strong>/13 year.<br />
Along with a new funding model, we also want to explore<br />
how to govern and lead district promotion. That may involve<br />
a new board such as a possible ‘Investment and Promotion<br />
Advisory Board’, or it may be through an enhanced <strong>Hurunui</strong><br />
Tourism Board. We will continue with our current models while<br />
considering this, until an alternative district promotion model is<br />
developed.<br />
While considering our new model, we plan to look closely at<br />
the role of ENC and what actual benefit is delivered to and<br />
derived for our district. Although we have continued to budget<br />
to retain our services with ENC through the life of this <strong>Long</strong><br />
<strong>Term</strong> <strong>Plan</strong>, it is an opportune time to ensure that we are getting<br />
best value from our annual spend. We do not have the answers<br />
yet, or any alternative models, but this will come as we develop<br />
our future district promotion model.<br />
Funding<br />
Operational Costs:<br />
• Currently, tourism is funded via a targeted tourism<br />
rate from ratepayers and businesses who are involved<br />
directly in the tourism sector. This rate is planned to<br />
be phased out after <strong>2012</strong>/13 and replaced with a new<br />
funding model yet to be designed.<br />
• An additional contribution of $45,000 is used toward<br />
tourism from the Hanmer Springs Thermal Reserve<br />
surplus.<br />
• General district promotion when undertaken is funded<br />
via a <strong>District</strong> Rate or Targeted Tourism Rate.<br />
• <strong>Council</strong> provides an annual grant of $50,000 to Enterprise<br />
North Canterbury for economic development services.<br />
This is 100% funded through the General Rate.<br />
Capital Costs:<br />
• Currently through the targeted tourism rate as<br />
described above<br />
<strong>Council</strong> Assets<br />
Maintenance and Operating Implications<br />
The <strong>Hurunui</strong> Tourism Board contracts the delivery of most of<br />
its services including specialist advice, and some work is done<br />
in house by a <strong>Council</strong> Officer dedicated to tourism marketing.<br />
Economic development is provided by Enterprise North<br />
Canterbury which is a <strong>Council</strong> controlled organisation.<br />
Assumptions and Risks<br />
The continuation of the grant made to Enterprise North<br />
Canterbury is dependent on there being continued returns and<br />
gains made. <strong>Council</strong>’s plans regarding economic development<br />
are based on the assumption that New Zealand’s economy<br />
will continue to be buoyant (while acknowledging the global<br />
economic crisis), and that the benefits to the <strong>District</strong>’s businesses<br />
are in excess of the costs incurred by the <strong>Council</strong>.<br />
Little in the way of growth has occurred within the district over<br />
the last few years and economic downturn has had a marked<br />
impact on overseas tourism. It is assumed that growth will<br />
begin to return, however, not necessarily at the same high rate<br />
as in earlier years. We have seen that external factors, such as<br />
natural disasters (earthquake) do have an impact on tourism.<br />
What we had not necessarily anticipated was that visitor<br />
numbers continued to be high, but mainly from people within<br />
the Canterbury area.<br />
We are making assumptions that the targeted tourism rate<br />
is still not popular and that those affected will support us in<br />
seeking an improved funding model.<br />
Shared Services<br />
<strong>Hurunui</strong> and Waimakariri <strong>District</strong> <strong>Council</strong>s jointly support<br />
and fund Enterprise North Canterbury (ENC) to help boost<br />
economic development in North Canterbury. We have<br />
budgeted $50,000 to contribute for the 2011/12 year. ENC<br />
work with businesses in both districts, providing business<br />
support, development and training, and special projects with an<br />
economic focus.<br />
• <strong>District</strong> promotion boards in main townships.<br />
132
<strong>Hurunui</strong> <strong>Community</strong> <strong>Long</strong> <strong>Term</strong> <strong>Plan</strong> <strong>2012</strong> - <strong>2022</strong><br />
Goals and Performance Measures<br />
<strong>Community</strong> Outcomes<br />
• A place with a thriving local economy<br />
Goals<br />
How we will achieve<br />
our Goals<br />
Performance<br />
Measures<br />
Current Situation<br />
11/12<br />
12/13 13/14 14/15 15+<br />
To increase our visitors<br />
and population<br />
Promote the <strong>District</strong><br />
through advertising and<br />
marketing and encourage<br />
people to come<br />
Number of visitor numbers<br />
who stay overnight will<br />
not be less than the NZ<br />
average<br />
Our population increases<br />
each census<br />
Develop a new district<br />
promotion activity model<br />
We had a 9.4% growth in<br />
visitor numbers which was<br />
better than the national<br />
average of a 1.6% decrease<br />
At the last census in 2006<br />
the district’s population was<br />
10,476. The 2011 estimate<br />
is 11,330.<br />
The <strong>Hurunui</strong> Tourism Board<br />
and ENC manage tourism<br />
and economic development<br />
and to a small degree, district<br />
promotion<br />
√ √ √ √<br />
√ √<br />
√<br />
Financial Summary<br />
A financial summary for this activity is shown on the next page.<br />
<strong>Hurunui</strong> River Mouth, Biodiversity Photo Compitition - Cindy Meyers<br />
133
www.hurunui.govt.nz<br />
<strong>District</strong> Promotion - Group Activity Financial Summary<br />
Annual <strong>Plan</strong> Year 1 Year 2 Year 3 Year 4 Year 5 Year 6 Year 7 Year 8 Year 9 Year 10<br />
2011/<strong>2012</strong> <strong>2012</strong>/2013 2013/2014 2014/2015 2015/2016 2016/2017 2017/2018 2018/2019 2019/2020 2020/2021 2021/<strong>2022</strong><br />
Operating Statement<br />
Operating Revenue<br />
. 89,185 90,392 93,141 95,983 98,846 102,003 104,822 107,701 111,114 114,649 118,301<br />
Targeted Rates 275,000 286,000 297,440 309,338 318,618 328,176 338,022 348,162 358,607 369,365 380,446<br />
Other Income 4,000 5,000 5,157 5,314 5,482 5,663 5,824 5,988 6,178 6,386 6,595<br />
Total Operating Revenue 368,185 381,392 395,737 410,634 422,946 435,842 448,667 461,852 475,898 490,400 505,342<br />
Operating Expenditure<br />
Employee Benefits 38,000 40,000 41,252 42,508 43,856 45,300 46,588 47,904 49,420 51,084 52,756<br />
Direct Operating Expenditure 355,726 375,500 394,258 409,551 421,925 434,739 447,695 461,027 474,953 489,422 504,273<br />
<strong>Council</strong> Overheads Expenditure 12,685 3,392 3,527 3,747 3,797 3,940 4,070 4,202 4,449 4,511 4,673<br />
Depreciation 6,000 7,500 3,500 3,500 3,500 3,500 3,500 3,500 3,500 3,500 3,500<br />
Total Operating Expenditure 412,411 426,392 442,537 459,306 473,078 487,478 501,852 516,632 532,322 548,517 565,202<br />
Operating Surplus (Deficit) (44,226) (45,000) (46,800) (48,672) (50,132) (51,636) (53,185) (54,781) (56,424) (58,117) (59,860)<br />
Capital Statement<br />
Capital Expenditure<br />
Tourism 0 0 0 0 0 0 0 0 0 0 0<br />
Total Capital Expenditure 0 0 0 0 0 0 0 0 0 0 0<br />
Funds Required<br />
Operating Deficit 44,226 45,000 46,800 48,672 50,132 51,636 53,185 54,781 56,424 58,117 59,860<br />
Transfer to General <strong>Council</strong> Reserves 6,000 7,500 3,500 3,500 3,500 3,500 3,500 3,500 3,500 3,500 3,500<br />
50,226 52,500 50,300 52,172 53,632 55,136 56,685 58,281 59,924 61,617 63,360<br />
Funded by<br />
Transfer from Hanmer Springs Thermal Reserve 44,226 45,000 46,800 48,672 50,132 51,636 53,185 54,781 56,424 58,117 59,860<br />
Non Cash Expenditure - Depreciation 6,000 7,500 3,500 3,500 3,500 3,500 3,500 3,500 3,500 3,500 3,500<br />
50,226 52,500 50,300 52,172 53,632 55,136 56,685 58,281 59,924 61,617 63,360<br />
H:\<strong>Long</strong> <strong>Term</strong> <strong>Plan</strong> Workings\<strong>Hurunui</strong> <strong>District</strong> <strong>Council</strong> LTP Budgets <strong>2012</strong>-<strong>2022</strong> - Post Submissions.xls 31/05/<strong>2012</strong> 9:34 a.m.<br />
134
Hanmer Springs Thermal Pools and Spa<br />
Overview<br />
Hanmer Springs Thermal Pools and Spa covers the following<br />
activity described below:<br />
Activity 1: Hanmer Springs Thermal Pools and Spa<br />
(pools, i-site, spa, and café)<br />
Our Aim<br />
To be a nationally and internationally recognised quality visitor<br />
destination.<br />
Why is the <strong>Council</strong> Involved?<br />
The Hanmer Springs Thermal Pools and Spa (HSTP&S) was<br />
vested by the Crown in the <strong>Council</strong> and was gazetted as a<br />
recreational reserve on 23 November 1990. <strong>Council</strong> operates<br />
the HSTP&S under the provisions of the Reserves Act 1977. As<br />
well as providing facilities for the social and recreational use of<br />
residents, the HSTP&S makes an important contribution to the<br />
local economy by attracting regional, national and international<br />
visitors to the district. The HSTP&S provides a substantial<br />
revenue stream to the <strong>Council</strong> and has made an important<br />
financial contribution toward the funding of other reserves in<br />
the district. As a result, the pools and spa complex has reduced<br />
the cost to the ratepayer. Over the past 5 years, that financial<br />
contribution has amounted to $7.65 million.<br />
<strong>Community</strong> Outcomes<br />
The Hanmer Springs Thermal Pools and Spa described in<br />
this section, primarily contribute to two of our community<br />
outcomes:<br />
1. A place with a thriving local economy:<br />
• We are seen as a good place to do business, to live and<br />
to visit<br />
2. A place where our traditional rural values and heritage<br />
make <strong>Hurunui</strong> unique:<br />
• People have a range of opportunities to participate in<br />
leisure and culture activities<br />
• Our historic and cultural heritage is protected for<br />
future generations<br />
Major Projects <strong>Plan</strong>ned<br />
<strong>Hurunui</strong> <strong>Community</strong> <strong>Long</strong> <strong>Term</strong> <strong>Plan</strong> <strong>2012</strong> - <strong>2022</strong><br />
Year <strong>Plan</strong>ned<br />
Project<br />
<strong>2012</strong>/13 2013/14 2014/15 2015+<br />
Sulpher pool<br />
upgrade $300,000<br />
Administration<br />
block/changing $2,000,000<br />
rooms upgrade<br />
Spa changing<br />
room upgrade $40,000<br />
Discharge of the<br />
bore $150,000<br />
Methane project<br />
$20,000 $207,840<br />
Information<br />
centre refit $103,920<br />
New pool slide<br />
$519,600<br />
Garden House<br />
Café refit $519,600<br />
Water<br />
resistance pool $536,900<br />
Hexagonal pool<br />
revitalisation $833,025<br />
Significant Negative Effects<br />
This activity attracts significant numbers of tourists into the<br />
township. An increase in tourism and hence, people to the area,<br />
results in an increase in waste, air and noise pollution, traffic, and<br />
pressure on water and sewerage schemes as identified previously.<br />
The popularity of Hanmer Springs has created an increase in<br />
the cost of housing and competition to local businesses, and<br />
thus impacted on the current and future cultural, social and<br />
economic wellbeing of the local community through the threat<br />
to rural identity and the disadvantage to long term residents<br />
who moved into the area before the growth. The challenge<br />
for sustainable management will be to channel some of the<br />
undeniable benefits to economic wellbeing from this activity<br />
into initiatives that compensate for these negative effects and<br />
maintain our ideal of district and community wellness.<br />
Emergency Management<br />
In an emergency, particularly a civil defence emergency, we will<br />
continue to deliver services as long as it is safe and practical to<br />
continue to do so. Civil defence management plans provide<br />
the <strong>Council</strong> with guidance and contingencies. However, in an<br />
extreme emergency, the Thermal Pools and Spa is not considered<br />
in this context to be an essential service, but has its own plans in<br />
place to cope with emergency situations.<br />
135
www.hurunui.govt.nz<br />
Financial Summary<br />
A financial summary for this group of activities is shown at the<br />
end of the Hanmer Springs Thermal Pools and Spa activity.<br />
136
<strong>Hurunui</strong> <strong>Community</strong> <strong>Long</strong> <strong>Term</strong> <strong>Plan</strong> <strong>2012</strong> - <strong>2022</strong><br />
Activity 1: Hanmer Springs Thermal Pools and Spa<br />
Overview<br />
The Hanmer Springs Thermal Pools and Spa (HSTP&S) activity<br />
includes the thermal pools, i-site, spa and café.<br />
Current Situation<br />
The Hanmer Springs Thermal Pools and Spa (HSTP&S) is one<br />
of New Zealand’s premier tourist attractions. Each year over<br />
500,000 customers visit the thermal pools to bathe in the<br />
waters, enjoy the water activities and partake in massage and<br />
beauty treatments. The Visitor Information Centre (i-site)<br />
forms part of the complex as does the Garden House Café.<br />
The complex has undergone a number of renovations over the<br />
last five years the most recent being a $7.5m upgrade designed<br />
primarily to give the pools a summer proposition which are the<br />
busiest tourism months.<br />
the Café, reshaping the information centre and revitalising the<br />
aged hexagonal pools.<br />
The HSTP&S Management Committee plan to put forward a<br />
proposal to develop the Chisholm Ward on the Queen Mary<br />
Historic Hospital Reserve adjacent to the thermal complex.<br />
This will include utilising the methane resource for the project.<br />
Before this can proceed, the proposal will possibly be one of<br />
several projects considered by <strong>Council</strong> and publicly consulted<br />
on before they proceed. There is no funding put aside for this<br />
possible venture and at this stage, is only a concept.<br />
All of these projects are conceptual at this stage and will need<br />
financial feasibility studies done, and then initial approval by the<br />
HSTPS Management Committee before finally being approved<br />
by <strong>Council</strong>.<br />
Funding<br />
The complex now consists of 17 thermal pools and associated<br />
streams, 6 private pools, 2 steam rooms, 2 sauna rooms, a 25<br />
meter freshwater pool with adjoining lazy river, a children’s<br />
activity pool, a children’s aqua play area, a day Spa (The Spa at<br />
Hanmer Springs), a Café (The Garden House Café) and an i-site.<br />
The four business units being the Pools, Spa, Café and Information<br />
Centre have separate financial reporting structures which are<br />
consolidated into a combined profit for HSTPS.<br />
HSTP&S is operated as a profitable business and funds<br />
generated are used to augment the maintenance, development<br />
and promotion of the complex, with surpluses produced being<br />
used to assist funding of other reserves in the district.<br />
We have a dedicated <strong>Council</strong> committee to oversee the running<br />
of the complex called the HSTP&S Management Committee. It<br />
attends to the long term direction and planning of the pools<br />
complex and surrounds. The Committee membership comprises<br />
of some elected members of <strong>Council</strong> and the Hanmer Springs<br />
<strong>Community</strong> Board and external representatives to represent<br />
not only the best interests of the thermal pools, but also the<br />
local Hanmer Springs people.<br />
<strong>Plan</strong>s for the future<br />
In 2011 the HSTP&S Management Committee approved a<br />
long term plan for continued upgrading and investment in the<br />
complex over the next 5 years. To continue to get good returns<br />
from the pool and make sure it is a desirable asset into the<br />
future, the complex needs to maintain or improve its good<br />
condition to maintain its lead in the industry. Therefore, ongoing<br />
planning, including upgrades for the future are essential.<br />
Features of the HSTP&S plan include upgrading the sulphur pools,<br />
improving our changing rooms, developing a long term plan for<br />
Operational Costs:<br />
• 100% usercharge as per the pools fee schedule.<br />
Capital Costs:<br />
• Replacement of existing assets is funded from the<br />
Hanmer Springs Thermal Reserve surpluses.<br />
• Expenditure on new assets are generally funded<br />
through an internal loan according to <strong>Council</strong>’s internal<br />
financing policy.<br />
The Thermal Pools and Spa are funded 100% by user charges<br />
and generate an annual surplus for <strong>Council</strong>. Major capital works<br />
are funded through the Thermal Pools and Spa borrowing from<br />
the <strong>Council</strong> pursuant to the <strong>Council</strong>’s Internal Financing Policy.<br />
The interest rate set at 2.5% above the <strong>Council</strong>’s external<br />
borrowing rate<br />
Minor capital works are funded through the Thermal Pools and<br />
Spa’s retained earnings. The additional interest derived from the<br />
internal financing to the Thermal Pools and Spa ($25,000 per $1<br />
million of borrowings) provides a good return for the <strong>Council</strong><br />
that contributes toward lower rates.<br />
Use of income derived from the Thermal Pools and Spa:<br />
The Thermal Pools and Spa are situated on a Recreation Reserve<br />
which has been vested in the <strong>Council</strong> under the Reserves Act<br />
1977. Pursuant to the Reserves Act, the <strong>Council</strong> is only able<br />
to apply any surpluses derived from the Thermal Reserve to<br />
other reserves administered by the <strong>Council</strong>. The <strong>Council</strong><br />
actively uses these surpluses to fund the costs relating to other<br />
<strong>District</strong> Reserves, Cemeteries, Public Toilets, and as the <strong>District</strong><br />
Library has been built on a Reserve, the costs associated with<br />
137
www.hurunui.govt.nz<br />
the Library function is also subsidised by the surpluses from the<br />
Thermal Reserve.<br />
The pools and spa were expanded and improved in a major<br />
upgrade in 2010. This was funded by way of internal loan<br />
finance, as per <strong>Council</strong>’s Internal Financing Policy. The interest<br />
costs incurred by the Hanmer Springs Thermal Pools and Spa<br />
creates a distinct flow of income that is derived from the use of<br />
the funds that the <strong>Council</strong> is investing, rather than from the use<br />
of the Recreation Reserve.<br />
As a result, we now have two distinct streams of income<br />
generated from the Pools and Spa operation:<br />
• one from internal interest, which the <strong>Council</strong> uses to<br />
offset General Rates (in accordance with the <strong>Council</strong>’s<br />
funding policies)<br />
• and the other being on-going surpluses which are used<br />
to fund costs relating the reserves (as per the provisions<br />
of the Reserve Act 1977).<br />
Assumptions and Risks<br />
It has been conservatively assumed that the HSTP&S complex<br />
will continue to attract national and international visitors, and<br />
continue to rate as a national icon. It is conservatively assumed<br />
that the HSTP&S’s revenue will increase due to predicted<br />
increases in price and some increase in patronage. Profit margins<br />
are based on improvements to the complex being completed<br />
on time. Sales revenue has been forecast conservatively, taking<br />
into account present tourism trends and challenges, and the<br />
projected outlook for the domestic economy, especially in the<br />
immediate years.<br />
The risk to <strong>Council</strong> of borrowing money to fund capital works<br />
for the Thermal Pools and Spa is that, should it not be able<br />
to return the anticipated profit we would be liable for the<br />
debt and would need to pass this on to ratepayers. The risk<br />
is considered low as the Thermal Pools and Spa has performed<br />
consistently and based future predictions of surpluses on very<br />
conservative assumptions, reflecting the on-going impact of the<br />
global economic downturn.<br />
<strong>Council</strong> Owned Assets<br />
Hanmer Springs Thermal Reserve complex which includes:<br />
• 17 thermal pools<br />
• 6 private pools<br />
• 2 steam rooms<br />
• 2 sauna rooms<br />
• 25 meter freshwater pool with adjoining lazy river<br />
• children’s activity pool<br />
• children’s aqua play area<br />
• day Spa<br />
• Café (The Garden House Café)<br />
• i-site<br />
Maintenances and Operating Implications<br />
The HSTP&S is 100% owned by <strong>Council</strong> and this is intended to<br />
continue. The day to day operation of the complex is done by<br />
staff overseen by an appointed manager.<br />
The in house operations team runs the thermal pools complex<br />
including the machinery that operates the pools. The computers<br />
and general IT are maintained and programmed by our council<br />
staff. The pools and plant are maintained to a very high<br />
standard to minimise the risk of failure or poor performance. A<br />
maintenance programme is in place and is budgeted for annually.<br />
This is important in order for us to be competitive with other<br />
leisure activities available to people.<br />
138
<strong>Hurunui</strong> <strong>Community</strong> <strong>Long</strong> <strong>Term</strong> <strong>Plan</strong> <strong>2012</strong> - <strong>2022</strong><br />
Goals and Performance Measures<br />
<strong>Community</strong> Outcomes<br />
• A place with a thriving local economy<br />
• A place where our traditional rural values and heritage make <strong>Hurunui</strong> unique<br />
Goals<br />
Manage and operate the<br />
thermal reserve complex<br />
to attract local, national and<br />
international visitors<br />
Manage the thermal reserve<br />
complex profitably<br />
Maintain the complex so<br />
that it is in good condition<br />
for future generations<br />
Financial Summary<br />
How we will achieve our<br />
Goals<br />
Advertise, market and<br />
promote the complex<br />
Operate the complex to an<br />
approved business plan<br />
Protect the thermal water<br />
to ensure on-going supply<br />
Performance Measures Current Situation 11/12 12/13 13/14 14/15 15+<br />
Customer numbers are<br />
maintained or increased<br />
according to the annual<br />
projections of 3% growth<br />
in customer numbers<br />
The thermal complex<br />
achieves an annual surplus<br />
in line with the annual<br />
budget<br />
Bore water consumption<br />
levels are within the<br />
consent limits at no more<br />
than 47.5 litres per second<br />
Customer growth was over<br />
4% over the year<br />
Cash surplus was $2.76m<br />
which was an increase over<br />
the previous year of $2.29m<br />
We have 2 bores and<br />
consumption averaged 18.72<br />
litres per second which is<br />
within the consent limits<br />
√ √ √ √<br />
√ √ √ √<br />
√ √ √ √<br />
A financial summary for this activity is shown on the next page.<br />
139
www.hurunui.govt.nz<br />
Hanmer Springs Thermal Pools and Spa - Group Activity Financial Summary<br />
Annual <strong>Plan</strong> Year 1 Year 2 Year 3 Year 4 Year 5 Year 6 Year 7 Year 8 Year 9 Year 10<br />
2011/<strong>2012</strong> <strong>2012</strong>/2013 2013/2014 2014/2015 2015/2016 2016/2017 2017/2018 2018/2019 2019/2020 2020/2021 2021/<strong>2022</strong><br />
Operating Statement<br />
Operating Revenue<br />
Other Income 9,632,000 9,572,333 10,003,738 10,304,760 10,923,035 11,257,061 11,591,268 12,283,432 12,655,830 13,044,461 13,840,087<br />
Total Operating Revenue 9,632,000 9,572,333 10,003,738 10,304,760 10,923,035 11,257,061 11,591,268 12,283,432 12,655,830 13,044,461 13,840,087<br />
Operating Expenditure<br />
Employee Benefits 3,511,336 3,651,055 3,812,271 3,928,161 4,052,008 4,184,154 4,303,821 4,426,201 4,565,494 4,717,424 4,870,453<br />
Direct Operating Expenditure 2,906,500 2,984,187 3,137,332 3,232,621 3,334,215 3,442,381 3,541,149 3,642,205 3,756,474 3,880,674 4,005,941<br />
Internal Interest Paid 761,075 936,075 1,027,005 1,073,984 1,146,874 1,146,874 1,146,874 1,146,874 1,146,874 1,146,874 1,146,874<br />
<strong>Council</strong> Overheads Expenditure 127,779 132,290 134,065 136,883 138,120 140,595 142,726 144,911 148,735 150,536 153,527<br />
Depreciation 785,600 836,803 881,131 912,298 847,848 820,237 793,528 804,318 816,524 848,615 860,919<br />
Total Operating Expenditure 8,092,290 8,540,410 8,991,804 9,283,947 9,519,065 9,734,240 9,928,098 10,164,508 10,434,101 10,744,122 11,037,714<br />
Operating Surplus (Deficit) 1,539,710 1,031,923 1,011,933 1,020,813 1,403,970 1,522,821 1,663,170 2,118,924 2,221,729 2,300,339 2,802,373<br />
Capital Statement<br />
Capital Expenditure<br />
Hanmer Springs Thermal Pools & Spa 200,000 2,650,000 1,454,880 644,280 944,095 115,070 119,450 124,290 129,590 135,510 141,740<br />
Total Capital Expenditure 200,000 2,650,000 1,454,880 644,280 944,095 115,070 119,450 124,290 129,590 135,510 141,740<br />
Funds Required<br />
Capital Expenditure 200,000 2,650,000 1,454,880 644,280 944,095 115,070 119,450 124,290 129,590 135,510 141,740<br />
Transfer to Hanmer Springs Thermal Reserve 2,125,310 1,218,726 1,477,384 1,825,731 2,140,748 2,227,988 2,337,248 2,798,952 2,908,663 3,013,444 3,521,552<br />
2,325,310 3,868,726 2,932,264 2,470,011 3,084,843 2,343,058 2,456,698 2,923,242 3,038,253 3,148,954 3,663,292<br />
Funded by<br />
Operating Surplus 1,539,710 1,031,923 1,011,933 1,020,813 1,403,970 1,522,821 1,663,170 2,118,924 2,221,729 2,300,339 2,802,373<br />
Non Cash Expenditure - Depreciation 785,600 836,803 881,131 912,298 847,848 820,237 793,528 804,318 816,524 848,615 860,919<br />
Capital Expenditure funded through Internal Loans 0 2,000,000 1,039,200 536,900 833,025 0 0 0 0 0 0<br />
2,325,310 3,868,726 2,932,264 2,470,011 3,084,843 2,343,058 2,456,698 2,923,242 3,038,253 3,148,954 3,663,292<br />
H:\<strong>Long</strong> <strong>Term</strong> <strong>Plan</strong> Workings\<strong>Hurunui</strong> <strong>District</strong> <strong>Council</strong> LTP Budgets <strong>2012</strong>-<strong>2022</strong> - Post Submissions.xls 31/05/<strong>2012</strong> 9:34 a.m.<br />
140
Governance<br />
Overview<br />
Governance covers the following activity described below:<br />
Activity 1: Governance (democratic services)<br />
Our Aim<br />
To provide support and leadership to the <strong>Hurunui</strong> community<br />
and to ensure that the interests of residents and communities<br />
are advanced by the <strong>Council</strong> taking a role as ‘advocate’ on their<br />
behalf.<br />
Why is the <strong>Council</strong> Involved?<br />
The <strong>Hurunui</strong> <strong>District</strong> <strong>Council</strong> is one of 78 local authorities<br />
throughout New Zealand the roles of which are defined by law.<br />
One of <strong>Council</strong>’s primary roles is to act as an advocate for the<br />
district because it is the only local body that is representative<br />
of all the residents of the <strong>Hurunui</strong>. <strong>Council</strong> is involved in<br />
advocating the interests of residents where proposals from<br />
whichever source are regarded as having a potential effect on<br />
our community.<br />
<strong>Hurunui</strong> <strong>Community</strong> <strong>Long</strong> <strong>Term</strong> <strong>Plan</strong> <strong>2012</strong> - <strong>2022</strong><br />
Significant Negative Effects<br />
The Governance activity does not pose any significant negative<br />
effects.<br />
Emergency Management<br />
In an emergency, particularly a civil defence emergency, we will<br />
continue to deliver services as long as it is safe and practical to<br />
continue to do so. Civil defence management plans provide<br />
the <strong>Council</strong> with guidance and contingencies. However, in an<br />
extreme emergency, this service may not be considered to be<br />
essential.<br />
Financial Summary<br />
A financial summary for this group of activities is shown at the<br />
end of the <strong>District</strong> Promotion activity.<br />
<strong>Community</strong> Outcomes<br />
The <strong>Community</strong> Services and Facilities described in this section,<br />
primarily contribute to one of our community outcomes:<br />
1. A desirable and safe place to live:<br />
• We have attractive well designed townships<br />
• Communities have access to adequate health and<br />
emergency services and systems and resources are<br />
available to meet civil defence emergencies<br />
• Risks to public health are identified and appropriately<br />
managed<br />
Major Projects <strong>Plan</strong>ned<br />
Year <strong>Plan</strong>ned<br />
Project<br />
<strong>2012</strong>/13 2013/14 2014/15 2015+<br />
Representation review √ √<br />
Triennial election √ √<br />
141
www.hurunui.govt.nz<br />
Activity 1: Governance<br />
Overview<br />
The Governance activity includes the various functions of<br />
running a local authority around democratic services.<br />
Current Situation<br />
The governance function is the democratic decision making<br />
process and includes the overall management of the <strong>Council</strong>,<br />
implementation of <strong>Council</strong> policy, support to elected members,<br />
representation and decision making at a political level and<br />
<strong>Council</strong> leadership. One of our primary roles is to act as an<br />
advocate for the district because it is the only local body that<br />
is representative of all the residents of the <strong>Hurunui</strong>. We are<br />
involved in advocating the interests of residents where proposals<br />
from whichever source are regarded as having a potential effect<br />
on our community. We monitor central government initiatives<br />
that may impact upon our residents or communities. We also<br />
have a key responsibility to raise the community’s awareness of<br />
major <strong>Council</strong> proposals, and where people may be significantly<br />
affected.<br />
Our <strong>Council</strong> comprises of the Mayor (elected at large) and<br />
nine <strong>Council</strong>lors elected on a ward basis. The Mayor and<br />
the <strong>Council</strong>lors have the role of setting the policy direction<br />
and monitoring the performance of the <strong>Council</strong>. We have an<br />
extensive <strong>Council</strong> committee structure involving <strong>Council</strong>lors<br />
and independent members across the <strong>District</strong>. Among<br />
these committees, the Hanmer Springs Ward has an elected<br />
<strong>Community</strong> Board. The Amberley and Cheviot Wards are<br />
served by Ward Committees, whereas the Amuri – <strong>Hurunui</strong><br />
Ward, has two community committees (one in Amuri and the<br />
other in <strong>Hurunui</strong>).<br />
It is <strong>Council</strong>’s responsibility to employ a Chief Executive<br />
Officer (CEO) who in turn, is responsible for staff and the<br />
implementation and management of <strong>Council</strong>’s policies and<br />
objectives. The CEO, Andrew Dalziel was appointed in late 2007<br />
with a five year contract. The CEO is the employer of all the<br />
<strong>Council</strong> staff.<br />
The CEO and his management team work with elected<br />
members in setting the <strong>District</strong>’s direction and then shape and<br />
lead the organisation to deliver on the agreed direction. The<br />
organisational purpose is ‘making the <strong>District</strong> even better!’<br />
Personal staff values are to act with commitment, competence,<br />
confidence, and integrity and have respect for both other’s<br />
opinions and importantly the democratic process. Organisational<br />
values are to deliver, take responsibility, work together, embrace<br />
fresh thinking, aim high and be an employer of choice.<br />
The CEO and <strong>Council</strong> are committed to being a High<br />
Performance Organisation. Items of work that are required to<br />
be undertaken to achieve improved performance are provided<br />
around six characteristics of a High Performance Organisation:<br />
being clear about our vision; providing high quality advice;<br />
providing best value; having a service ethic; being adaptive,<br />
flexible and agile and managing risks.<br />
We have undertaken an annual residents’ satisfaction survey<br />
since 2007 to measure customer satisfaction over a wide range<br />
of our services. In general terms, there has been a continual<br />
increase in overall resident satisfaction with the <strong>Council</strong>’s<br />
performance during that time. Residents’ perception of our<br />
overall performance in 2011 has improved and now sits at 87%.<br />
Satisfaction with the Mayor and <strong>Council</strong>lor’s performance is<br />
76%. Satisfaction with the service received at <strong>Council</strong> offices<br />
was 79%.<br />
<strong>Plan</strong>s for the future<br />
We will continue to review our performance for all areas of<br />
<strong>Council</strong> – mayor, elected members, CEO, staff and the delivery<br />
of our services which includes contractor performance. The<br />
residents’ satisfaction survey provides us with good quality<br />
feedback on a range of services and issues and helps us improve<br />
and adjust to the <strong>District</strong>’s changing needs. The results of the<br />
survey are available to members of the public and can be located<br />
on our website – www.hurunui.govt.nz<br />
We will continue to advocate on behalf of our people as issues<br />
come up. Often issues that arise cannot be planned for as they<br />
are usually beyond our control and often arise from plans that<br />
other organisations and government agencies implement. At<br />
times we receive invitations to submit to proposals such as<br />
legislation changes or from neighbouring <strong>Council</strong>s.<br />
Local government elections are undertaken every 3 years. The<br />
next election is in October 2013 and preparation will commence<br />
early that year. We are responsible for conducting the election<br />
process for the two liquor licensing trusts in the district (Cheviot<br />
and Hawarden), and for some of the election processes for the<br />
Canterbury <strong>District</strong> Health Board and the Canterbury Regional<br />
<strong>Council</strong>. The elections are held at the same time. An electoral<br />
officer must be appointed by <strong>Council</strong> to manage the elections.<br />
We have contracted an election specialist to conduct the past<br />
three elections. This has proven to be the most cost efficient<br />
and effective method for us and has caused the least disruption<br />
to our ‘business as usual’ services. We are likely to continue to<br />
contract an external provider for the future triennial elections.<br />
We are required to review our ‘representation’ arrangements at<br />
least once every 6 years. This means that we must review the:<br />
• number of <strong>Council</strong>lors it has in the district<br />
• number of wards in the district, or whether to simply<br />
have a district with no wards<br />
• ward boundaries and names of wards<br />
• number and location of community boards<br />
142
<strong>Hurunui</strong> <strong>Community</strong> <strong>Long</strong> <strong>Term</strong> <strong>Plan</strong> <strong>2012</strong> - <strong>2022</strong><br />
New Zealand law requires all councils to regularly and properly<br />
review their electoral arrangements to ensure that the district’s<br />
people are fairly and properly represented by elected members.<br />
We are now in the process of doing this review so that it is<br />
completed in time for the 2013 elections. It is important to<br />
involve the community to get the best result for those who live<br />
in the <strong>District</strong>. Public consultation will occur separately to this<br />
<strong>Plan</strong> on any proposals for representation that we arrive at.<br />
The Local Government Act places limitations on the length of<br />
time <strong>Council</strong> can run a contract with its CEO before advertising<br />
the position again. In <strong>2012</strong>, <strong>Council</strong> will be required to either<br />
reappoint the CEO for a further 2 years, or to advertise the<br />
vacancy. At the latest, if the position was extended for 2 years<br />
the <strong>Council</strong> must advertise the CEO vacancy by 2014 (the<br />
maximum extension before advertising). The cost of recruiting<br />
a CEO has been factored into this plan every 5 years at $50,000.,<br />
each year that the contract expires.<br />
Operational Costs:<br />
government structure and radical change can occur as a<br />
result. The last major restructure of local government was in<br />
1989 and the <strong>Hurunui</strong> <strong>District</strong> <strong>Council</strong> was formed then. The<br />
consequences of future local government reform are as yet<br />
unknown; the risks are yet to be identified.<br />
Canterbury Regional <strong>Council</strong> has been governed through<br />
Government selected Commissioners. Their recommendation<br />
for a future regional council model for Canterbury is not yet<br />
known. The final decision is likely to have some sort of impact<br />
on the <strong>Hurunui</strong> <strong>District</strong>.<br />
Shared Services<br />
We collect rates on behalf of the Canterbury Regional <strong>Council</strong><br />
and in return, they pay us a fee and a portion of the rating<br />
valuation cost. The income received is used to offset the cost of<br />
running our rates department.<br />
Funding<br />
• Funding is a 50% <strong>District</strong> Rate on Capital Value and 50%<br />
<strong>District</strong> Uniform Annual Charge.<br />
• Canterbury Regional <strong>Council</strong> contributes half the cost<br />
of the remuneration for the members of the <strong>Hurunui</strong><br />
Waiau Zone Committee.<br />
Capital Costs:<br />
• Any capital expenditure relating to Governance is<br />
funded over the life of the asset through a <strong>District</strong> Rate.<br />
• Not applicable.<br />
<strong>Council</strong> Owned Assets<br />
We perform a governance and advocacy role and there are no<br />
Maintenances and Operating Implications<br />
foreseeable plans to change this. Changes to legislation can<br />
occur at any stage and often impacts on the running of the<br />
<strong>Council</strong> in some way – through policy or bylaw implementation.<br />
<strong>Council</strong> manages its governance functions in house in the main,<br />
but contracts election specialists to run our triennial elections.<br />
It is assumed that the <strong>Hurunui</strong> <strong>District</strong> <strong>Council</strong> will continue<br />
Assumptions and Risks<br />
to exist for the life of this plan. It is also assumed that the<br />
<strong>Council</strong> will remain relatively stable and that no by-elections will<br />
be necessary in between the triennial years.<br />
From time to time, the government does review the local<br />
143
www.hurunui.govt.nz<br />
Goals and Performance Measures<br />
<strong>Community</strong> Outcomes<br />
• A desirable and safe place to live<br />
Goals<br />
Represent the<br />
interests of the<br />
<strong>Hurunui</strong> <strong>District</strong><br />
communities<br />
How we will achieve<br />
our Goals<br />
Ensure our representation<br />
arrangements are fair and<br />
effective<br />
Encourage people to stand<br />
for local government<br />
Undertake regular residents<br />
satisfaction survey<br />
Performance Measures<br />
The districts representtation<br />
arrangement will be reviewed<br />
within the statutory deadlines<br />
Nominations for each Ward<br />
at least equal the number of<br />
vacancies for each triennial<br />
election<br />
Residents satisfaction with<br />
the overall performance of<br />
the <strong>Council</strong> is maintained or<br />
improved<br />
Current Situation<br />
11/12<br />
A review is underway to be<br />
finalised in time for the 2013 &<br />
2019 triennial elections<br />
In the 2010 election, there were<br />
enough candidates for each<br />
Ward<br />
Satisfaction has been increasing<br />
since 2007 when surveying<br />
commenced and was 87% in<br />
2011<br />
12/13 13/14 14/15 15+<br />
√<br />
√<br />
√<br />
√<br />
√ √<br />
Financial Summary<br />
A financial summary for this activity is shown on the next page.<br />
144
Governance - Group Activity Financial Summary<br />
Annual <strong>Plan</strong> Year 1 Year 2 Year 3 Year 4 Year 5 Year 6 Year 7 Year 8 Year 9 Year 10<br />
2011/<strong>2012</strong> <strong>2012</strong>/2013 2013/2014 2014/2015 2015/2016 2016/2017 2017/2018 2018/2019 2019/2020 2020/2021 2021/<strong>2022</strong><br />
Operating Statement<br />
Operating Revenue<br />
<strong>District</strong> Wide Rates 882,226 990,808 1,052,416 1,158,327 1,096,127 1,185,876 1,245,476 1,204,608 1,309,957 1,374,284 1,336,060<br />
Other Income 28,000 16,000 16,501 17,003 17,542 18,120 18,635 19,162 19,768 20,434 21,102<br />
Total Operating Revenue 910,226 1,006,808 1,068,917 1,175,331 1,113,669 1,203,996 1,264,111 1,223,770 1,329,725 1,394,718 1,357,162<br />
Operating Expenditure<br />
Employee Benefits 362,270 446,554 460,531 474,553 489,601 505,722 520,101 534,793 551,717 570,294 588,960<br />
Direct Operating Expenditure 281,936 229,600 262,569 313,071 251,733 310,985 343,121 274,969 314,558 376,234 302,819<br />
<strong>Council</strong> Overheads Expenditure 266,020 324,654 336,353 378,243 362,870 377,454 391,054 404,173 453,130 437,871 455,064<br />
Depreciation 0 6,000 9,464 9,464 9,464 9,836 9,836 9,836 10,320 10,320 10,320<br />
Total Operating Expenditure 910,226 1,006,808 1,068,917 1,175,331 1,113,669 1,203,996 1,264,111 1,223,770 1,329,725 1,394,718 1,357,162<br />
Operating Surplus (Deficit) 0 0 0 0 0 0 0 0 0 0 0<br />
Capital Statement<br />
Capital Expenditure<br />
Governance 0 0 36,372 0 0 40,275 0 0 45,357 0 0<br />
Total Capital Expenditure 0 0 36,372 0 0 40,275 0 0 45,357 0 0<br />
Funds Required<br />
Capital Expenditure 0 0 36,372 0 0 40,275 0 0 45,357 0 0<br />
Transfer to General <strong>Council</strong> Reserves 0 6,000 9,464 9,464 9,464 9,836 9,836 9,836 10,320 10,320 10,320<br />
0 6,000 45,836 9,464 9,464 50,110 9,836 9,836 55,676 10,320 10,320<br />
Funded by<br />
Non Cash Expenditure - Depreciation 0 6,000 9,464 9,464 9,464 9,836 9,836 9,836 10,320 10,320 10,320<br />
General <strong>Council</strong> Reserves 0 0 36,372 0 0 40,275 0 0 45,357 0 0<br />
0 6,000 45,836 9,464 9,464 50,110 9,836 9,836 55,676 10,320 10,320<br />
<strong>Hurunui</strong> <strong>Community</strong> <strong>Long</strong> <strong>Term</strong> <strong>Plan</strong> <strong>2012</strong> - <strong>2022</strong><br />
H:\<strong>Long</strong> <strong>Term</strong> <strong>Plan</strong> Workings\<strong>Hurunui</strong> <strong>District</strong> <strong>Council</strong> LTP Budgets <strong>2012</strong>-<strong>2022</strong> - Post Submissions.xls 31/05/<strong>2012</strong> 9:34 a.m.<br />
145
www.hurunui.govt.nz<br />
Financial Overview<br />
146 Financial Introduction<br />
148 Forecasting Assumptions<br />
153 Statement of Accounting Policies<br />
171 Funding Impact Statement (and Rates<br />
System)<br />
182 Rates System<br />
193 Reserve Funds<br />
198 <strong>Council</strong> Controlled Organisations<br />
146
Financial Introduction<br />
Purpose of the <strong>Long</strong> <strong>Term</strong> <strong>Plan</strong><br />
The long term plan has been prepared in accordance with<br />
Section 93 of the Local Government Act 2002. The Act states<br />
that the purpose of the long term plan is to:<br />
• Describe the activities of the <strong>Council</strong>; and<br />
• Describe the community outcomes of the <strong>District</strong>; and<br />
• Provide integrated decision-making and co-ordination<br />
of the resources of the <strong>Council</strong>; and<br />
• Provide a long term focus for the decisions and activities<br />
of the <strong>Council</strong>; and<br />
• Provide a basis for accountability of the <strong>Council</strong> to the<br />
community; and<br />
• Provide an opportunity for participation by the public<br />
in decision-making processes on activities to be<br />
undertaken by the <strong>Council</strong>.<br />
Further requirements under the Act are to:<br />
• Use the special consultative procedure in adopting the<br />
long term plan.<br />
• The long term plan must cover a period of not less than<br />
10 consecutive financial years<br />
• The long term plan must be adopted before the<br />
commencement of the first year and continue to be in<br />
force until the close of the third consecutive year.<br />
Cautionary Note<br />
<strong>Hurunui</strong> <strong>Community</strong> <strong>Long</strong> <strong>Term</strong> <strong>Plan</strong> <strong>2012</strong> - <strong>2022</strong><br />
The long term plan is based on assumptions and budgets for the<br />
entire 10 year period and as such it is important to note that<br />
actual results achieved for the period are likely to vary from the<br />
information provided in the <strong>Plan</strong> and that the likely variations<br />
may be material.<br />
The long term plan has been prepared for the purposes<br />
described earlier and the information may not be appropriate<br />
for purposes other than those described.<br />
Statement of Responsibility<br />
The forecast financial statements are prepared on the basis<br />
of best-estimate assumptions as to future events which the<br />
<strong>Council</strong> expects to take place as of 28 June <strong>2012</strong>.<br />
Authorisation for issue<br />
This document was authorised for issue by <strong>Council</strong> on, as is<br />
dated, 28 June <strong>2012</strong>.<br />
Comparative Information<br />
The 2011/<strong>2012</strong> comparative information is based on the<br />
2011/<strong>2012</strong> Annual <strong>Plan</strong>. The comparative numbers in the activity<br />
sections have been adjusted to reflect the changed structure to<br />
the activities from how they were structured in the Annual <strong>Plan</strong>,<br />
for instance, Footpath Construction was previously disclosed<br />
as part of Township Maintenance in the <strong>Community</strong> Services<br />
and Facilities. Due to a change in the legislation, Footpath<br />
Construction now forms part of the Roads and Footpaths<br />
Group of Activities.<br />
147
www.hurunui.govt.nz<br />
Forecasting Assumptions<br />
1. Inflation<br />
In preparing the LTP, the <strong>Council</strong> is required to use best<br />
estimates in determining the level of costs to be budgeted in<br />
the future. As a result, the <strong>Council</strong> is required to account for<br />
the effect of price changes or inflation that is expected to occur<br />
over the ten year period.<br />
To develop a consistent approach for local government to<br />
account for inflation, the Society of Local Government Managers<br />
(SOLGM) contracted Business and Economic Research Limited<br />
(BERL) to construct forecasts for inflation.<br />
The <strong>Hurunui</strong> <strong>District</strong> <strong>Council</strong> has endorsed the Local<br />
Government Cost Index (LGCI) rates produced by BERL and<br />
have used these rates as the assumption for accounting for<br />
inflation in the preparation of the LTP. In applying the rates, the<br />
<strong>Council</strong> has adopted the split between Operating Expenditure<br />
(Opex) and Capital Expenditure (Capex) as allowed for in<br />
BERL’s analysis.<br />
Rates used:<br />
Year<br />
Ending<br />
LGCI<br />
Index<br />
value<br />
Rate<br />
OPEX<br />
Index<br />
Value<br />
Rate<br />
CAPEX<br />
Index<br />
value<br />
June 2013 1269 1245 1301<br />
Rate<br />
June 2014 1313 3.47% 1284 3.13% 1352 3.92%<br />
June 2015 1355 3.20% 1323 3.04% 1397 3.33%<br />
June 2016 1399 3.25% 1365 3.17% 1445 3.44%<br />
June 2017 1447 3.43% 1410 3.30% 1497 3.60%<br />
June 2018 1494 3.25% 1450 2.84% 1554 3.81%<br />
June 2019 1545 3.41% 1491 2.83% 1617 4.05%<br />
June 2020 1602 3.69% 1538 3.15% 1686 4.27%<br />
June 2021 1664 3.87% 1590 3.38% 1763 4.57%<br />
June <strong>2022</strong> 1729 3.91% 1642 3.27% 1844 4.59%<br />
In applying the inflation rates in the preparation of the budgets,<br />
the <strong>Council</strong> has set a budget based in <strong>2012</strong>/2013 dollars for<br />
each of the ten years of the LTP. For each of the succeeding<br />
years of the LTP, the following cumulative inflation rates have<br />
been applied to each applicable cost or income.<br />
Cumulative Inflation Rates:<br />
Year<br />
Ending<br />
LGCI<br />
Index<br />
value<br />
Rate<br />
OPEX<br />
Index<br />
Value<br />
Rate<br />
CAPEX<br />
Index<br />
value<br />
June 2013 1269 1245 1301<br />
Rate<br />
June 2014 1313 3.47% 1284 3.13% 1352 3.92%<br />
June 2015 1355 6.78% 1323 6.27% 1397 7.38%<br />
June 2016 1399 10.24% 1365 9.64% 1445 11.07%<br />
June 2017 1447 14.03% 1410 13.25% 1497 15.07%<br />
June 2018 1494 17.73% 1450 16.47% 1554 19.45%<br />
June 2019 1545 21.75% 1491 19.76% 1617 24.29%<br />
June 2020 1602 26.24% 1538 23.53% 1686 29.59%<br />
June 2021 1664 31.13% 1590 27.71% 1763 35.51%<br />
June <strong>2022</strong> 1729 36.25% 1642 31.89% 1844 41.74%<br />
For the Hanmer Springs Thermal Pools and Spa, it is predicted<br />
that an inflation adjustment to the entry price will be made in<br />
2015, 2018 and 2021. The increases in revenue in the intervening<br />
years are the result of an increase in the customer numbers,<br />
which is discussed further in the assumption for Projected<br />
Growth Change Factors.<br />
Risks and Uncertainties<br />
Inflation in some areas may increase at a rate different to that<br />
forecast. Some types of costs (e.g. Roading and Transport Costs)<br />
have been subject to wild fluctuations in recent years, and as a<br />
result, it is inherently difficult to predict trends with accuracy.<br />
In respect to the cost of insurance premiums, the budgets set<br />
for the <strong>2012</strong>/2013 were based on the actual costs incurred by<br />
<strong>Council</strong> for the 2011/<strong>2012</strong> year. As the insurance market has<br />
been undergoing change over the period since the Canterbury<br />
earthquakes, there is potential for the costs of insurance to<br />
move at different levels than assumed by utilising the BERL<br />
LGCI rates.<br />
Rating of Uncertainty: Medium<br />
2. Interest rates<br />
The movement of interest rates has a wide ranging effect on the<br />
<strong>Council</strong>. The <strong>Council</strong>’s cash investments derive interest at the<br />
market rates; the <strong>Council</strong> is vulnerable to the lending rates for<br />
148
<strong>Hurunui</strong> <strong>Community</strong> <strong>Long</strong> <strong>Term</strong> <strong>Plan</strong> <strong>2012</strong> - <strong>2022</strong><br />
its external borrowing requirements; and the <strong>Council</strong>’s internal<br />
financing policy bases the interest paid or charged to individual<br />
communities on those applicable rates.<br />
As part of the <strong>Council</strong>’s Treasury Risk Management policy, the<br />
<strong>Council</strong> has entered into a range of interest rate swaps designed<br />
to set a fixed portion to the interest rates charged over a period<br />
of time. Based on this information and advice from the <strong>Council</strong>’s<br />
Treasury advisers:<br />
• <strong>Council</strong> will receive an average of 3.5% on its limited<br />
cash investments.<br />
• <strong>Council</strong> will be charged an average rate of interest on<br />
its external borrowings at 6.25%.<br />
• Communities that hold internal loans with <strong>Council</strong> will<br />
be charged interest at 7.25% (100 basis points over<br />
the level of interest <strong>Council</strong> is charged for external<br />
borrowings).<br />
• Communities that have built up reserves for future<br />
capital expenditure will be credited interest at 3.5%<br />
(the same level the <strong>Council</strong> is expected to receive from<br />
its cash investments)<br />
• Any internal loans to the Hanmer Springs Thermal<br />
Reserve will be charged an interest rate of 8.75%<br />
(250 basis points above the level of interest <strong>Council</strong> is<br />
charged for external borrowings)<br />
Risks and Uncertainties<br />
The <strong>Council</strong> is exposed to the market with respect to interest<br />
rates and as such, the rates will be subject to adjustment over<br />
the period of the long term plan. Pursuant to its Treasury Risk<br />
Management Policy on page 264, the <strong>Council</strong> has entered into<br />
a series of interest rate swaps which is aimed at minimising the<br />
exposures to changes in the short term interest rates. Where<br />
the <strong>Council</strong>’s overall external interest rates do change, the<br />
change will be reflected in the level of interest charged or paid<br />
to the relevant communities as well as being reflected in the<br />
level of interest the <strong>Council</strong> receives on its cash investments or<br />
charged on its external borrowings.<br />
For the <strong>2012</strong>/2013 year, it is forecast that external interest paid<br />
will be $921,875. Should there be a 1% increase the external<br />
borrowing costs – a move from 6.25% to 7.25%, the resulting<br />
external interest expense will increase to $1,069,375.<br />
Rating of Uncertainty: Medium<br />
3. Assets Vested in <strong>Council</strong><br />
When a developer carries out a subdivision, they are required<br />
to vest various assets to <strong>Council</strong>.<br />
These assets include any new roads, water mains, sewer mains,<br />
footpaths and landscaped areas. The <strong>Council</strong> is then responsible<br />
for the maintenance and future replacement of those assets.<br />
To determine the value of the assets to be vested, the <strong>Council</strong><br />
made assumptions based on an analysis of the costs of recent<br />
subdivisions in the <strong>District</strong>. The average costs were assumed as<br />
follows:<br />
• Roading (incl. Footpaths) $7,000 per section<br />
• Sewer $1,500 per section<br />
• Water $1,500 per section<br />
These amounts will be applicable to all urban areas and the<br />
amounts will be multiplied by the numbers of urban sections<br />
created in each year to arrive at the total assets to be added to<br />
the <strong>Council</strong>’s asset register. The number of new urban sections<br />
projected to be created is allowed for in the assumption for<br />
Projected Growth Change factors. This will also be inflationadjusted<br />
each year according to the BERL inflation forecasts<br />
as described in the assumption for inflation. Each addition<br />
to the asset register will be depreciated by any appropriate<br />
depreciation charge. Please note that no vested assets will be<br />
applied to rural sections.<br />
To balance the books, the introduction of the asset value needs to<br />
be reflected in income, therefore, there will be a corresponding<br />
income line called “Vested Assets Income”.<br />
Risks and Uncertainties<br />
The assumption has based the level of assets vested to <strong>Council</strong><br />
on an analysis of recent major subdivisions carried out in the<br />
<strong>District</strong>. Some subdivisions may not result in any further assets<br />
to be vested in the <strong>Council</strong> as there has already been adequate<br />
capacity provided for the new sections and some subdivisions<br />
may have a greater amount of assets vested into <strong>Council</strong> as<br />
there may be a greater per property costs associated with the<br />
subdivision.<br />
Rating of Uncertainty: Low<br />
4. Depreciation Rates of Assets<br />
The same depreciation rates as for all significant assets have<br />
been assumed for planned asset acquisitions. These depreciation<br />
rates are as given in the Statement of Accounting Policies.<br />
Risks and Uncertainties<br />
The useful lives are based on historical information. Some assets<br />
may last longer than the life stated above because of differing<br />
factors and conversely, some assets may deteriorate at a faster<br />
rate than the lives stated above.<br />
Rating of Uncertainty: Low<br />
149
www.hurunui.govt.nz<br />
5. Emissions Trading Scheme<br />
The Emissions Trading Scheme (ETS) is in place; however, there<br />
is still limited detail on how its implementation will affect costs<br />
moving forward. The price change adjustors as provided by<br />
BERL have made some allowance for the effects of the ETS<br />
and the <strong>Council</strong> has applied those rates in accordance with its<br />
assumption on inflation.<br />
The <strong>Council</strong> has registered its Forestry Assets under the ETS<br />
and it should qualify for carbon credits. These carbon credits<br />
will have a value, however, as it is in its initial stage, there is no<br />
details to assess the effect of this value and as a result, it has not<br />
been accounted for in the preparation of the LTP.<br />
Risks and Uncertainties<br />
There is an inherent risk that the inflation rates used in the<br />
preparation of the LTP may not reflect the actual costs. Should<br />
the resulting costs from the implementation of the ETS be<br />
greater than the levels of inflation that have been allowed for,<br />
then the <strong>Council</strong> will need to increase the funding from rates<br />
and other income to allow for it.<br />
As the <strong>Council</strong> has not accounted for the value of the carbon<br />
credits in the preparation of the LTP, any potential value that is<br />
assigned to the credits, or any proceeds from the potential sale<br />
of any carbon credits will be credited to the Forestry Reserve,<br />
which can be utilised in a manner determined appropriate by<br />
the <strong>Council</strong>.<br />
Rating of Uncertainty: Medium<br />
6. Unknown/Unconformed Legislation<br />
or Policy<br />
Due to the recent change of Government, the level of uncertainty<br />
in this area is too high for any changes to be sufficiently<br />
quantifiable to be taken into account for the present plan. The<br />
<strong>Council</strong> remains aware of the key issues on a qualitative level,<br />
and will take them into account as best they are able.<br />
Rating of Uncertainty: High<br />
7. NZTA Subsidy Rates<br />
To fund roading operational and capital expenditure, the <strong>Council</strong><br />
receives a percentage of the cost as a subsidy from the New<br />
Zealand Transport Agency (NZTA). The subsidy rate is based<br />
on a calculation performed nationally which takes into account<br />
the land value of each <strong>District</strong> <strong>Council</strong> area. For the <strong>2012</strong>/2013<br />
financial year, the subsidy rates are as follows:<br />
• Operating Expenditure 50%<br />
• Capital Expenditure 50%<br />
• Minor Safety Improvements 60%<br />
• Level Crossing Warnings 100%<br />
• Special Purpose Roading 100%<br />
There has been no indication that any of these rates are expected<br />
to change in the next three years, therefore the <strong>Council</strong> has<br />
made the assumption that subsidy rates are to remain constant<br />
over the life of the LTP. Based on NZTA’s indicative costs for<br />
<strong>2012</strong>-2015, we have assumed that the level of funding we will be<br />
allocated will continue over the remaining life of the <strong>Plan</strong>.<br />
Risks and Uncertainties<br />
The NZTA subsidy rates are based on a calculation which<br />
takes into account the land value of the <strong>Hurunui</strong> <strong>District</strong> as a<br />
comparison with other local authorities throughout the country.<br />
Should the land value of the <strong>Hurunui</strong> increase or decrease at a<br />
rate different to the average over the country, the calculation<br />
may result in the subsidy rate for the <strong>Hurunui</strong> increasing or<br />
decreasing.<br />
Should the subsidy rates decrease from the levels assumed, it will<br />
result in the amount of subsidy for roading works to decrease<br />
and placing a greater burden for funding the operational and<br />
capital expenditure of the roading network on the ratepayers.<br />
As an example, if each category of subsidy reduced by 10%<br />
(resulting in the subsidy rates Operating & Capital Expenditure<br />
to 40%; Minor Safety Improvements to 50% and Level Crossing<br />
Warnings and Special purpose Roading to 90%), for the<br />
<strong>2012</strong>/2013 year, based on the budgeted level of expenditure, the<br />
roading rate would need to increase by $624,803.<br />
Rating of Uncertainty: High<br />
8. Projected Growth Change Factors<br />
See the Development Contributions Policy for details of<br />
projected growth in the numbers of new properties in the<br />
district. The effects of the growth will be factored in when<br />
determining:<br />
• The level of development contributions which will flow<br />
through the organisation<br />
• The level of vested assets that the <strong>Council</strong> is expected<br />
to take ownership of<br />
For growth in the customer numbers at the Hanmer Springs<br />
Thermal Pools and Spa, the <strong>Council</strong> has assumed that the<br />
increase in customer numbers will be 3% each year over the life<br />
of the <strong>Long</strong> <strong>Term</strong> <strong>Plan</strong>. The resulting revenue is supplemented by<br />
a predicted increase to the standard entry price which provides<br />
a further increase of 4.5% in 2015, 2018 and 2021.<br />
150
<strong>Hurunui</strong> <strong>Community</strong> <strong>Long</strong> <strong>Term</strong> <strong>Plan</strong> <strong>2012</strong> - <strong>2022</strong><br />
Risks and Uncertainties<br />
The projected growth in the number of new sections may occur<br />
at rates significantly different to those predicted, which will<br />
result in the amounts received in Development Contributions<br />
and Vested Assets will differ from the figures budgeted for.<br />
The result may be that the period for collecting development<br />
contributions for specific growth related projects may reduce<br />
or be extended.<br />
If the movement in customer numbers at the Hanmer Springs<br />
Thermal Pools and Spa differs from the level assumed, it will<br />
have an effect on the revenue flows for the Pools. The <strong>Council</strong><br />
intends on funding a certain level of the other reserve costs<br />
from surpluses from the Pools. After doing so, there is still a<br />
level of surpluses that are retained on an annual basis. If the<br />
growth in the customer numbers from the Pools is lower than<br />
the level projected, then the level of surpluses retained will<br />
reduce. Depending on the extent of any change to the growth<br />
in customer numbers, this may have an effect on the funds that<br />
are used to directly offset the various reserve costs throughout<br />
the <strong>District</strong>.<br />
Rating of Uncertainty: Medium<br />
9. Resource Consents<br />
It has been assumed that all current resource consents held by<br />
<strong>Council</strong> will be renewed at the appropriate time, with similar<br />
conditions and length of term as currently in place. Any costs<br />
associated with Capital Expenditure forecast throughout the<br />
ten year period have been included as an integral part of the<br />
cost of the asset and will be capitalised and depreciated in line<br />
with the physical works carried out.<br />
Risks and Uncertainties<br />
There is a risk that various resource consents held by the<br />
<strong>Council</strong> may not be renewed, or the conditions and term of<br />
the resource consent may vary from those currently in place.<br />
In addition, there is a risk that renewing resource consent may<br />
incur additional costs that have not currently been budgeted for.<br />
Rating of Uncertainty: Medium<br />
10. Revaluation of Assets<br />
The <strong>Council</strong> has adopted an approach of revaluing its land<br />
and buildings, roading and infrastructural assets on a three<br />
yearly basis to comply with the New Zealand equivalent to<br />
International Financial Reporting Standards.<br />
The valuation process is staggered so only one key asset class is<br />
revalued each year and as a result, the revaluation cycle over the<br />
period of the LTP will be as follows:<br />
Land and Buildings 30 June 2011 (most recent revaluation)<br />
30 June 2014<br />
30 June 2017<br />
30 June 2020<br />
Infrastructural Assets 30 June 2009 (most recent revaluation)<br />
30 June <strong>2012</strong><br />
(based on inflation indices for the<br />
prior 3 years)<br />
30 June 2015<br />
30 June 2018<br />
30 June 2021<br />
Roading Assets 30 June 2010 (most recent revaluation)<br />
30 June 2013<br />
30 June 2016<br />
30 June 2019<br />
30 June <strong>2022</strong><br />
As was the case for the preparation of the 2009 LTCCP, the<br />
<strong>Council</strong> has made the assumption that the value of Land will not<br />
change over the ten year period, with the exemption of proposed<br />
purchase of land required to extend the area of cemeteries. The<br />
<strong>Council</strong> has also assumed that the value of Buildings will change<br />
only in accordance to the amount of depreciation charged.<br />
The <strong>Council</strong> has made the assumption that the book values of the<br />
buildings, roading and infrastructural assets as at the revaluation<br />
dates will be increased by the cumulative inflation rates as per<br />
the BERL inflation forecasts as described in the assumption for<br />
inflation. The depreciation charge will be amended to reflect the<br />
remaining useful life of each asset and the charge made on the<br />
revalued amount of the asset.<br />
An example of how the cumulative inflation will be applied is<br />
as follows:<br />
• A length of water pipe may have a value of $1,000 as of<br />
30 June <strong>2012</strong> - the date of its last revaluation.<br />
• The next revaluation is set for 30 June 2015, and the<br />
cumulative inflation rate for Capital Expenditure over<br />
that period is 11.94%, therefore the new value should<br />
be $1,119.<br />
• The next revaluation is set for 30 June 2018, and the<br />
cumulative inflation rate for Capital Expenditure over<br />
that period is 24.52%, therefore the new value should<br />
be $1,245.<br />
• The next revaluation is set for 30 June 2021, and the<br />
cumulative inflation rate for Capital Expenditure over<br />
that period is 41.27%, therefore the new value should<br />
be $1,413.<br />
Any movement in the valuation of the roading and infrastructural<br />
assets is recognised in the asset revaluation reserve. The<br />
movements, along with any increase on capital purchases made<br />
in the intervening years have been applied to the existing values<br />
to arrive at the revalued amount for each asset.<br />
151
www.hurunui.govt.nz<br />
Risks and Uncertainties<br />
12. Useful Lives of Significant Assets<br />
Inflation in some areas may increase at a rate different to that<br />
forecast. Some types of costs (e.g. Roading and Transport Costs)<br />
have been subject to wild fluctuations in recent years, and as a<br />
result, it is inherently difficult to predict trends with accuracy.<br />
Rating of Uncertainty: Medium<br />
11. Funding Replacement of<br />
Significant Assets<br />
Capital Expenditure is funded by two key mechanisms:<br />
• General Reserve funding for those assets whose<br />
depreciation is funded via rates; and<br />
• Internal Financing for most other assets as set out in<br />
the Internal Financing Policy, which forms part of the<br />
<strong>Council</strong>’s Treasury Policy.<br />
General Reserve Funding<br />
A number of assets, principally those that are funded by the<br />
General Rate or a part of the Overhead component, are<br />
depreciated with the amount of depreciation being funded by<br />
income or rates. The funds from the funded depreciation are<br />
collected in a General Reserve. When the asset requires replacing,<br />
the funds are withdrawn from the General Reserve.<br />
Internal Financing<br />
For those activities that are funded by way of a Targeted Rate,<br />
Capital Expenditure can be funding through the Internal Financing<br />
system of <strong>Council</strong>. The full description of the Internal Financing<br />
system and how it is applied is in the Internal Financing Policy on<br />
page 268.<br />
Risks and Uncertainties<br />
There is a risk that some communities with significant capital<br />
requirements due to the condition of the asset or the requirement<br />
to upgrade their assets, that the level of debt that they owe<br />
becomes unsustainable. <strong>Council</strong> will monitor the level of debt on<br />
a regular basis to ensure such communities can sustain the costs<br />
associated with the provision of the asset.<br />
Rating of Uncertainty: Low<br />
Depreciation rates are as given in the Statement of Accounting<br />
Policies.<br />
Risks and Uncertainties<br />
The useful lives are based on historical information. Some assets<br />
may last longer than the life stated above because of differing<br />
factors and conversely, some assets may deteriorate at a faster<br />
rate than the lives stated above.<br />
Rating of Uncertainty: Low<br />
13. Climate Change & Societal<br />
Changes<br />
The Sustainability section of the <strong>Plan</strong> (Page 44) states the<br />
<strong>Council</strong>’s position on Climate Change, and the discussion in the<br />
Financial Strategy (pages 21) indicates a major societal change in<br />
the <strong>District</strong>’s aging population. The <strong>Council</strong> has considered the<br />
effects of these in its planning, but are of the opinion that there is<br />
not sufficient certainty surrounding the detail of the projections<br />
in these areas for them to be incorporated as specific financial<br />
forecasting assumptions in the LTP.<br />
The <strong>Council</strong> is mindful of the current economic crisis and<br />
outlook and will look for increased efficiencies in this regard.<br />
Other potential societal changes were considered by the<br />
<strong>Council</strong>, but were not seen to be significant.<br />
Risks and Uncertainties<br />
These factors may have a stronger impact than anticipated. The<br />
<strong>Council</strong> will monitor the situation and seek to adapt accordingly.<br />
Rating of Uncertainty: Low<br />
152
Statement of Accounting Policies<br />
Reporting Entity<br />
<strong>Hurunui</strong> <strong>District</strong> <strong>Council</strong> is a territorial local authority as<br />
governed by the Local Government Act 2002 and is domiciled<br />
in New Zealand.<br />
The <strong>Hurunui</strong> <strong>District</strong> <strong>Council</strong> group consists of the ultimate<br />
parent <strong>Hurunui</strong> <strong>District</strong> <strong>Council</strong> (HDC) and its subsidiary<br />
<strong>Hurunui</strong> Holdings Limited (HHL) (100% owned), associate<br />
Enterprise North Canterbury (50% equity share), Canterbury<br />
Economic Development Company Limited (10%) and Transwaste<br />
Canterbury Limited (1.2%). All HDC subsidiaries and associates<br />
are incorporated and domiciled in New Zealand.<br />
The primary objective of HDC is to provide goods and services<br />
for the community for social benefit rather than making a<br />
financial return.<br />
Accordingly, HDC has designated itself and the group as public<br />
benefit entities for the purposes of New Zealand equivalents to<br />
International Financial Reporting Standards (“NZ IFRS”).<br />
The seat of the <strong>Council</strong> is at Amberley.<br />
Basis of Preparation of the Forecast Information<br />
<strong>Hurunui</strong> <strong>Community</strong> <strong>Long</strong> <strong>Term</strong> <strong>Plan</strong> <strong>2012</strong> - <strong>2022</strong><br />
assumptions underlying these prospective financial statements<br />
are appropriate, has approved the <strong>Long</strong> <strong>Term</strong> <strong>Plan</strong> for distribution.<br />
The <strong>Council</strong> and management of the <strong>Hurunui</strong> <strong>District</strong> <strong>Council</strong><br />
accept responsibility for the preparation of their prospective<br />
financial statements, including the appropriateness of the<br />
assumptions underlying the prospective financial statements and<br />
all other required disclosures.<br />
No actual financial results have been incorporated within the<br />
prospective financial statements.<br />
Statement of Compliance<br />
The financial information contained within this report has<br />
been prepared in accordance with the generally accepted<br />
accounting practice in New Zealand as required under section<br />
111 of the Local Government Act 2002, and the <strong>Long</strong> <strong>Term</strong> <strong>Plan</strong><br />
requirements of section 93. It is audited under section 84 of the<br />
Local Government Act 2002.<br />
The prospective financial statements comply with applicable<br />
Financial Reporting Standards, which include New Zealand<br />
equivalents to International Financial Reporting Standards (NZ<br />
IFRS). The financial statements incorporated in the <strong>Long</strong> <strong>Term</strong><br />
<strong>Plan</strong> have been prepared in compliance with Financial Reporting<br />
Standard (FRS) number 42; Prospective Financial Statements.<br />
The prospective financial statements of the <strong>Hurunui</strong> <strong>District</strong><br />
<strong>Council</strong> have been prepared in accordance with the requirements<br />
of the Local Government Act 2002.<br />
In September 2011, the External Reporting Board issued<br />
a position paper and consultation papers proposing a new<br />
external reporting framework for public benefit entities (PBEs).<br />
The papers proposed that accounting standards for PBEs would<br />
be based on International Public Sector Accounting Standards,<br />
modified as necessary. The proposals in these papers do not<br />
provide certainty about any specific requirements of future<br />
accounting standards. Therefore, the accounting policies<br />
on which the forecast information for <strong>2012</strong>-22 has been<br />
prepared are based on the current New Zealand equivalents to<br />
International Financial Reporting Standards.<br />
The opening balances for the <strong>2012</strong>/2013 year are based on<br />
forecast closing balances for the 2011/<strong>2012</strong> year.<br />
The prospective financial statements have been prepared<br />
on a historical cost basis, modified by the revaluation of land<br />
and buildings, certain infrastructural assets, investments,<br />
biological assets and financial instruments (including derivative<br />
instruments).<br />
The <strong>Council</strong> authorised the prospective financial statements on<br />
28 June <strong>2012</strong>.<br />
The <strong>Council</strong>, who are authorised to do so and believe that the<br />
The <strong>Hurunui</strong> <strong>District</strong> <strong>Council</strong> is a Public Benefit Entity and has<br />
applied the PBE exemptions allowable under New Zealand<br />
equivalents to International Financial Reporting Standards (NZ<br />
IFRS).<br />
Cautionary Note<br />
The information in the prospective financial statements is to<br />
outline service and spending priorities in the statement of<br />
proposal for the <strong>Long</strong> <strong>Term</strong> <strong>Plan</strong> and may not be appropriate<br />
for any other use.<br />
Consolidation<br />
The <strong>Council</strong> has not consolidated the prospective financial<br />
statements to include the <strong>Council</strong>’s subsidiary <strong>Hurunui</strong> Holdings<br />
Limited. The <strong>Council</strong> believes consolidation for the purpose of<br />
the <strong>Long</strong> <strong>Term</strong> <strong>Plan</strong> will not be material as <strong>Hurunui</strong> Holdings<br />
Limited operates essentially as a shelf company and has no<br />
transactions.<br />
Measurement Base<br />
The prospective financial statements have been prepared on<br />
the historical cost basis, modified by the revaluation of certain<br />
assets.<br />
Functional and Presentation Currency<br />
The financial statements are presented in New Zealand dollars<br />
and all values are rounded to the nearest thousand dollars<br />
($’000). The functional currency of the HDC is New Zealand<br />
dollars.<br />
153
www.hurunui.govt.nz<br />
Changes in Accounting Policies<br />
The accounting policies set out below have been applied<br />
consistently to all periods presented in these financial statements.<br />
Significant Accounting Policies Basis of<br />
Consolidation<br />
The purchase method is used to prepare the consolidated<br />
financial statements, which involves adding together like items<br />
of assets, liabilities, equity, income and expenses on a line-by-line<br />
basis. All significant intragroup balances, transactions, income<br />
and expenses are eliminated on consolidation.<br />
Subsidiaries<br />
HDC consolidates as subsidiaries in the group financial<br />
statements all entities where HDC has the capacity to control<br />
their financing and operating policies so as to obtain benefits<br />
from the activities of the entity. This power exists where HDC<br />
controls the majority voting power on the governing body or<br />
where such policies have been irreversibly predetermined by<br />
HDC or where the determination of such policies is unable to<br />
materially impact the level of potential ownership benefits that<br />
arise from the activities of the subsidiary.<br />
HDC measures the cost of a business combination as the<br />
aggregate of the fair values, at the date of exchange, of assets<br />
given, liabilities incurred or assumed, in exchange for control of<br />
the subsidiary plus any costs directly attributable to the business<br />
combination.<br />
Any excess of the cost of the business combination over<br />
HDC’s interest in the net fair value of the identifiable assets,<br />
liabilities and contingent liabilities is recognised as goodwill. If<br />
HDC’s interest in the net fair value of the identifiable assets,<br />
liabilities and contingent liabilities recognised exceeds the cost<br />
of the business combination, the difference will be recognised<br />
immediately in the statement of comprehensive income.<br />
Investments in subsidiaries are valued as available for sale<br />
investments in HDC’s own “parent entity” financial statements.<br />
Associates<br />
HDC accounts for an investment in an associate in the group<br />
financial statements using the equity method. An associate is an<br />
entity over which the HDC has significant influence and that<br />
is neither a subsidiary nor an interest in a joint venture. The<br />
investment in an associate is initially recognised at cost and the<br />
carrying amount is increased or decreased to recognise HDC’s<br />
share of the surplus or deficit of the associate after the date<br />
of acquisition. HDC’s share of the surplus or deficit of the<br />
associate is recognised in HDC’s statement of comprehensive<br />
income. Distributions received from an associate reduce the<br />
carrying amount of the investment.<br />
If HDC’s share of an associate’s deficit equals or exceeds its<br />
interest in the associate, HDC discontinues recognising its share<br />
of further deficits. After HDC’s interest is reduced to zero,<br />
additional deficits are provided for, and a liability is recognised,<br />
only to the extent that HDC has incurred legal or constructive<br />
obligations or made payments on behalf of the associate. If the<br />
associate subsequently reports surpluses, HDC will resume<br />
recognising its share of those surpluses only after its share of<br />
surpluses equals the share of deficits not recognised.<br />
HDC’s share in the associate’s surplus or deficits resulting from<br />
unrealised gains on transactions between the HDC and its<br />
associates is eliminated.<br />
HDC’s investments in associates are carried at cost in HDC’s<br />
own “parent entity” financial statements.<br />
Revenue<br />
Revenue is measured at the fair value of consideration received.<br />
Rates Revenue<br />
Rates are set annually by a resolution from <strong>Council</strong> and<br />
relate to a financial year. All ratepayers are invoiced within the<br />
financial year to which the rates have been set. Rates revenue is<br />
recognised when payable.<br />
Rates collected on behalf of the Canterbury Regional <strong>Council</strong><br />
(ECan) are not recognised in the financial statements as HDC is<br />
acting as an agent for ECan.<br />
Water Revenue<br />
Water Billing is recognised on volumes delivered on accrual<br />
basis.<br />
New Zealand Transport Agency Roading Subsidies<br />
New Zealand Transport Agency roading subsidies are recognised<br />
as revenue upon entitlement which is when conditions pertaining<br />
to eligible expenditure have been fulfilled.<br />
Contract Revenue<br />
Revenue from a contract to provide services is recognised by<br />
reference to the stage of completion of the contract at the<br />
balance sheet date based on the actual service provided as a<br />
percentage of total services to be provided.<br />
User Charges<br />
Sales of goods are recognised when the significant risks and<br />
rewards of ownership of the assets have been transferred to<br />
the buyer which is usually when the goods are delivered and<br />
title has passed.<br />
Interest Revenue<br />
Interest income is accrued on a time basis, by reference to the<br />
principal outstanding and at the effective interest rate applicable.<br />
154
<strong>Hurunui</strong> <strong>Community</strong> <strong>Long</strong> <strong>Term</strong> <strong>Plan</strong> <strong>2012</strong> - <strong>2022</strong><br />
Dividend Revenue<br />
Dividend income from investments is recognised as revenue, net<br />
of imputation credits, when the shareholders’ rights to receive<br />
payment have been established.<br />
Other Revenue<br />
Other revenue including assets vested in <strong>Council</strong>, with or<br />
without restrictions, is recognised as revenue when control<br />
over the assets is obtained.<br />
Development Contributions<br />
Development contributions are recognized as revenue when<br />
the <strong>Council</strong> provides, or is able to provide, the service for<br />
which the contribution was charged. Otherwise development<br />
contributions are recognized as liabilities until such time the<br />
<strong>Council</strong> provides, or is able to provide, the service.<br />
Development contributions are classified as part of “Other<br />
Revenue”.<br />
Borrowing Costs<br />
All borrowing costs are recognised as expenses in the statement<br />
of comprehensive income in the period in which they are<br />
incurred.<br />
Income Tax<br />
Income tax in relation to the surplus or deficit for the period<br />
comprises current tax and deferred tax.<br />
Current tax is the amount of income tax payable on the taxable<br />
profit for the current year, plus any adjustments to income tax<br />
payable in respect of prior years. Current tax is calculated using<br />
rates that have been enacted or substantively enacted at balance<br />
date.<br />
Deferred tax is the amount of income tax payable or recoverable<br />
in future periods in respect of temporary differences and unused<br />
tax losses. Temporary differences are differences between<br />
the carrying amount of assets and liabilities in the financial<br />
statements and the corresponding tax bases in the computation<br />
of taxable profit.<br />
Deferred tax liabilities are generally recognised for taxable<br />
temporary differences and deferred tax assets are recognised to<br />
the extent that it is probable that taxable profits will be available<br />
against which deductible temporary differences can be utilised.<br />
Deferred tax is not recognised if the temporary difference<br />
arises from the initial recognition of goodwill or from the initial<br />
recognition of an asset and liability in a transaction that is not a<br />
business combination, and at the time of the transaction, affects<br />
neither the accounting profit nor taxable profit.<br />
Deferred tax is recognised on taxable temporary differences<br />
arising on investments in subsidiaries and associates, and interests<br />
in joint ventures, except where the company can control the<br />
reversal of the temporary difference and it is probable that the<br />
temporary difference will not reverse in the foreseeable future.<br />
Deferred tax is calculated at the tax rates that are expected to<br />
apply in the period when the liability is settled or the asset is<br />
realised, using tax rates that have been enacted or substantially<br />
enacted by balance date.<br />
Current tax and deferred tax is charged or credited to the<br />
statement of comprehensive income, except when it relates to<br />
items charged or credited directly to equity, in which case the<br />
tax is dealt with in equity.<br />
Leases<br />
Operational leases<br />
An operating lease is a lease that does not transfer substantially<br />
all the risks and rewards incidental to ownership of an asset.<br />
Lease payments under an operating lease are recognised on a<br />
straight-line basis over the lease term.<br />
Cash and Cash Equivalents<br />
Cash and cash equivalents comprise cash in hand, demand<br />
deposits and other short-term highly liquid investments that are<br />
readily convertible to a known amount of cash and are subject<br />
to an insignificant risk of changes in value, and with original<br />
maturities of three months or less.<br />
Trade and Other Receivables<br />
Trade and other receivables are initially measured at fair value<br />
and subsequently measured at amortised cost using the effective<br />
interest rate method, less any provision for impairment.<br />
Inventories<br />
Inventories are stated at the lower of cost and net realisable<br />
value. Cost comprises direct materials and, where applicable,<br />
direct labour costs and those overheads that have been<br />
incurred in bringing the inventories to their present location<br />
and condition. Cost is calculated using the weighted average<br />
method.<br />
Net realisable value represents the estimated selling price less<br />
all estimated costs of completion and costs to be incurred in<br />
marketing, selling and distribution.<br />
Financial Assets<br />
The Group classifies its financial assets into the following four<br />
categories: financial assets at fair value through profit or loss,<br />
held to maturity investments, loans and receivables and financial<br />
155
www.hurunui.govt.nz<br />
assets at fair value through equity. The classification depends<br />
on the purpose for which the investments were acquired.<br />
Management determines the classification of its investments<br />
at initial recognition and re-evaluates the designation every<br />
reporting date.<br />
Financial assets and liabilities are initially measured at fair value<br />
plus transaction costs unless they are carried at fair value<br />
through profit and loss in which case transaction costs are<br />
recognised in the statement of comprehensive income.<br />
Investments<br />
Investments are recognised on a trade-date basis and are<br />
initially measured at fair value, including transaction costs. At<br />
subsequent reporting dates, debt securities that the Group has<br />
the expressed intention and ability to hold to maturity (heldto-maturity<br />
debt securities) are measured at amortised cost<br />
using the effective interest rate method, less any impairment<br />
loss recognised to reflect irrecoverable amounts.<br />
Investments other than held-to-maturity debt securities are<br />
classified as either held-for-trading or available-for sale, and are<br />
measured at subsequent reporting dates at fair value.<br />
Where securities are held for trading purposes, gains and losses<br />
arising from changes in fair value are included in the statement<br />
of comprehensive income for the period.<br />
For available-for-sale investments, gains and losses arising from<br />
changes in fair value are recognised directly in equity, until the<br />
security is disposed of or is determined to be impaired, at which<br />
time the cumulative gain or loss previously recognised in equity<br />
is included in the statement of comprehensive income for the<br />
period.<br />
Impairment of Investments<br />
An impairment loss is recognised in the statement of<br />
comprehensive income when there is objective evidence<br />
that the asset is impaired, and is measured as the difference<br />
between the investment’s carrying amount and the present<br />
value of estimated future cash flows discounted at the effective<br />
interest rate computed at initial recognition. Impairment losses<br />
are reversed in subsequent periods when an increase in the<br />
investment’s recoverable amount can be related objectively to<br />
an event occurring after the impairment was recognised, subject<br />
to the restriction that the carrying amount of the investment at<br />
the date the impairment is reversed shall not exceed what the<br />
amortised cost would have been had the impairment not been<br />
recognised.<br />
Derivative Fiancial Instruments<br />
The <strong>Council</strong> uses derivative financial instruments (primarily<br />
interest rate hedges) to hedge the risks associated with interest<br />
rate movements. The use of financial derivatives is governed<br />
by the <strong>Council</strong>’s policies approved by the HDC and the HHL<br />
board of directors, which provide written principles on the<br />
use of financial derivatives consistent with the <strong>Council</strong>’s risk<br />
management strategy. The Group does not use derivative<br />
financial instruments for speculative purposes.<br />
Such derivatives are initially recorded at fair value on contract<br />
date and are adjusted to fair value at subsequent reporting dates.<br />
Changes in the fair value of derivative financial instruments are<br />
recognised in the statement of comprehensive income as they<br />
arise.<br />
Non-Current Assets Held for Sale<br />
Non-current assets are classified as held for sale if their carrying<br />
amount will be recovered principally through a sale transaction,<br />
not through continuing use. Non-current assets held for sale are<br />
measured at the lower of their carrying amount and fair value<br />
less costs to sell.<br />
Any impairment losses for write downs or non-current assets<br />
held for sale are recognised in the statement of comprehensive<br />
income. Any increase in fair value (less costs to sell) are<br />
recognised up to the level of any impairment losses that have<br />
been previously recognised.<br />
Non-current assets (including those that are part of a disposal<br />
group) are not depreciated or amortised while they are classified<br />
as held for sale. Interest and other expenses attributable to the<br />
liabilities of a disposal group classified as held for sale continue<br />
to be recognised.<br />
Property, <strong>Plan</strong>t & Equipment<br />
Property, plant and equipment consists of:<br />
Operational Assets — These include land, buildings, landfill post<br />
closure, library books, plant and equipment, and motor vehicles.<br />
Restricted Assets — Restricted assets are parks and reserves<br />
owned by the <strong>Council</strong> which provide a benefit or service to the<br />
community and cannot be disposed of because of legal or other<br />
restrictions.<br />
Infrastructure assets — Infrastructure assets are the fixed utility<br />
systems owned by the <strong>Council</strong>. Each asset class includes all<br />
items that are required for the network.<br />
Property, <strong>Plan</strong>t and Equipment are at stated values less<br />
accumulated depreciation and impairment losses.<br />
Fixtures and Fittings, Motor Vehicles, <strong>Plan</strong>t and Equipment, and<br />
Library Books are stated at cost less accumulated depreciation<br />
and impairment losses.<br />
156
<strong>Hurunui</strong> <strong>Community</strong> <strong>Long</strong> <strong>Term</strong> <strong>Plan</strong> <strong>2012</strong> - <strong>2022</strong><br />
Additions<br />
The cost of an item of property, plant and equipment is<br />
recognised as an asset if, and only if, it is probable that future<br />
economic benefits or service potential associated with the item<br />
will flow to the Group and the cost of the item can be measured<br />
reliably.<br />
In most instances, an item of property, plant and equipment is<br />
recognised at its cost. Where an asset is acquired at no cost, or<br />
for a nominal cost, it is recognised at fair value as at the date of<br />
acquisition.<br />
Disposals<br />
Gains and losses on disposals are determined by comparing the<br />
proceeds with the carrying amount of the asset. Gains and losses<br />
on disposals are included in the statement of comprehensive<br />
income. When revalued assets are sold, the amounts included<br />
in asset revaluation reserves in respect of those assets are<br />
transferred to retained earnings.<br />
Subsequent Costs<br />
Costs incurred subsequent to initial acquisition are capitalised<br />
only when it is probable that future economic benefits or service<br />
potential associated with the item will flow to the Group and<br />
the cost can be measured reliably.<br />
Revaluation<br />
An assets fair value at the date of revaluation is equal to the<br />
revalued amount. Revaluations are performed with sufficient<br />
regularity such that the carrying amount does not differ<br />
materially from that which would be determined using fair<br />
values at balance date and this is generally every three years.<br />
Revaluation increments and decrements are credited or debited<br />
to the asset revaluation reserve for that class of asset. Where<br />
this results in a debit balance in the asset revaluation reserve,<br />
this balance is expensed in the statement of comprehensive<br />
income. Any subsequent increase on revaluation that offsets<br />
a previous decrease in value is recognised in the statement of<br />
comprehensive income will be recognised up to the amount<br />
previously expensed, and then credited to the revaluation<br />
reserve for that class of asset.<br />
Operational Land and Buildings<br />
Land and Buildings were valued by Darroch Limited (Registered<br />
Valuers) as at 30 June 2011. The basis of valuation is fair value<br />
with reference to highest and best use, as at 30 June 2011.<br />
They are stated at valuation less accumulated depreciation and<br />
accumulated impairment.<br />
Properties in the course of construction for production, rental<br />
or administrative purposes, or for purposes not yet determined,<br />
are carried at cost, less any recognised impairment loss. Cost<br />
includes professional fees.<br />
Subsequent costs are included in the asset’s carrying amount<br />
or recognised as a separate asset, as appropriate, only when it<br />
is probable that future economic benefits associated with the<br />
item will flow to HDC and the cost of the item can be measured<br />
reliably. All other repairs and maintenance are charged to the<br />
statement of comprehensive income during the financial period<br />
in which they are incurred.<br />
Restricted Assets<br />
Certain infrastructure assets and land have been vested in<br />
the <strong>Council</strong> as part of the subdivisional consent process. The<br />
vested reserve land has been initially recognised at the most<br />
recent appropriately certified government valuation. Vested<br />
infrastructure assets have been valued based on the estimated<br />
quantities of infrastructure components vested and the current<br />
“in the ground” cost of providing identical services.<br />
Infrastructural Asset Classes; Roads, Water Reticulation,<br />
Sewerage Reticulation and Stormwater Systems<br />
Infrastructural assets are recorded at valuation established<br />
using depreciated replacement cost, plus additions at cost less<br />
accumulated depreciation and accumulated impairment losses.<br />
The revaluation of infrastructural assets is carried out on a<br />
three yearly cycle.<br />
The roading valuation includes land under the roading network.<br />
The valuation of this land is based on the average rateable value<br />
of land in the associated ward as determined by QV Valuations<br />
(Registered Valuers) as at 30 June 2005. Under NZ IFRS HDC<br />
has elected to use the fair value of the land under roads as at<br />
30 June 2005 at deemed cost. Land under roads is no longer<br />
revalued.<br />
Roading assets have been valued at depreciated replacement<br />
cost as at 30 June 2010. The valuation was performed internally<br />
by HDC’s Roading Engineer – Asset Management, J Whyte and<br />
peer reviewed by George JasonSmith, BE (NSW), MIPENZ<br />
(Civil), CPEng, Principal Asset Management Consultants for<br />
AECOM New Zealand Limited. Additions and disposals after<br />
the date of valuation will be recorded at cost.<br />
Water and Sewage Assets have been valued at depreciated<br />
replacement cost as at 1 July 2009. The valuation was performed<br />
internally by the Manager of Engineering Services, B M Yates,<br />
Registered Engineer and peer reviewed by M Clough, Registered<br />
Valuer of Beca Valuations Limited. Additions and disposals since<br />
the date of valuation have been recorded at cost.<br />
Stormwater and Drainage Assets have been valued at<br />
depreciated replacement cost as at 30 June 2011. The valuation<br />
was performed internally by HDC’s Technical Officer - Utilities,<br />
157
www.hurunui.govt.nz<br />
D Perry and peer reviewed by M Clough, Registered Valuer of<br />
Beca Valuations Limited. Additions and disposals since the date<br />
of valuation have been recorded at cost.<br />
Certain infrastructural assets have been vested in HDC as part<br />
of the subdivision consent process. Vested infrastructure assets<br />
have been valued based on the estimated quantities of the<br />
components vested in HDC.<br />
Depreciation<br />
Depreciation is provided on a straight line basis on all property,<br />
plant and equipment and intangible assets other than land<br />
and heritage assets, at rates which will write off the cost (or<br />
valuation) of the assets to their estimated residual values over<br />
their useful lives. Depreciation of these assets commences when<br />
the assets are ready for their intended use.<br />
Depreciation on revalued assets is charged to the statement of<br />
comprehensive income. On the subsequent sale or retirement<br />
of a revalued asset, the attributable revaluation surplus remaining<br />
in the properties revaluation reserve is transferred directly to<br />
retained earnings.<br />
The gain or loss arising on the disposal or retirement of an asset<br />
is determined as the difference between the sales proceeds<br />
and the carrying amount of the asset and is recognised in the<br />
statement of comprehensive income.<br />
The useful lives and associated depreciation rates of major<br />
classes of assets have been estimated in Table 1.<br />
Intangible Assets<br />
Software Acquisition and Development<br />
Acquired computer software licenses are capitalised on the<br />
basis of the costs incurred to acquire and bring to use the<br />
specific software.<br />
Costs associated with maintaining computer software are<br />
recognised as an expense when incurred. Costs that are directly<br />
associated with the development of software for internal use<br />
by the Group are recognised as an intangible asset. Direct<br />
costs include the software development employee costs and an<br />
appropriate portion of the relevant overheads.<br />
Amortisation<br />
The carrying value of intangible assets with a finite life is amortised<br />
on a straight-line basis over its useful life. Amortisation begins<br />
when the asset is available for use and ceases at the date that<br />
the asset is derecognised. The amortisation charge for each<br />
period is recognised in the statement of comprehensive income.<br />
The useful lives and associated amortisation rates of major<br />
classes of intangible assets have been estimated as follows:<br />
Computer software 3 – 4 years 25 – 33%<br />
Aerial Photos 10 years 10%<br />
Forestry Assets<br />
Forestry and other biological assets are stated at fair value less<br />
estimated point-of-sale costs, with any resultant gain or loss<br />
recognised in the statement of comprehensive income. Pointof-sale<br />
costs include all costs that would be necessary to sell<br />
the assets, excluding costs necessary to transport the assets to<br />
market.<br />
The fair value of standing timber older than 10 years, being the<br />
age at which it becomes marketable, is based on the market<br />
price of the estimated recoverable wood volumes, net of<br />
harvesting costs. The fair value of younger standing timber is<br />
based on the present value of the net cash flows expected to<br />
be generated by the plantation at maturity. The present values<br />
are calculated using a pre-tax discount rate that reflects current<br />
market assessments of the time value of money and the risks<br />
specific to the asset.<br />
Forests are valued annually by Laurie Forestry Ltd. Any increase<br />
or decrease in the valuation is reflected in the statement of<br />
comprehensive income.<br />
Impairment of Non-Financial Assets<br />
At each reporting date, the Group reviews the carrying amounts<br />
of its tangible and intangible assets to determine whether there<br />
is any indication that those assets have suffered an impairment<br />
loss. If any such indication exists and for indefinite life intangibles,<br />
the recoverable amount of the asset is estimated in order to<br />
determine the extent of the impairment loss (if any). Where it is<br />
not possible to estimate the recoverable amount of an individual<br />
asset, the Group estimates the recoverable amount of the cash<br />
generating unit to which the asset belongs. Recoverable amount<br />
is the greater of market value less costs to sell and value in use.<br />
The Group measures the value in use of assets whose future<br />
economic benefits are not directly related to their ability to<br />
generate net cash inflows held, at depreciated replacement cost.<br />
In assessing value in use for other assets, the estimated future<br />
cash flows are discounted to their present value using a pre-tax<br />
discount rate that reflects current market assessments of the<br />
time value of money and the risks specific to the asset.<br />
If the recoverable amount of an asset (or cash-generating unit)<br />
is estimated to be less than its carrying amount, the carrying<br />
amount of the asset (cash-generating unit) is reduced to its<br />
recoverable amount.<br />
158
<strong>Hurunui</strong> <strong>Community</strong> <strong>Long</strong> <strong>Term</strong> <strong>Plan</strong> <strong>2012</strong> - <strong>2022</strong><br />
Table 1.<br />
Useful Life<br />
Depreciation<br />
Rate<br />
Buildings - wooden (excluding<br />
properties intended for sale)<br />
50 years 2%<br />
Buildings - concrete (excluding<br />
properties intended for sale)<br />
100 years 1%<br />
Furniture and fittings: administration 5 years 20%<br />
Furniture and fittings: pensioner<br />
flats<br />
10 years 10%<br />
Library books 3 – 8 years 12.5 – 33.33%<br />
Computer hardware 3 – 4 years 25 – 33.33%<br />
Motor vehicles 5 years 20%<br />
Thermal pools - plant 5 years 20%<br />
Thermal pools – development<br />
expenditure<br />
20 – 100 years 1% - 5%<br />
<strong>Plan</strong>t and machinery (excluding<br />
HDC’s infrastructural assets)<br />
10 years 10%<br />
Small plant and machines 3 - 10 years 10 - 33.33%<br />
Car parks 20 – 25 years 4 – 5%<br />
Landscaping 10 – 50 years 2 – 10%<br />
Roads, Streets and Bridges<br />
- Land under roads Not depreciated 0%<br />
- Pavement formation Not depreciated 0%<br />
- Pavement layers (sealed) 100 years 1%<br />
- Pavement layers (unsealed) Not depreciated 0%<br />
- Pavement surface (sealed) Average 16 years 6.25%<br />
- Pavement surface (unsealed) 12 years 8.33%<br />
- Culverts 25 – 50 years 2 – 4%<br />
- Kerb and channel 50 – 80 years 1.25 – 2%<br />
- Footpaths 20 – 75 years 1.33 – 5%<br />
- Bridges – timber 70 years 1.43%<br />
- Bridges – concrete and other 100 years 1%<br />
- Retaining walls 50 years 2%<br />
- Traffic signs 12 years 8.33%<br />
- Street lighting 15 – 25 years 4 – 6.67%<br />
Sewerage<br />
- Pipes 50 – 80 years 1.25 – 2%<br />
- Pipes other 40 years 2.5%<br />
- Pumps and controls 10 – 25 years 4 – 10%<br />
- Manholes 50 – 80 years 1.25 – 2%<br />
- Treatment plant 25 – 60 years 1.67 – 4%<br />
Water<br />
- Pipes 50 – 80 years 1.25 – 2%<br />
- Pipes other 50 – 80 years 1.25 – 2%<br />
- Reservoir and tanks 80 years 1.25%<br />
- Pumps and controls 10 – 25 years 4 – 10%<br />
- Pump stations/intakes 20 – 60 years 1.67 – 5%<br />
- Treatment plant 10 – 80 years 1.25 – 10%<br />
Drainage 3 - 10 years 10 - 33.33%<br />
- Points 80 years 1.25%<br />
- Lines 50 - 80 years 1.25 – 2%<br />
For non-revalued assets, impairment losses are recognised as an<br />
expense immediately.<br />
For revalued assets, other than investment property, the<br />
impairment loss is treated as a revaluation decrease to the<br />
extent it reverses previous accumulated revaluation increments<br />
for that asset class.<br />
Where an impairment loss subsequently reverses, the carrying<br />
amount of the asset (cash-generating unit) is increased to<br />
the revised estimate of its recoverable amount, but so that<br />
the increased carrying amount does not exceed the carrying<br />
amount that would have been determined had no impairment<br />
loss been recognised for the asset (cash-generating unit) in<br />
prior years. A reversal of an impairment loss is recognised as<br />
income immediately, unless the relevant asset is carried at a<br />
revalued amount, in which revaluation increase to the extent<br />
that any impairment losses had been previously charged to<br />
comprehensive income.<br />
Creditors and Other Payables<br />
Creditors and other payables are initially measured at fair value<br />
and subsequently measured at amortised cost.<br />
Borrowings<br />
Borrowings are initially measured at fair value of net transaction<br />
costs and subsequently measured at amortised cost using the<br />
effective interest method.<br />
Borrowings are classified as current liabilities unless HDC or<br />
group has an unconditional right to defer settlement of the<br />
liability for at least 12 months after balance date.<br />
Employee Entitlements<br />
Provision is made in respect of the <strong>Council</strong>’s liability for retiring<br />
gratuity allowances, annual and long service leave, and sick leave.<br />
Short-term benefits<br />
Employee benefits that the <strong>Council</strong> expects to be settled within<br />
12 months of balance date are measured at nominal values<br />
based on accrued entitlements at current rates of pay.<br />
These include salaries and wages accrued up to balance date,<br />
annual leave earned to, but not yet taken at balance date, retiring<br />
and long service leave entitlements expected to be settled<br />
within 12 months, and sick leave.<br />
The <strong>Council</strong> recognises a liability for sick leave to the extent<br />
that absences in the coming year are expected to be greater<br />
than the sick leave entitlements earned in the coming year. The<br />
amount is calculated based on the unused sick leave entitlement<br />
that can be carried forward at balance date, to the extent that<br />
the <strong>Council</strong> anticipates it will be used by staff to cover those<br />
future absences.<br />
159
www.hurunui.govt.nz<br />
The <strong>Council</strong> recognises a liability and an expense for bonuses<br />
where contractually obliged or where there is a past practice<br />
that has created a constructive obligation.<br />
<strong>Long</strong> service leave and retiring gratuity<br />
The retiring gratuity and long service leave liability is assessed on<br />
an actuarial basis using current rates of pay taking into account<br />
years of service, years to entitlement and the likelihood staff will<br />
reach the point of entitlement.<br />
Provisions<br />
Provisions are recognised when the Group has a present<br />
obligation as a result of a past event (either legal or constructive),<br />
and it is probable that the Group will be required to settle that<br />
obligation. Provisions are measured at management’s best<br />
estimate of the expenditure required to settle the obligation<br />
at balance date, and are discounted to present value where<br />
the effect is material. Provisions are not recognised for future<br />
operating losses.<br />
As operator of the Waikari Landfill, the <strong>Council</strong> has a legal<br />
obligation under the resource consent to provide ongoing<br />
maintenance and monitoring services at the landfill site after<br />
closure. A provision for post-closure costs is recognised as a<br />
liability when the obligation for post-closure costs arises.<br />
The provision is measured based on the present value of<br />
future cash flows expected to be incurred, taking into account<br />
future events including new legal requirements, and known<br />
improvements in technology, where there is sufficient evidence<br />
that these events will occur. The provision includes all other<br />
costs associated with landfill post-closure.<br />
Amounts provided for landfill post-closure are capitalised to the<br />
landfill asset where they give rise to future economic benefits<br />
to be obtained. Components of the capitalised landfill asset are<br />
depreciated over their useful lives. The discount rate used is a<br />
rate that reflects current market assessments of the time value<br />
of money and the risks specific to the liability.<br />
Goods and Services Tax<br />
These financial statements have been prepared exclusive of GST,<br />
except for receivables and payables, which are GST inclusive.<br />
Where GST is not recoverable as an input tax, it is recognised<br />
as part of the related asset or expense<br />
Budget Figures<br />
budget figures have been prepared in accordance NZ GAAP<br />
and are consistent with the accounting policies adopted by the<br />
<strong>Council</strong> for the preparation of the financial statements.<br />
Cost Allocation<br />
HDC has derived the net cost of service for each significant<br />
activity of the <strong>Council</strong> using a system of cost allocation.<br />
Direct Costs are charged directly to significant activities.<br />
Indirect costs are charged to significant activities based on cost<br />
drivers and related activity/usage information. ‘Direct’ costs are<br />
those costs directly attributable to a significant activity.<br />
‘Indirect costs’ are those costs, which cannot be identified in an<br />
economically feasible manner with a specific significant activity.<br />
The costs of internal services not directly charged to activities<br />
are allocated as overheads using appropriate cost drivers such<br />
as actual usage, staff numbers and the like.<br />
Critical Accounting Estimates and Assumptions<br />
The preparation of prospective financial statements in<br />
conformity with NZ IFRS requires management to make<br />
judgments, estimates and assumptions that affect the application<br />
of policies and reported amounts of assets and liabilities, income<br />
and expenses. The estimates and associated assumptions are<br />
based on historical experience and various other factors that are<br />
believed to be reasonable under the circumstances, the results<br />
of which form the basis of making the judgments about carrying<br />
values of assets and liabilities that are not readily apparent from<br />
other sources.<br />
Management has exercised the following critical judgments in<br />
applying the accounting policies to the preparation of the <strong>2012</strong>-<br />
<strong>2022</strong> <strong>Long</strong> <strong>Term</strong> <strong>Plan</strong>. Judgments have been made over useful lives<br />
of property, plant and equipment and intangible assets, landfill<br />
aftercare provision, probability of reaching vesting date for long<br />
service liability, sick leave provisions, valuations of infrastructural<br />
assets and the long term effects on HDC’s assets as a result of<br />
the Canterbury earthquakes. Therefore, actual results may differ<br />
from these estimates.<br />
The judgments and underlying assumptions are reviewed on an<br />
ongoing basis. Revisions to accounting estimates are recognised<br />
in the period to which the estimate is revised if the revision<br />
affects only that period or the period of the revision and future<br />
periods if the revision affects both current and future periods.<br />
The budget figures are those approved by the <strong>Council</strong> at the<br />
beginning of the year after a period of consultation with the<br />
public as part of the <strong>Long</strong> <strong>Term</strong> <strong>Plan</strong> or Annual <strong>Plan</strong> process. The<br />
160
<strong>Hurunui</strong> <strong>Community</strong> <strong>Long</strong> <strong>Term</strong> <strong>Plan</strong> <strong>2012</strong> - <strong>2022</strong><br />
Forecast Statement of Comprehensive Income<br />
Annual <strong>Plan</strong> Year 1 Year 2 Year 3 Year 4 Year 5 Year 6 Year 7 Year 8 Year 9 Year 10<br />
2011/<strong>2012</strong> <strong>2012</strong>/2013 2013/2014 2014/2015 2015/2016 2016/2017 2017/2018 2018/2019 2019/2020 2020/2021 2021/<strong>2022</strong><br />
($000) ($000) ($000) ($000) ($000) ($000) ($000) ($000) ($000) ($000) ($000)<br />
Revenue<br />
<strong>District</strong> Wide Rates 5,280 5,558 6,014 6,459 6,662 6,942 7,160 7,252 7,570 7,843 8,012<br />
Targeted Rates for Water Supplies 446 444 471 500 527 556 586 618 652 688 726<br />
Targeted Rates for Other Services 6,997 7,627 7,987 8,352 8,673 9,038 9,380 9,776 10,206 10,662 11,173<br />
Development Contributions 697 390 405 419 422 423 438 454 464 485 445<br />
Dividends Received 33 72 74 77 79 82 84 86 89 92 95<br />
NZTA Subsidies and Other Grants 3,529 3,383 3,386 3,494 3,610 3,734 3,859 3,994 4,144 4,310 4,482<br />
Hanmer Springs Thermal Pools and Spa 9,632 9,572 10,004 10,305 10,923 11,257 11,591 12,283 12,656 13,044 13,840<br />
Other Income 2,408 2,529 2,781 2,879 4,362 3,334 2,769 3,033 3,004 3,035 3,134<br />
Vested Asset Income 646 218 227 234 242 339 352 366 382 399 332<br />
Gains/(Losses) on Forestry Revaluation 0 277 13 (63) (1,465) (500) 168 (85) (48) 30 11<br />
29,668 30,072 31,363 32,655 34,034 35,205 36,388 37,778 39,118 40,589 42,251<br />
Less Expenditure<br />
Employee Benefits 8,799 9,537 9,902 10,203 10,526 10,872 11,181 11,498 11,861 12,259 12,659<br />
Direct Operating Expenses 13,362 13,989 14,473 15,062 15,293 15,891 16,403 16,750 17,240 17,864 18,368<br />
External Interest Paid 831 969 1,203 1,297 1,359 1,391 1,375 1,281 1,156 1,000 828<br />
Depreciation 5,662 5,805 6,221 6,315 6,437 6,767 6,785 6,965 7,388 7,441 7,706<br />
28,654 30,299 31,799 32,877 33,616 34,920 35,744 36,495 37,646 38,564 39,560<br />
Net Surplus/(Deficit) before tax 1,014 (227) (436) (222) 418 285 643 1,283 1,472 2,025 2,690<br />
Tax expense 0 0 0 0 0 0 0 0 0 0 0<br />
Net Surplus/(Deficit) after tax 1,014 (227) (436) (222) 418 285 643 1,283 1,472 2,025 2,690<br />
Add Other Comprehensive Income<br />
Gains/(Losses) on Asset Revaluation 0 22,017 4,938 5,885 24,576 4,692 6,194 29,592 5,844 8,055 34,904<br />
0 22,017 4,938 5,885 24,576 4,692 6,194 29,592 5,844 8,055 34,904<br />
Total Comprehensive Income 1,014 21,789 4,501 5,663 24,994 4,976 6,838 30,876 7,316 10,080 37,595<br />
Summary of Capital Expenditure<br />
Water Supplies 1,536 2,092 704 894 775 1,161 752 725 817 736 1,509<br />
Sewerage 149 919 151 1,551 168 237 465 128 73 83 67<br />
Stormwater and Drainage 0 294 62 0 0 153 0 0 0 0 85<br />
Roads and Footpaths 4,204 3,643 3,781 3,901 4,035 4,242 4,416 4,588 4,778 4,996 5,166<br />
<strong>Community</strong> Services and Facilities 255 441 436 452 2,442 1,482 373 263 746 261 280<br />
Environment and Safety 133 234 197 113 133 190 197 0 97 102 0<br />
<strong>District</strong> Promotion 0 0 0 0 0 0 0 0 0 0 0<br />
Hanmer Springs Thermal Pools and Spa 200 2,650 1,455 644 944 115 119 124 130 136 142<br />
Governance 0 0 36 0 0 40 0 0 45 0 0<br />
Corporate Services 387 490 551 301 367 380 334 410 428 379 468<br />
6,864 10,763 7,374 7,856 8,864 8,000 6,657 6,239 7,114 6,693 7,717<br />
C:\Users\jab\Desktop\Fuck Up with Subsidised Roading\<strong>Hurunui</strong> <strong>District</strong> <strong>Council</strong> LTP Budgets <strong>2012</strong>-<strong>2022</strong> - Post Submissions - with Option 2 for Subsidised Roading.xls 27/06/<strong>2012</strong> 2:17 p.m.<br />
161
www.hurunui.govt.nz<br />
Forecast Statement of Comprehensive Income and Group Activity Summaries<br />
Annual <strong>Plan</strong> Year 1 Year 2 Year 3 Year 4 Year 5 Year 6 Year 7 Year 8 Year 9 Year 10<br />
2011/<strong>2012</strong> <strong>2012</strong>/2013 2013/2014 2014/2015 2015/2016 2016/2017 2017/2018 2018/2019 2019/2020 2020/2021 2021/<strong>2022</strong><br />
($000) ($000) ($000) ($000) ($000) ($000) ($000) ($000) ($000) ($000) ($000)<br />
Reconciliation between Income and Activity Summaries<br />
Water Supplies 4,336 4,578 4,710 4,970 5,428 5,644 5,802 6,044 6,296 6,558 6,821<br />
Sewerage 770 691 757 835 921 1,044 1,155 1,284 1,431 1,599 1,772<br />
Stormwater and Drainage 260 299 410 409 410 431 427 428 429 432 440<br />
Roads and Footpaths 7,396 7,082 7,327 7,579 7,807 8,138 8,447 8,710 9,032 9,414 9,703<br />
<strong>Community</strong> Services and Facilities 2,748 2,555 2,605 2,725 2,748 2,758 2,880 2,972 3,067 3,166 3,228<br />
Environment and Safety 4,286 4,480 4,642 4,796 4,903 5,081 5,232 5,385 5,568 5,753 5,946<br />
<strong>District</strong> Promotion 368 381 396 411 423 436 449 462 476 490 505<br />
Hanmer Springs Thermal Pools and Spa 9,632 9,572 10,004 10,305 10,923 11,257 11,591 12,283 12,656 13,044 13,840<br />
Governance 910 1,007 1,069 1,175 1,114 1,204 1,264 1,224 1,330 1,395 1,357<br />
Corporate Services 5,724 6,038 6,705 7,043 8,616 7,715 7,241 7,518 7,543 7,480 7,538<br />
36,432 36,683 38,626 40,247 43,294 43,708 44,488 46,309 47,828 49,332 51,150<br />
Less <strong>Council</strong> Overheads (4,700) (4,881) (5,035) (5,247) (5,348) (5,511) (5,661) (5,813) (6,044) (6,170) (6,354)<br />
Less Internal Interest Paid (1,971) (2,007) (2,241) (2,282) (2,447) (2,493) (2,607) (2,634) (2,618) (2,603) (2,556)<br />
Add Gains/(Losses) on Forestry Revaluation 0 277 13 (63) (1,465) (500) 168 (85) (48) 30 11<br />
29,761 30,072 31,362 32,655 34,034 35,205 36,388 37,778 39,118 40,589 42,250<br />
Reconciliation between Expenditure and Activity Summaries<br />
Water Supplies 4,288 4,548 4,762 4,847 5,029 5,110 5,241 5,447 5,545 5,649 5,943<br />
Sewerage 924 1,085 1,175 1,194 1,354 1,385 1,409 1,485 1,491 1,469 1,507<br />
Stormwater and Drainage 186 226 320 306 297 349 290 322 280 271 345<br />
Roads and Footpaths 6,308 6,299 6,726 6,866 6,970 7,450 7,595 7,698 8,259 8,439 8,572<br />
<strong>Community</strong> Services and Facilities 4,206 4,524 4,510 4,693 4,782 4,918 5,122 5,221 5,342 5,502 5,623<br />
Environment and Safety 4,335 4,505 4,662 4,833 4,914 5,103 5,225 5,400 5,554 5,763 5,923<br />
<strong>District</strong> Promotion 412 426 443 459 473 487 502 517 532 549 565<br />
Hanmer Springs Thermal Pools and Spa 8,092 8,540 8,992 9,284 9,519 9,734 9,928 10,165 10,434 10,744 11,038<br />
Governance 910 1,007 1,069 1,175 1,114 1,204 1,264 1,224 1,330 1,395 1,357<br />
Corporate Services 5,756 6,028 6,418 6,748 6,958 7,183 7,436 7,463 7,542 7,557 7,597<br />
35,419 37,188 39,076 40,406 41,410 42,924 44,013 44,941 46,308 47,337 48,470<br />
Less <strong>Council</strong> Overheads (4,700) (4,881) (5,035) (5,247) (5,348) (5,511) (5,661) (5,813) (6,044) (6,170) (6,354)<br />
Less Internal Interest Paid (1,971) (2,007) (2,241) (2,282) (2,447) (2,493) (2,607) (2,634) (2,618) (2,603) (2,556)<br />
28,748 30,299 31,800 32,878 33,616 34,920 35,744 36,495 37,645 38,564 39,560<br />
Annual <strong>Plan</strong> Year 1 Year 2 Year 3 Year 4 Year 5 Year 6 Year 7 Year 8 Year 9 Year 10<br />
2011/<strong>2012</strong> <strong>2012</strong>/2013 2013/2014 2014/2015 2015/2016 2016/2017 2017/2018 2018/2019 2019/2020 2020/2021 2021/<strong>2022</strong><br />
($000) ($000) ($000) ($000) ($000) ($000) ($000) ($000) ($000) ($000) ($000)<br />
Equity at the start of the year 309,178 319,904 341,694 346,195 351,857 376,852 381,828 388,665 419,540 426,857 436,936<br />
Add Total Comprehensive Income for Year 1,014 21,789 4,501 5,663 24,994 4,976 6,838 30,876 7,316 10,080 37,595<br />
Equity at the end of the year 310,192 341,694 346,195 351,858 376,852 381,828 388,666 419,540 426,857 436,936 474,531<br />
C:\Users\jab\Desktop\Fuck Up with Subsidised Roading\<strong>Hurunui</strong> <strong>District</strong> <strong>Council</strong> LTP Budgets <strong>2012</strong>-<strong>2022</strong> - Post Submissions - with Option 2 for Subsidised Roading.xls 27/06/<strong>2012</strong> 2:19 p.m.<br />
162
Annual <strong>Plan</strong> Year 1 Year 2 Year 3 Year 4 Year 5 Year 6 Year 7 Year 8 Year 9 Year 10<br />
2011/<strong>2012</strong> <strong>2012</strong>/2013 2013/2014 2014/2015 2015/2016 2016/2017 2017/2018 2018/2019 2019/2020 2020/2021 2021/<strong>2022</strong><br />
($000) ($000) ($000) ($000) ($000) ($000) ($000) ($000) ($000) ($000) ($000)<br />
Public Equity<br />
Accumulated General Reserves 148,940 177,730 178,413 179,880 180,772 181,040 181,025 180,255 179,841 179,100 179,140<br />
Reserve Funds 1,970 (21,804) (22,923) (24,613) (25,087) (25,071) (24,413) (22,360) (20,474) (17,707) (15,057)<br />
Asset Revaluation Reserves 159,282 185,768 190,705 196,592 221,166 225,858 232,053 261,645 267,489 275,543 310,449<br />
Total Public Equity 310,192 341,694 346,195 351,858 376,852 381,828 388,666 419,540 426,857 436,936 474,531<br />
Current Assets<br />
Cash & Cash Equivalents 181 435 413 295 338 482 167 348 241 92 370<br />
Accounts Receivable 1,455 1,822 1,879 1,936 1,997 2,062 2,121 2,181 2,251 2,326 2,403<br />
Inventories 171 167 173 178 184 190 195 201 207 214 221<br />
Other current assets 470 385 397 409 422 435 448 460 475 491 507<br />
2,277 2,809 2,861 2,817 2,941 3,169 2,930 3,190 3,173 3,123 3,501<br />
Non-Current Assets<br />
Operational Assets 30,973 43,769 45,453 45,504 45,635 46,910 47,062 47,091 48,576 48,665 48,740<br />
Restricted Assets 36,904 36,644 40,942 40,666 42,719 46,663 45,845 44,909 48,993 47,998 47,015<br />
Infrastructural Assets 255,653 279,401 279,528 287,192 312,018 312,730 319,464 349,240 349,242 357,454 393,278<br />
Intangible Assets 41 54 36 25 16 12 8 5 4 3 3<br />
Forestry Assets 2,182 2,489 2,502 2,438 973 473 642 557 509 538 549<br />
Investments in <strong>Council</strong> Controlled Organisations 269 269 269 269 269 269 269 269 269 269 269<br />
Other Financial Assets 56 61 61 61 61 61 61 61 61 61 61<br />
Investments 0 0 0 0 0 0 0 0 0 0 0<br />
326,078 362,688 368,791 376,154 401,691 407,117 413,351 442,131 447,654 454,989 489,915<br />
Total Assets 328,355 365,496 371,653 378,972 404,632 410,286 416,281 445,321 450,827 458,112 493,416<br />
Current Liabilities<br />
Accounts Payable 4,504 3,102 3,199 3,296 3,401 3,511 3,610 3,714 3,832 3,960 4,091<br />
Non Current Portion of <strong>Term</strong> Debt 0 0 0 0 0 1,000 2,000 2,000 3,000 2,500 0<br />
Other Current Liabilities 8 1,858 1,916 1,974 2,037 2,103 2,163 2,224 2,295 2,372 2,451<br />
4,512 4,960 5,115 5,270 5,437 6,614 7,773 7,938 9,127 8,832 6,542<br />
Non Current Liabilities<br />
<strong>Term</strong> Debt 13,500 18,500 20,000 21,500 22,000 21,500 19,500 17,500 14,500 12,000 12,000<br />
Other Non Current Liabilities 151 343 343 343 343 343 343 343 343 343 343<br />
13,651 18,843 20,343 21,843 22,343 21,843 19,843 17,843 14,843 12,343 12,343<br />
Total Liabilities 18,163 23,803 25,458 27,113 27,780 28,457 27,616 25,781 23,970 21,175 18,885<br />
Net Assets 310,192 341,694 346,195 351,858 376,851 381,829 388,665 419,540 426,857 436,937 474,531<br />
<strong>Hurunui</strong> <strong>Community</strong> <strong>Long</strong> <strong>Term</strong> <strong>Plan</strong> <strong>2012</strong> - <strong>2022</strong><br />
C:\Users\jab\Desktop\Fuck Up with Subsidised Roading\<strong>Hurunui</strong> <strong>District</strong> <strong>Council</strong> LTP Budgets <strong>2012</strong>-<strong>2022</strong> - Post Submissions - with Option 2 for Subsidised Roading.xls 27/06/<strong>2012</strong> 2:25 p.m.<br />
163
www.hurunui.govt.nz<br />
Forecast Statement of Cash Flows<br />
Annual <strong>Plan</strong> Year 1 Year 2 Year 3 Year 4 Year 5 Year 6 Year 7 Year 8 Year 9 Year 10<br />
2011/<strong>2012</strong> <strong>2012</strong>/2013 2013/2014 2014/2015 2015/2016 2016/2017 2017/2018 2018/2019 2019/2020 2020/2021 2021/<strong>2022</strong><br />
($000) ($000) ($000) ($000) ($000) ($000) ($000) ($000) ($000) ($000) ($000)<br />
Cash Flows from Operating Activities<br />
Cash provided from:<br />
Rates 12,723 13,630 14,473 15,311 15,862 16,536 17,126 17,646 18,428 19,193 19,912<br />
Hanmer Springs Thermal Reserve 9,632 9,572 10,004 10,305 10,923 11,257 11,591 12,283 12,656 13,044 13,840<br />
Other Income 6,634 6,230 6,503 6,723 8,319 7,413 6,995 7,407 7,527 7,739 7,968<br />
Dividends Received 33 72 74 77 79 82 84 86 89 92 95<br />
Money Received from Other Authorities 2,243 2,243 2,243 2,243 2,243 2,243 2,243 2,243 2,243 2,243 2,243<br />
31,265 31,747 33,297 34,658 37,426 37,530 38,040 39,666 40,943 42,312 44,057<br />
Cash paid to:<br />
Cost of Services 22,161 23,369 24,225 25,115 25,658 26,592 27,431 28,089 28,919 29,924 30,824<br />
Interest Paid 831 969 1,203 1,297 1,359 1,391 1,375 1,281 1,156 1,000 828<br />
Money paid to Other Authorities 2,243 2,243 2,243 2,243 2,243 2,243 2,243 2,243 2,243 2,243 2,243<br />
25,235 26,580 27,671 28,655 29,261 30,226 31,049 31,613 32,318 33,167 33,895<br />
Net Cash Flow from Operating Activities 6,030 5,167 5,626 6,003 8,166 7,304 6,991 8,053 8,625 9,145 10,162<br />
Cash Flows from Investing Activities<br />
Cash provided from:<br />
Sale of Fixed Assets 0 0 0 0 0 0 0 0 0 0 0<br />
Sale of Investments 0 0 0 0 0 0 0 0 0 0 0<br />
0 0 0 0 0 0 0 0 0 0 0<br />
Cash paid to:<br />
Purchase of Fixed Assets 6,218 10,545 7,147 7,622 8,622 7,661 6,306 5,872 6,732 6,293 7,384<br />
Purchase of Investments 0 0 0 0 0 0 0 0 0 0 0<br />
6,218 10,545 7,147 7,622 8,622 7,661 6,306 5,872 6,732 6,293 7,384<br />
Net Cash Flows from Investing Activities (6,218) (10,545) (7,147) (7,622) (8,622) (7,661) (6,306) (5,872) (6,732) (6,293) (7,384)<br />
Cash Flows from Financing Activities<br />
Cash provided from:<br />
Loans Raised 400 5,098 1,500 1,500 500 500 0 0 0 0 0<br />
400 5,098 1,500 1,500 500 500 0 0 0 0 0<br />
Cash paid to:<br />
Loan Repayments 0 0 0 0 0 0 1,000 2,000 2,000 3,000 2,500<br />
0 0 0 0 0 0 1,000 2,000 2,000 3,000 2,500<br />
Net Cash Flows from Financing Activities 400 5,098 1,500 1,500 500 500 (1,000) (2,000) (2,000) (3,000) (2,500)<br />
Net Increase/(Decrease) in Cash Held 212 (280) (22) (119) 44 143 (315) 181 (107) (149) 278<br />
Opening Cash Balance (31) 715 435 413 295 338 482 167 348 241 92<br />
Closing Cash Balance 181 435 413 295 338 482 167 348 241 92 370<br />
C:\Users\jab\Desktop\Fuck Up with Subsidised Roading\<strong>Hurunui</strong> <strong>District</strong> <strong>Council</strong> LTP Budgets <strong>2012</strong>-<strong>2022</strong> - Post Submissions - with Option 2 for Subsidised Roading.xls 27/06/<strong>2012</strong> 2:26 p.m.<br />
164
<strong>Hurunui</strong> <strong>Community</strong> <strong>Long</strong> <strong>Term</strong> <strong>Plan</strong> <strong>2012</strong> - <strong>2022</strong><br />
Forecast Statement of Cash Flows Reconciliation<br />
Annual <strong>Plan</strong> Year 1 Year 2 Year 3 Year 4 Year 5 Year 6 Year 7 Year 8 Year 9 Year 10<br />
2011/<strong>2012</strong> <strong>2012</strong>/2013 2013/2014 2014/2015 2015/2016 2016/2017 2017/2018 2018/2019 2019/2020 2020/2021 2021/<strong>2022</strong><br />
($000) ($000) ($000) ($000) ($000) ($000) ($000) ($000) ($000) ($000) ($000)<br />
Net Surplus/(Deficit) after tax 1,014 (227) (436) (222) 418 285 643 1,283 1,472 2,025 2,690<br />
Non Cash Items:<br />
Vested Assets (646) (218) (227) (234) (242) (339) (352) (366) (382) (399) (332)<br />
Gain/Loss on Forestry Valuation 0 (277) (13) 63 1,465 500 (168) 85 48 (30) (11)<br />
Depreciation 5,662 5,805 6,221 6,316 6,437 6,767 6,786 6,965 7,388 7,441 7,707<br />
5,016 5,309 5,981 6,145 7,660 6,927 6,266 6,684 7,055 7,013 7,364<br />
6,030 5,082 5,545 5,923 8,079 7,212 6,909 7,967 8,527 9,038 10,054<br />
Movements in Working Capital:<br />
(Increase)/Decrease in Accounts Receivable 0 60 57 58 61 65 59 61 69 75 78<br />
(Increase)/Decrease in Inventories 0 5 5 5 6 6 5 6 6 7 7<br />
(Increase)/Decrease in Other current assets 0 13 12 12 13 14 12 13 15 16 16<br />
Increase/(Decrease) in Accounts Payable 0 (102) (97) (97) (104) (111) (99) (103) (118) (128) (131)<br />
Increase/(Decrease) in Other Current Liabilities 0 (61) (58) (58) (63) (66) (60) (62) (71) (77) (79)<br />
0 (85) (81) (80) (87) (92) (82) (86) (98) (107) (108)<br />
Net Cash Flow from Operating 6,030 5,167 5,626 6,003 8,166 7,304 6,991 8,053 8,625 9,145 10,162<br />
C:\Users\jab\Desktop\Fuck Up with Subsidised Roading\<strong>Hurunui</strong> <strong>District</strong> <strong>Council</strong> LTP Budgets <strong>2012</strong>-<strong>2022</strong> - Post Submissions - with Option 2 for Subsidised Roading.xls 27/06/<strong>2012</strong> 2:26 p.m.<br />
165
www.hurunui.govt.nz<br />
Annual <strong>Plan</strong> Year 1 Year 2 Year 3 Year 4 Year 5 Year 6 Year 7 Year 8 Year 9 Year 10<br />
2011/<strong>2012</strong> <strong>2012</strong>/2013 2013/2014 2014/2015 2015/2016 2016/2017 2017/2018 2018/2019 2019/2020 2020/2021 2021/<strong>2022</strong><br />
($000) ($000) ($000) ($000) ($000) ($000) ($000) ($000) ($000) ($000) ($000)<br />
Water Supplies<br />
<strong>District</strong> Wide Water 97 33 34 35 36 51 53 55 57 60 50<br />
<strong>District</strong> Wide Water - Miox Treatment 0 758 0 0 0 0 0 0 0 0 0<br />
<strong>District</strong> Wide Water - Full Drinking Water Standards 0 0 0 0 0 0 0 0 0 0 0<br />
Amberley Water 15 262 10 279 142 449 109 0 0 0 0<br />
Leithfield Beach Water 8 0 0 0 0 0 0 0 0 0 0<br />
Ashley Rural Water 138 310 177 183 189 196 203 211 220 230 374<br />
Culverden Town Water 60 5 72 8 49 6 6 9 6 7 10<br />
Waiau Town Water 9 206 1 1 1 1 1 1 1 1 1<br />
Amuri Plains Water 0 5 5 5 5 5 5 6 6 6 6<br />
Balmoral Water 16 16 2 3 4 3 2 5 3 3 6<br />
Waiau Rural Water 26 24 24 18 18 19 20 21 139 22 23<br />
Cheviot Water 708 81 143 82 84 87 91 94 98 103 108<br />
Waipara Town Water 2 20 0 0 0 0 0 0 0 0 0<br />
Hanmer Springs Water 246 162 26 24 22 31 24 27 26 37 652<br />
Hawarden-Waikari Water 17 3 0 46 4 1 4 51 5 1 0<br />
<strong>Hurunui</strong> Rural Water 197 209 210 212 219 312 235 245 255 267 279<br />
1,536 2,092 704 894 775 1,161 752 725 817 736 1,509<br />
Broken down to:<br />
Growth Related Capital Expenditure 97 33 44 46 179 51 161 55 57 60 50<br />
Capital Expenditure to achieve Improved Levels of Service 302 1,534 82 24 24 25 26 27 29 30 31<br />
Renewals of Existing Assets 1,138 526 578 824 572 1,085 565 642 732 646 1,428<br />
1,536 2,092 704 894 775 1,161 752 725 817 736 1,509<br />
Sewerage<br />
<strong>District</strong> Wide Sewer 97 33 34 35 36 51 53 55 57 60 50<br />
Amberley Sewer 0 486 11 175 21 12 244 8 0 0 0<br />
Cheviot Sewer 10 40 0 11 78 0 0 36 0 0 0<br />
Greta Valley Sewer 3 19 2 20 2 2 2 2 3 3 3<br />
Motunau Beach Sewer 0 35 0 0 12 13 119 0 0 0 0<br />
Hanmer Springs Sewer 32 235 104 1,305 11 17 12 19 13 20 14<br />
Hawarden Sewer 8 0 0 5 0 142 0 0 0 0 0<br />
Waikari Sewer 0 71 0 0 8 0 35 7 0 0 0<br />
149 919 151 1,551 168 237 465 128 73 83 67<br />
Broken down to:<br />
Growth Related Capital Expenditure 112 507 34 35 36 51 296 55 57 60 50<br />
Capital Expenditure to achieve Improved Levels of Service 5 101 94 1,385 78 104 0 0 0 0 0<br />
Renewals of Existing Assets 32 311 23 131 54 83 168 73 16 23 17<br />
149 919 151 1,551 168 237 465 128 73 83 67<br />
Stormwater and Drainage<br />
<strong>District</strong> Wide Stormwater 0 0 0 0 0 0 0 0 0 0 0<br />
Amberley Beach Foreshore Protection 0 0 0 0 0 0 0 0 0 0 0<br />
Amberley Stormwater 0 294 0 0 0 84 0 0 0 0 0<br />
Hanmer Springs Stormwater 0 0 62 0 0 69 0 0 0 0 85<br />
0 294 62 0 0 153 0 0 0 0 85<br />
Broken down to:<br />
Growth Related Capital Expenditure 0 100 0 0 0 0 0 0 0 0 0<br />
Capital Expenditure to achieve Improved Levels of Service 0 194 62 0 0 153 0 0 0 0 85<br />
Renewals of Existing Assets 0 0 0 0 0 0 0 0 0 0 0<br />
0 294 62 0 0 153 0 0 0 0 85<br />
C:\Users\jab\Desktop\Fuck Up with Subsidised Roading\<strong>Hurunui</strong> <strong>District</strong> <strong>Council</strong> LTP Budgets <strong>2012</strong>-<strong>2022</strong> - Post Submissions - with Option 2 for Subsidised Roading.xls 27/06/<strong>2012</strong> 3:54 p.m.<br />
166
<strong>Hurunui</strong> <strong>Community</strong> <strong>Long</strong> <strong>Term</strong> <strong>Plan</strong> <strong>2012</strong> - <strong>2022</strong><br />
Forecast Summary of Capital Expenditure (Cont'd)<br />
Annual <strong>Plan</strong> Year 1 Year 2 Year 3 Year 4 Year 5 Year 6 Year 7 Year 8 Year 9 Year 10<br />
2011/<strong>2012</strong> <strong>2012</strong>/2013 2013/2014 2014/2015 2015/2016 2016/2017 2017/2018 2018/2019 2019/2020 2020/2021 2021/<strong>2022</strong><br />
($000) ($000) ($000) ($000) ($000) ($000) ($000) ($000) ($000) ($000) ($000)<br />
Roads and Footpaths<br />
Subsidised Roading 3,916 3,426 3,561 3,679 3,806 4,004 4,157 4,325 4,509 4,715 4,873<br />
Special Purpose Roading 11 16 17 17 18 18 19 20 21 22 23<br />
Unsubsidised Roading 27 25 26 27 28 29 30 31 32 34 35<br />
Road Safety Programme 0 0 0 0 0 0 0 0 0 0 0<br />
Amberley Ward Roadside Construction 42 33 29 25 26 26 39 35 30 31 33<br />
Amuri Ward Roadside Construction 50 22 23 24 24 25 26 27 29 30 31<br />
Cheviot Ward Roadside Construction 26 30 31 32 33 35 36 37 39 41 43<br />
Glenmark Ward Roadside Construction 0 0 0 0 0 0 0 0 0 0 0<br />
Hanmer Springs Ward Roadside Construction 85 75 78 81 83 86 90 93 97 102 106<br />
<strong>Hurunui</strong> Ward Roadside Construction 16 16 17 17 18 18 19 20 21 22 23<br />
4,172 3,643 3,781 3,901 4,035 4,242 4,416 4,588 4,778 4,996 5,166<br />
Broken down to:<br />
Growth Related Capital Expenditure 453 153 159 164 170 237 246 256 267 279 233<br />
Capital Expenditure to achieve Improved Levels of Service (6) 70 73 75 78 81 84 87 91 95 99<br />
Renewals of Existing Assets 3,725 3,421 3,549 3,662 3,788 3,925 4,086 4,245 4,420 4,622 4,834<br />
4,172 3,643 3,781 3,901 4,035 4,242 4,416 4,588 4,778 4,996 5,166<br />
<strong>Community</strong> Services and Facilities<br />
<strong>Community</strong> Services<br />
- Library 93 65 68 70 72 75 78 81 84 88 92<br />
- <strong>Community</strong> Programmes 0 0 0 0 0 0 0 0 0 0 0<br />
- Grants 0 0 0 0 0 0 0 0 0 0 0<br />
- Amenities 0 0 0 0 0 0 0 0 0 0 0<br />
Property<br />
- Rental Property 20 0 31 0 0 0 0 0 0 0 0<br />
- Public Toilets 0 0 0 0 0 104 0 0 0 0 0<br />
- Medical Centres 0 0 0 0 0 1,151 0 0 0 0 0<br />
- Halls 15 25 2 206 2 2 2 2 3 3 3<br />
- Pools 0 2 2 2 2 2 2 2 3 3 3<br />
- Township Maintenance 12 89 26 21 21 21 34 22 256 25 26<br />
Reserves<br />
- <strong>District</strong> Reserves 72 72 74 117 1,230 82 86 89 93 97 102<br />
- Cemeteries 5 5 130 5 6 6 6 6 6 7 7<br />
- Amberley Reserves 18 20 83 11 11 12 24 37 278 14 14<br />
- Amuri Reserves 8 9 9 9 9 16 10 11 11 12 19<br />
- Cheviot Reserves 0 0 0 0 0 0 0 0 0 0 0<br />
- Glenmark Reserves 0 0 0 0 0 0 0 0 0 0 0<br />
- Hanmer Springs Reserves 12 110 10 11 1,088 12 131 12 13 14 14<br />
- <strong>Hurunui</strong> Reserves 0 0 0 0 0 0 0 0 0 0 0<br />
- Self Funded Reserves 0 45 0 0 0 0 0 0 0 0 0<br />
255 441 436 452 2,442 1,482 373 263 746 261 280<br />
Broken down to:<br />
Growth Related Capital Expenditure 16 55 151 27 1,105 29 161 31 536 34 35<br />
Capital Expenditure to achieve Improved Levels of Service 163 261 216 302 1,222 1,376 132 149 124 136 150<br />
Renewals of Existing Assets 78 125 70 123 114 77 80 83 87 91 95<br />
256 441 436 452 2,442 1,482 373 263 746 261 280<br />
C:\Users\jab\Desktop\Fuck Up with Subsidised Roading\<strong>Hurunui</strong> <strong>District</strong> <strong>Council</strong> LTP Budgets <strong>2012</strong>-<strong>2022</strong> - Post Submissions - with Option 2 for Subsidised Roading.xls 27/06/<strong>2012</strong> 3:54 p.m.<br />
167
www.hurunui.govt.nz<br />
Forecast Summary of Capital Expenditure (Cont'd)<br />
Annual <strong>Plan</strong> Year 1 Year 2 Year 3 Year 4 Year 5 Year 6 Year 7 Year 8 Year 9 Year 10<br />
2011/<strong>2012</strong> <strong>2012</strong>/2013 2013/2014 2014/2015 2015/2016 2016/2017 2017/2018 2018/2019 2019/2020 2020/2021 2021/<strong>2022</strong><br />
($000) ($000) ($000) ($000) ($000) ($000) ($000) ($000) ($000) ($000) ($000)<br />
Environment and Safety<br />
Emergency Services<br />
- Civil Defence 44 50 26 27 0 0 30 0 0 34 0<br />
- Rural Fire Control 63 184 94 32 133 104 108 0 0 0 0<br />
Resource Management & <strong>Plan</strong>ning<br />
- Resource Management 0 0 26 0 0 29 0 0 32 0 0<br />
- Subdivision Inspection 26 0 0 27 0 0 30 0 0 34 0<br />
Compliance & Regulatory Functions<br />
- Building Control 0 0 26 27 0 29 30 0 32 34 0<br />
- Public Health 0 0 26 0 0 29 0 0 32 0 0<br />
- Liquor Licensing 0 0 0 0 0 0 0 0 0 0 0<br />
- Animal Control 0 0 0 0 0 0 0 0 0 0 0<br />
Waste Management<br />
- Transfer Stations 0 0 0 0 0 0 0 0 0 0 0<br />
- Litter Bin Collection 0 0 0 0 0 0 0 0 0 0 0<br />
- Refuse Collection 0 0 0 0 0 0 0 0 0 0 0<br />
133 234 197 113 133 190 197 0 97 102 0<br />
Broken down to:<br />
Growth Related Capital Expenditure 0 0 0 0 0 0 0 0 0 0 0<br />
Capital Expenditure to achieve Improved Levels of Service 5 50 26 0 0 0 0 0 0 0 0<br />
Renewals of Existing Assets 128 184 171 113 133 190 197 0 97 102 0<br />
133 234 197 113 133 190 197 0 97 102 0<br />
<strong>District</strong> Promotion<br />
Tourism 0 0 0 0 0 0 0 0 0 0 0<br />
0 0 0 0 0 0 0 0 0 0 0<br />
Broken down to:<br />
Growth Related Capital Expenditure 0 0 0 0 0 0 0 0 0 0 0<br />
Capital Expenditure to achieve Improved Levels of Service 0 0 0 0 0 0 0 0 0 0 0<br />
Renewals of Existing Assets 0 0 0 0 0 0 0 0 0 0 0<br />
0 0 0 0 0 0 0 0 0 0 0<br />
Hanmer Springs Thermal Pools and Spa<br />
Hanmer Springs Thermal Pools & Spa 200 2,650 1,455 644 944 115 119 124 130 136 142<br />
200 2,650 1,455 644 944 115 119 124 130 136 142<br />
Broken down to:<br />
Growth Related Capital Expenditure 0 0 0 0 0 0 0 0 0 0 0<br />
Capital Expenditure to achieve Improved Levels of Service 0 2,550 1,351 537 833 0 0 0 0 0 0<br />
Renewals of Existing Assets 200 100 104 107 111 115 119 124 130 136 142<br />
200 2,650 1,455 644 944 115 119 124 130 136 142<br />
C:\Users\jab\Desktop\Fuck Up with Subsidised Roading\<strong>Hurunui</strong> <strong>District</strong> <strong>Council</strong> LTP Budgets <strong>2012</strong>-<strong>2022</strong> - Post Submissions - with Option 2 for Subsidised Roading.xls 27/06/<strong>2012</strong> 3:54 p.m.<br />
168
<strong>Hurunui</strong> <strong>Community</strong> <strong>Long</strong> <strong>Term</strong> <strong>Plan</strong> <strong>2012</strong> - <strong>2022</strong><br />
Forecast Summary of Capital Expenditure (Cont'd)<br />
Annual <strong>Plan</strong> Year 1 Year 2 Year 3 Year 4 Year 5 Year 6 Year 7 Year 8 Year 9 Year 10<br />
2011/<strong>2012</strong> <strong>2012</strong>/2013 2013/2014 2014/2015 2015/2016 2016/2017 2017/2018 2018/2019 2019/2020 2020/2021 2021/<strong>2022</strong><br />
($000) ($000) ($000) ($000) ($000) ($000) ($000) ($000) ($000) ($000) ($000)<br />
Governance<br />
Governance 0 0 36 0 0 40 0 0 45 0 0<br />
<strong>Hurunui</strong> - Waiau Water Zone Committee 0 0 0 0 0 0 0 0 0 0 0<br />
0 0 36 0 0 40 0 0 45 0 0<br />
Broken down to:<br />
Growth Related Capital Expenditure 0 0 0 0 0 0 0 0 0 0 0<br />
Capital Expenditure to achieve Improved Levels of Service 0 0 0 0 0 0 0 0 0 0 0<br />
Renewals of Existing Assets 0 0 36 0 0 40 0 0 45 0 0<br />
0 0 36 0 0 40 0 0 45 0 0<br />
Corporate Services<br />
Treasury 0 0 0 0 0 0 0 0 0 0 0<br />
Forestry 0 0 0 0 0 0 0 0 0 0 0<br />
<strong>Council</strong> Offices & Depots 32 160 208 0 0 0 0 0 0 0 0<br />
Information Services 136 120 125 129 133 138 143 149 156 163 170<br />
Support Services 0 0 0 0 0 0 0 0 0 0 0<br />
Human Resources & Policy 0 0 0 0 0 0 0 0 0 0 0<br />
Financial Services 0 0 0 0 0 0 0 0 0 0 0<br />
CEO Department 0 0 26 0 0 29 0 0 32 0 0<br />
Engineering Services 219 210 166 172 233 184 191 261 207 217 298<br />
Environmental Services 0 0 26 0 0 29 0 0 32 0 0<br />
387 490 551 301 367 380 334 410 428 379 468<br />
Broken down to:<br />
Growth Related Capital Expenditure 0 0 0 0 0 0 0 0 0 0 0<br />
Capital Expenditure to achieve Improved Levels of Service 105 150 213 5 6 6 6 6 6 7 7<br />
Renewals of Existing Assets 280 340 338 295 361 374 328 404 421 373 461<br />
386 490 551 301 367 380 334 410 428 379 468<br />
Total Capital Expenditure<br />
Water Supplies 1,536 2,092 704 894 775 1,161 752 725 817 736 1,509<br />
Sewerage 149 919 151 1,551 168 237 465 128 73 83 67<br />
Stormwater and Drainage 0 294 62 0 0 153 0 0 0 0 85<br />
Roads and Footpaths 4,172 3,643 3,781 3,901 4,035 4,242 4,416 4,588 4,778 4,996 5,166<br />
<strong>Community</strong> Services and Facilities 255 441 436 452 2,442 1,482 373 263 746 261 280<br />
Environment and Safety 133 234 197 113 133 190 197 0 97 102 0<br />
<strong>District</strong> Promotion 0 0 0 0 0 0 0 0 0 0 0<br />
Hanmer Springs Thermal Pools and Spa 200 2,650 1,455 644 944 115 119 124 130 136 142<br />
Governance 0 0 36 0 0 40 0 0 45 0 0<br />
Corporate Services 387 490 551 301 367 380 334 410 428 379 468<br />
6,832 10,763 7,374 7,856 8,864 8,000 6,657 6,239 7,114 6,693 7,717<br />
Broken down to:<br />
Growth Related Capital Expenditure 678 847 388 272 1,490 368 865 397 917 433 368<br />
Capital Expenditure to achieve Improved Levels of Service 574 4,909 2,116 2,329 2,241 1,744 248 269 250 268 372<br />
Renewals of Existing Assets 5,580 5,007 4,870 5,255 5,134 5,888 5,544 5,572 5,947 5,992 6,977<br />
6,832 10,763 7,374 7,856 8,864 8,000 6,657 6,239 7,114 6,693 7,717<br />
C:\Users\jab\Desktop\Fuck Up with Subsidised Roading\<strong>Hurunui</strong> <strong>District</strong> <strong>Council</strong> LTP Budgets <strong>2012</strong>-<strong>2022</strong> - Post Submissions - with Option 2 for Subsidised Roading.xls 27/06/<strong>2012</strong> 3:54 p.m.<br />
169
www.hurunui.govt.nz<br />
Forecast Summary of Depreciation and Amortisation Expenses<br />
Annual <strong>Plan</strong> Year 1 Year 2 Year 3 Year 4 Year 5 Year 6 Year 7 Year 8 Year 9 Year 10<br />
2011/<strong>2012</strong> <strong>2012</strong>/2013 2013/2014 2014/2015 2015/2016 2016/2017 2017/2018 2018/2019 2019/2020 2020/2021 2021/<strong>2022</strong><br />
($000) ($000) ($000) ($000) ($000) ($000) ($000) ($000) ($000) ($000) ($000)<br />
Water Supplies 850 932 967 959 1,064 1,055 1,058 1,161 1,148 1,138 1,316<br />
Sewerage 320 366 373 368 408 415 411 457 450 441 491<br />
Stormwater and Drainage 17 46 49 49 54 53 54 60 59 58 65<br />
Roads and Footpaths 2,900 2,863 3,182 3,191 3,202 3,558 3,568 3,581 4,009 4,021 4,035<br />
<strong>Community</strong> Services and Facilities 351 398 400 460 485 487 517 519 521 542 544<br />
Environment and Safety 108 107 111 114 115 116 118 119 121 123 125<br />
<strong>District</strong> Promotion 6 8 4 4 4 4 4 4 4 4 4<br />
Hanmer Springs Thermal Pools and Spa 786 837 881 912 848 820 794 804 817 849 861<br />
Governance 0 6 9 9 9 10 10 10 10 10 10<br />
Corporate Services 325 242 244 247 248 248 250 251 251 255 254<br />
5,662 5,805 6,221 6,315 6,437 6,767 6,785 6,965 7,388 7,441 7,706<br />
C:\Users\jab\Desktop\Fuck Up with Subsidised Roading\<strong>Hurunui</strong> <strong>District</strong> <strong>Council</strong> LTP Budgets <strong>2012</strong>-<strong>2022</strong> - Post Submissions - with Option 2 for Subsidised Roading.xls 27/06/<strong>2012</strong> 2:28 p.m.<br />
170
Funding Impact Statement (and Rates System)<br />
<strong>Hurunui</strong> <strong>Community</strong> <strong>Long</strong> <strong>Term</strong> <strong>Plan</strong> <strong>2012</strong> - <strong>2022</strong><br />
Introduction<br />
The funding impact statement for the <strong>Council</strong> as a whole and the<br />
groups of activities, in accordance with section 5 of schedule 10<br />
of the Local Government Act 2002 and the Local Government<br />
(Financial Reporting) Regulations 201, are presented in this<br />
section.<br />
These Funding Impact Statements do not comply with Generally<br />
Accepted Accounting Practice (GAAP) as they do not recognise<br />
depreciation and movements in the valuation of assets and also<br />
they do not show capital income (Subsidies and Development<br />
Contributions) as operating income. On each Funding Impact<br />
Statement, a reconciliation between the surplus/(deficit) as<br />
per the relevant financial summary and the surplus/(deficit) of<br />
operating funding has been presented.<br />
In addition to the legislation stated above, the funding impact<br />
statement has been prepared in accordance with clause 15 of<br />
schedule 10 of the Local Government Act 2002. It must set out<br />
the following:<br />
• The revenue and financing mechanisms used;<br />
• An indicative level or amount of funding for each<br />
mechanism;<br />
• Explanatory information supporting the use of general<br />
and targeted rates;<br />
• A summary of the total rates requirement;<br />
• Subsidies, grants and contributions; and<br />
• Revenue and funding mechanisms.<br />
The funding mechanisms described in the funding impact<br />
statement apply for the entire period covered by the LTP. The<br />
Funding Impact Statement should be read in conjunction with<br />
the Revenue and Financing Policy (page 230) which describes<br />
how costs for services are collected.<br />
171
www.hurunui.govt.nz<br />
<strong>Hurunui</strong> <strong>District</strong> <strong>Council</strong> - Funding Impact Statement<br />
Annual <strong>Plan</strong> Year 1 Year 2 Year 3 Year 4 Year 5 Year 6 Year 7 Year 8 Year 9 Year 10<br />
2011/<strong>2012</strong> <strong>2012</strong>/2013 2013/2014 2014/2015 2015/2016 2016/2017 2017/2018 2018/2019 2019/2020 2020/2021 2021/<strong>2022</strong><br />
($000) ($000) ($000) ($000) ($000) ($000) ($000) ($000) ($000) ($000) ($000)<br />
Sources of operating funding<br />
General rates, uniform annual general charges, rates penalties 5,337 5,628 6,087 6,534 6,739 7,021 7,242 7,336 7,657 7,932 8,105<br />
Targeted rates - other than for water supply 6,992 7,627 7,987 8,352 8,673 9,038 9,380 9,776 10,206 10,662 11,173<br />
Subsidies and grants for operating purposes 1,728 1,563 1,612 1,661 1,713 1,770 1,820 1,872 1,931 1,996 2,062<br />
Fees, charges and targeted rates for water supply 446 444 471 500 527 556 586 618 652 688 726<br />
Interest and dividends from investments 33 72 74 77 79 82 84 86 89 92 95<br />
Local authorities fuel tax, fines, infringement fees, and other receipts 11,984 12,031 12,713 13,110 15,208 14,512 14,279 15,233 15,573 15,990 16,882<br />
Total operating funding 26,521 27,365 28,943 30,232 32,939 32,979 33,391 34,921 36,108 37,361 39,043<br />
Applications of operating funding<br />
Payments to staff and suppliers 22,982 23,526 24,375 25,265 25,820 26,763 27,585 28,248 29,101 30,122 31,026<br />
Finance costs 0 969 1,203 1,297 1,359 1,391 1,375 1,281 1,156 1,000 828<br />
Other operating funding applications 0 0 0 0 0 0 0 0 0 0 0<br />
Total applications of operating funding 22,982 24,494 25,578 26,562 27,179 28,154 28,960 29,530 30,257 31,122 31,854<br />
Surplus (deficit) of operating funding 3,539 2,871 3,365 3,670 5,760 4,825 4,431 5,392 5,851 6,239 7,189<br />
Sources of capital funding<br />
Subsidies and grants for capital expenditure 1,801 1,821 1,774 1,833 1,896 1,965 2,039 2,122 2,212 2,313 2,420<br />
Development and financial contributions 1,336 608 632 653 664 762 790 820 845 884 777<br />
Increase (decrease) in debt 505 4,265 834 1,783 815 998 (624) (1,256) (1,327) (2,030) (1,497)<br />
Gross proceed from sale of assets 0 0 0 0 0 0 0 0 0 0 0<br />
Lump sum contributions 0 0 0 0 0 0 0 0 0 0 0<br />
Total sources of capital funding 3,642 6,694 3,240 4,269 3,375 3,725 2,205 1,685 1,731 1,168 1,700<br />
Applications of capital funding<br />
Capital expenditure<br />
- to meet additional demand 677 848 387 272 1,489 368 865 397 917 433 368<br />
- to improve the level of service 640 4,909 2,116 2,329 2,241 1,744 248 269 250 268 372<br />
- to replace existing assets 5,548 5,007 4,870 5,255 5,134 5,888 5,544 5,572 5,947 5,992 6,977<br />
Increase (decrease) in reserves 317 (1,198) (768) 84 271 550 (21) 839 468 714 1,172<br />
Increase (decrease) of investments 0 0 0 0 0 0 0 0 0 0 0<br />
Total applications of capital funding 7,181 9,565 6,605 7,939 9,135 8,549 6,636 7,077 7,581 7,407 8,888<br />
Surplus (deficit) of capital funding (3,539) (2,871) (3,365) (3,670) (5,760) (4,825) (4,431) (5,392) (5,851) (6,239) (7,188)<br />
Funding balance 0 0 0 0 0 0 0 0 0 0 0<br />
Reconciliation between Financial Summary and Funding Impact Statement<br />
Total Comprehesive Income 1,014 21,789 4,501 5,663 24,994 4,976 6,838 30,876 7,316 10,080 37,595<br />
Add depreciation 5,662 5,805 6,221 6,315 6,437 6,767 6,785 6,965 7,388 7,441 7,706<br />
Less gains on asset revaluation 0 (22,017) (4,938) (5,885) (24,576) (4,692) (6,194) (29,592) (5,844) (8,055) (34,904)<br />
Less gains on forestry revaluation 0 (277) (13) 63 1,465 500 (168) 85 48 (30) (11)<br />
Less development and financial contributions (1,336) (608) (632) (653) (664) (762) (791) (820) (845) (884) (778)<br />
Less subsidies and grants for capital expenditure (1,801) (1,821) (1,774) (1,833) (1,896) (1,965) (2,039) (2,122) (2,212) (2,313) (2,420)<br />
Less increase in reserves 0 0 0 0 0 0 0 0 0 0 0<br />
Surplus (deficit) of operating funding 3,539 2,871 3,365 3,670 5,760 4,825 4,430 5,392 5,851 6,239 7,187<br />
C:\Users\jab\Desktop\Fuck Up with Subsidised Roading\<strong>Hurunui</strong> <strong>District</strong> <strong>Council</strong> LTP Budgets <strong>2012</strong>-<strong>2022</strong> - Post Submissions - with Option 2 for Subsidised Roading.xls 27/06/<strong>2012</strong> 2:38 p.m.<br />
172
Water Supplies - Group Activity Funding Impact Statement<br />
Annual <strong>Plan</strong> Year 1 Year 2 Year 3 Year 4 Year 5 Year 6 Year 7 Year 8 Year 9 Year 10<br />
2011/<strong>2012</strong> <strong>2012</strong>/2013 2013/2014 2014/2015 2015/2016 2016/2017 2017/2018 2018/2019 2019/2020 2020/2021 2021/<strong>2022</strong><br />
($000) ($000) ($000) ($000) ($000) ($000) ($000) ($000) ($000) ($000) ($000)<br />
Sources of operating funding<br />
General rates, uniform annual general charges, rates penalties 0 0 0 0 271 271 271 271 271 271 271<br />
Targeted rates - other than for water supply 3,420 3,773 3,986 4,208 4,360 4,518 4,609 4,779 4,956 5,141 5,333<br />
Subsidies and grants for operating purposes 0 0 0 0 0 0 0 0 0 0 0<br />
Fees, charges and targeted rates for water supply 446 444 471 500 527 556 586 618 652 688 726<br />
Internal charges and overheads recovered 10 9 6 7 7 18 45 74 104 133 171<br />
Local authorities fuel tax, fines, infringement fees, and other receipts 109 108 111 115 118 122 126 129 133 138 142<br />
Total operating funding 3,985 4,334 4,575 4,830 5,284 5,486 5,638 5,872 6,117 6,372 6,644<br />
Applications of operating funding<br />
Payments to staff and suppliers 2,178 2,396 2,471 2,547 2,611 2,697 2,773 2,852 2,942 3,041 3,141<br />
Finance costs 385 310 386 372 358 332 356 353 340 323 305<br />
Internal charges and overhead applied 874 909 938 969 996 1,026 1,054 1,082 1,115 1,147 1,181<br />
Other operating funding applications 0 0 0 0 0 0 0 0 0 0 0<br />
Total applications of operating funding 3,438 3,616 3,795 3,887 3,965 4,055 4,183 4,287 4,398 4,511 4,627<br />
Surplus (deficit) of operating funding 548 718 780 943 1,319 1,431 1,455 1,586 1,720 1,860 2,016<br />
Sources of capital funding<br />
Subsidies and grants for capital expenditure 0 114 0 0 0 0 0 0 0 0 0<br />
Development and financial contributions 351 130 135 140 144 158 165 171 178 187 177<br />
Increase (decrease) in debt 637 1,130 (210) (189) (417) (157) (596) (761) (810) (1,039) (413)<br />
Gross proceed from sale of assets 0 0 0 0 0 0 0 0 0 0 0<br />
Lump sum contributions 0 0 0 0 0 0 0 0 0 0 0<br />
Total sources of capital funding 988 1,373 (75) (49) (273) 1 (431) (590) (631) (853) (236)<br />
Applications of capital funding<br />
Capital expenditure<br />
- to meet additional demand 96 33 44 46 179 51 161 55 57 60 50<br />
- to improve the level of service 336 1,534 82 24 24 25 26 27 28 30 31<br />
- to replace existing assets 1,104 526 578 824 572 1,085 565 642 732 646 1,428<br />
Increase (decrease) in reserves 0 0 0 0 271 271 271 271 271 271 271<br />
Increase (decrease) of investments 0 0 0 0 0 0 0 0 0 0 0<br />
Total applications of capital funding 1,536 2,092 704 894 1,046 1,432 1,024 996 1,089 1,008 1,781<br />
Surplus (deficit) of capital funding (548) (718) (780) (942) (1,319) (1,431) (1,455) (1,586) (1,720) (1,860) (2,016)<br />
Funding balance 0 0 0 0 0 0 0 0 0 0 0<br />
<strong>Hurunui</strong> <strong>Community</strong> <strong>Long</strong> <strong>Term</strong> <strong>Plan</strong> <strong>2012</strong> - <strong>2022</strong><br />
Reconciliation between Financial Summary and Funding Impact Statement<br />
Operating Surplus/(Deficit) as per Financial Summary for<br />
Water 49 30 (52) 123 399 534 561 596 751 909 878<br />
Add depreciation 850 932 967 959 1,064 1,055 1,058 1,161 1,148 1,138 1,316<br />
Less development and financial contributions (351) (130) (135) (140) (144) (158) (165) (171) (178) (187) (177)<br />
Less subsidies and grants for capital expenditure 0 (114) 0 0 0 0 0 0 0 0 0<br />
Less increase in reserves 0 0 0 0 0 0 0 0 0 0 0<br />
Surplus (deficit) of operating funding 548 718 780 943 1,319 1,431 1,455 1,586 1,720 1,860 2,016<br />
H:\<strong>Long</strong> <strong>Term</strong> <strong>Plan</strong> Workings\<strong>Hurunui</strong> <strong>District</strong> <strong>Council</strong> LTP Budgets <strong>2012</strong>-<strong>2022</strong> - Post Submissions.xls 21/06/<strong>2012</strong> 10:07 a.m.<br />
173
www.hurunui.govt.nz<br />
Sewerage - Group Activity Funding Impact Statement<br />
Annual <strong>Plan</strong> Year 1 Year 2 Year 3 Year 4 Year 5 Year 6 Year 7 Year 8 Year 9 Year 10<br />
2011/<strong>2012</strong> <strong>2012</strong>/2013 2013/2014 2014/2015 2015/2016 2016/2017 2017/2018 2018/2019 2019/2020 2020/2021 2021/<strong>2022</strong><br />
($000) ($000) ($000) ($000) ($000) ($000) ($000) ($000) ($000) ($000) ($000)<br />
Sources of operating funding<br />
General rates, uniform annual general charges, rates penalties 0 0 0 0 0 0 0 0 0 0 0<br />
Targeted rates - other than for water supply 589 618 684 758 842 938 1,046 1,171 1,313 1,475 1,662<br />
Subsidies and grants for operating purposes 0 0 0 0 0 0 0 0 0 0 0<br />
Fees, charges and targeted rates for water supply 0 0 0 0 0 0 0 0 0 0 0<br />
Internal charges and overheads recovered 0 0 0 0 0 0 0 0 0 0 0<br />
Local authorities fuel tax, fines, infringement fees, and other receipts 0 0 0 0 0 0 0 0 0 0 0<br />
Total operating funding 589 618 684 759 843 938 1,047 1,171 1,313 1,476 1,662<br />
Applications of operating funding<br />
Payments to staff and suppliers 219 289 304 308 312 316 331 335 351 357 375<br />
Finance costs 254 293 360 374 486 501 511 534 524 501 466<br />
Internal charges and overhead applied 126 134 138 144 147 151 156 160 165 170 175<br />
Other operating funding applications 0 0 0 0 0 0 0 0 0 0 0<br />
Total applications of operating funding 599 716 802 825 945 969 998 1,028 1,041 1,028 1,016<br />
Surplus (deficit) of operating funding (10) (98) (118) (67) (103) (31) 49 143 272 448 647<br />
Sources of capital funding<br />
Subsidies and grants for capital expenditure 0 0 0 0 0 0 0 0 0 0 0<br />
Development and financial contributions 176 70 73 75 78 105 109 113 118 123 109<br />
Increase (decrease) in debt (16) 947 196 1,543 193 163 307 (128) (317) (488) (689)<br />
Gross proceed from sale of assets 0 0 0 0 0 0 0 0 0 0 0<br />
Lump sum contributions 0 0 0 0 0 0 0 0 0 0 0<br />
Total sources of capital funding 159 1,017 268 1,618 271 268 416 (15) (199) (365) (580)<br />
Applications of capital funding<br />
Capital expenditure<br />
- to meet additional demand 112 507 34 35 36 51 296 55 57 60 50<br />
- to improve the level of service 5 101 94 1,385 78 104 0 0 0 0 0<br />
- to replace existing assets 32 311 23 131 54 83 168 73 16 23 17<br />
Increase (decrease) in reserves 0 0 0 0 0 0 0 0 0 0 0<br />
Increase (decrease) of investments 0 0 0 0 0 0 0 0 0 0 0<br />
Total applications of capital funding 149 919 151 1,551 168 237 465 128 73 83 67<br />
Surplus (deficit) of capital funding 10 98 118 67 103 31 (49) (143) (272) (448) (647)<br />
Funding balance 0 0 0 0 0 0 0 0 0 0 0<br />
Reconciliation between Financial Summary and Funding Impact Statement<br />
Operating Surplus/(Deficit) as per Financial Summary for<br />
Sewer (154) (394) (418) (360) (433) (341) (254) (201) (60) 130 265<br />
Add depreciation 320 366 373 368 408 415 411 457 450 441 491<br />
Less development and financial contributions (176) (70) (73) (75) (78) (105) (109) (113) (118) (123) (109)<br />
Surplus (deficit) of operating funding (10) (98) (118) (67) (103) (31) 49 143 272 448 647<br />
H:\<strong>Long</strong> <strong>Term</strong> <strong>Plan</strong> Workings\<strong>Hurunui</strong> <strong>District</strong> <strong>Council</strong> LTP Budgets <strong>2012</strong>-<strong>2022</strong> - Post Submissions.xls 31/05/<strong>2012</strong> 9:39 a.m.<br />
174
<strong>Hurunui</strong> <strong>Community</strong> <strong>Long</strong> <strong>Term</strong> <strong>Plan</strong> <strong>2012</strong> - <strong>2022</strong><br />
Stormwater and Drainage - Group Activity Funding Impact Statement<br />
Annual <strong>Plan</strong> Year 1 Year 2 Year 3 Year 4 Year 5 Year 6 Year 7 Year 8 Year 9 Year 10<br />
2011/<strong>2012</strong> <strong>2012</strong>/2013 2013/2014 2014/2015 2015/2016 2016/2017 2017/2018 2018/2019 2019/2020 2020/2021 2021/<strong>2022</strong><br />
($000) ($000) ($000) ($000) ($000) ($000) ($000) ($000) ($000) ($000) ($000)<br />
Sources of operating funding<br />
General rates, uniform annual general charges, rates penalties 0 0 103 106 110 113 116 120 124 128 132<br />
Targeted rates - other than for water supply 218 279 286 281 278 286 280 275 271 267 277<br />
Subsidies and grants for operating purposes 0 0 0 0 0 0 0 0 0 0 0<br />
Fees, charges and targeted rates for water supply 0 0 0 0 0 0 0 0 0 0 0<br />
Internal charges and overheads recovered 0 0 0 0 0 0 0 0 0 0 0<br />
Local authorities fuel tax, fines, infringement fees, and other receipts 0 0 0 0 0 0 0 0 0 0 0<br />
Total operating funding 218 279 390 387 388 399 396 395 395 395 409<br />
Applications of operating funding<br />
Payments to staff and suppliers 20 59 138 127 123 186 126 166 134 140 221<br />
Finance costs 135 106 118 113 102 91 91 78 66 52 36<br />
Internal charges and overhead applied 11 13 13 14 14 15 15 15 17 16 17<br />
Other operating funding applications 0 0 0 0 0 0 0 0 0 0 0<br />
Total applications of operating funding 166 177 268 254 239 291 232 259 217 208 274<br />
Surplus (deficit) of operating funding 52 102 121 133 148 108 164 136 178 187 134<br />
Sources of capital funding<br />
Subsidies and grants for capital expenditure 0 0 0 0 0 0 0 0 0 0 0<br />
Development and financial contributions 39 17 18 18 19 27 28 29 30 32 26<br />
Increase (decrease) in debt (91) 175 (77) (151) (167) 18 (192) (165) (208) (219) (75)<br />
Gross proceed from sale of assets 0 0 0 0 0 0 0 0 0 0 0<br />
Lump sum contributions 0 0 0 0 0 0 0 0 0 0 0<br />
Total sources of capital funding (52) 192 (59) (133) (148) 45 (164) (136) (178) (187) (49)<br />
Applications of capital funding<br />
Capital expenditure<br />
- to meet additional demand 0 100 0 0 0 0 0 0 0 0 0<br />
- to improve the level of service 0 194 62 0 0 153 0 0 0 0 85<br />
- to replace existing assets 0 0 0 0 0 0 0 0 0 0 0<br />
Increase (decrease) in reserves 0 0 0 0 0 0 0 0 0 0 0<br />
Increase (decrease) of investments 0 0 0 0 0 0 0 0 0 0 0<br />
Total applications of capital funding 0 294 62 0 0 153 0 0 0 0 85<br />
Surplus (deficit) of capital funding (52) (102) (121) (133) (148) (108) (164) (136) (178) (187) (134)<br />
Funding balance 0 0 0 0 0 0 0 0 0 0 0<br />
Reconciliation between Financial Summary and Funding Impact Statement<br />
Operating Surplus/(Deficit) as per Financial Summary for<br />
Stormwater 74 73 90 102 113 82 137 106 149 161 95<br />
Add depreciation 17 46 49 49 54 53 54 60 59 58 65<br />
Less development and financial contributions (39) (17) (18) (18) (19) (27) (28) (29) (30) (32) (26)<br />
Surplus (deficit) of operating funding 52 102 121 133 148 108 164 136 178 187 134<br />
H:\<strong>Long</strong> <strong>Term</strong> <strong>Plan</strong> Workings\<strong>Hurunui</strong> <strong>District</strong> <strong>Council</strong> LTP Budgets <strong>2012</strong>-<strong>2022</strong> - Post Submissions.xls 31/05/<strong>2012</strong> 9:39 a.m.<br />
175
www.hurunui.govt.nz<br />
Roading and Footpaths - Group Activity Funding Impact Statement<br />
Annual <strong>Plan</strong> Year 1 Year 2 Year 3 Year 4 Year 5 Year 6 Year 7 Year 8 Year 9 Year 10<br />
2011/<strong>2012</strong> <strong>2012</strong>/2013 2013/2014 2014/2015 2015/2016 2016/2017 2017/2018 2018/2019 2019/2020 2020/2021 2021/<strong>2022</strong><br />
($000) ($000) ($000) ($000) ($000) ($000) ($000) ($000) ($000) ($000) ($000)<br />
Sources of operating funding<br />
General rates, uniform annual general charges, rates penalties 2,531 3,331 3,448 3,582 3,676 3,803 3,954 4,065 4,218 4,411 4,557<br />
Targeted rates - other than for water supply 0 181 183 183 189 196 215 218 220 225 235<br />
Subsidies and grants for operating purposes 1,728 1,563 1,612 1,661 1,713 1,770 1,820 1,872 1,931 1,996 2,062<br />
Fees, charges and targeted rates for water supply 0 0 0 0 0 0 0 0 0 0 0<br />
Internal charges and overheads recovered 731 0 0 0 0 0 0 0 0 0 0<br />
Local authorities fuel tax, fines, infringement fees, and other receipts 147 148 152 157 162 167 172 177 183 189 196<br />
Total operating funding 5,137 5,222 5,395 5,582 5,741 5,937 6,162 6,332 6,552 6,822 7,050<br />
Applications of operating funding<br />
Payments to staff and suppliers 2,784 2,836 2,924 3,034 3,107 3,209 3,324 3,393 3,501 3,644 3,737<br />
Finance costs 0 2 2 2 1 1 1 1 0 0 0<br />
Internal charges and overhead applied 622 598 618 639 659 682 703 723 748 774 800<br />
Other operating funding applications 0 0 0 0 0 0 0 0 0 0 0<br />
Total applications of operating funding 3,405 3,436 3,543 3,675 3,768 3,892 4,027 4,117 4,249 4,418 4,537<br />
Surplus (deficit) of operating funding 1,731 1,786 1,851 1,908 1,973 2,044 2,135 2,215 2,303 2,403 2,513<br />
Sources of capital funding<br />
Subsidies and grants for capital expenditure 1,801 1,707 1,774 1,833 1,896 1,965 2,039 2,122 2,212 2,313 2,420<br />
Development and financial contributions 453 153 159 164 170 237 246 256 267 279 233<br />
Increase (decrease) in debt 219 (3) (3) (3) (4) (4) (4) (4) (5) (0) (0)<br />
Gross proceed from sale of assets 0 0 0 0 0 0 0 0 0 0 0<br />
Lump sum contributions 0 0 0 0 0 0 0 0 0 0 0<br />
Total sources of capital funding 2,473 1,857 1,930 1,993 2,062 2,198 2,281 2,374 2,475 2,593 2,653<br />
Applications of capital funding<br />
Capital expenditure<br />
- to meet additional demand 453 153 159 164 170 237 246 256 267 279 233<br />
- to improve the level of service 27 70 73 75 78 81 84 87 91 95 99<br />
- to replace existing assets 3,725 3,421 3,549 3,662 3,788 3,925 4,086 4,245 4,420 4,622 4,834<br />
Increase (decrease) in reserves 0 0 0 0 0 0 0 0 0 0 0<br />
Increase (decrease) of investments 0 0 0 0 0 0 0 0 0 0 0<br />
Total applications of capital funding 4,205 3,643 3,781 3,901 4,035 4,242 4,416 4,588 4,778 4,996 5,166<br />
Surplus (deficit) of capital funding (1,731) (1,786) (1,851) (1,908) (1,973) (2,044) (2,135) (2,215) (2,303) (2,403) (2,513)<br />
Funding balance 0 0 0 0 0 (0) 0 0 0 0 0<br />
Reconciliation between Financial Summary and Funding Impact Statement<br />
Operating Surplus/(Deficit) as per Financial Summary for<br />
Roading and Footpaths 1,087 783 602 713 837 688 852 1,012 773 975 1,131<br />
Add depreciation 2,900 2,863 3,182 3,191 3,202 3,558 3,568 3,581 4,009 4,021 4,035<br />
Less development and financial contributions (453) (153) (159) (164) (170) (237) (246) (256) (267) (279) (233)<br />
Less subsidies and grants for capital expenditure (1,801) (1,707) (1,774) (1,833) (1,896) (1,965) (2,039) (2,122) (2,212) (2,313) (2,420)<br />
Surplus (deficit) of operating funding 1,733 1,786 1,851 1,908 1,973 2,044 2,135 2,215 2,303 2,403 2,513<br />
C:\Users\jab\Desktop\Fuck Up with Subsidised Roading\<strong>Hurunui</strong> <strong>District</strong> <strong>Council</strong> LTP Budgets <strong>2012</strong>-<strong>2022</strong> - Post Submissions - with Option 2 for Subsidised Roading.xls 27/06/<strong>2012</strong> 2:39 p.m.<br />
176
<strong>Community</strong> Services and Facilities - Group Activity Funding Impact Statement<br />
Annual <strong>Plan</strong> Year 1 Year 2 Year 3 Year 4 Year 5 Year 6 Year 7 Year 8 Year 9 Year 10<br />
2011/<strong>2012</strong> <strong>2012</strong>/2013 2013/2014 2014/2015 2015/2016 2016/2017 2017/2018 2018/2019 2019/2020 2020/2021 2021/<strong>2022</strong><br />
($000) ($000) ($000) ($000) ($000) ($000) ($000) ($000) ($000) ($000) ($000)<br />
Sources of operating funding<br />
General rates, uniform annual general charges, rates penalties 116 80 135 193 153 108 114 119 126 131 137<br />
Targeted rates - other than for water supply 1,490 1,445 1,487 1,512 1,549 1,597 1,678 1,734 1,792 1,845 1,900<br />
Subsidies and grants for operating purposes 0 0 0 0 0 0 0 0 0 0 0<br />
Fees, charges and targeted rates for water supply 0 0 0 0 0 0 0 0 0 0 0<br />
Internal charges and overheads recovered 0 0 0 0 0 0 0 0 0 0 0<br />
Local authorities fuel tax, fines, infringement fees, and other receipts 729 756 701 724 746 770 792 814 839 867 895<br />
Total operating funding 2,335 2,281 2,322 2,428 2,449 2,475 2,584 2,667 2,757 2,843 2,932<br />
Applications of operating funding<br />
Payments to staff and suppliers 2,603 2,831 2,798 2,898 2,951 3,006 3,103 3,189 3,286 3,396 3,508<br />
Finance costs 202 262 257 241 233 284 333 319 299 306 281<br />
Internal charges and overhead applied 955 998 1,020 1,053 1,067 1,092 1,116 1,139 1,178 1,197 1,227<br />
Other operating funding applications 0 0 0 0 0 0 0 0 0 0 0<br />
Total applications of operating funding 3,759 4,091 4,075 4,192 4,251 4,383 4,552 4,648 4,762 4,900 5,015<br />
Surplus (deficit) of operating funding (1,424) (1,810) (1,753) (1,764) (1,802) (1,907) (1,968) (1,981) (2,005) (2,057) (2,083)<br />
Sources of capital funding<br />
Subsidies and grants for capital expenditure 0 0 0 0 0 0 0 0 0 0 0<br />
Development and financial contributions 317 239 248 256 253 234 242 250 251 264 232<br />
Increase (decrease) in debt (243) 14 (130) 34 365 969 (145) (199) 14 (278) (311)<br />
Gross proceed from sale of assets 0 0 0 0 0 0 0 0 0 0 0<br />
Lump sum contributions 0 0 0 0 0 0 0 0 0 0 0<br />
Total sources of capital funding 74 252 118 290 619 1,203 97 51 265 (15) (79)<br />
Applications of capital funding<br />
Capital expenditure<br />
- to meet additional demand 16 55 151 27 1,105 29 161 31 536 34 35<br />
- to improve the level of service 162 261 216 302 1,222 1,376 132 149 124 136 150<br />
- to replace existing assets 77 125 70 123 114 77 80 83 87 91 95<br />
Increase (decrease) in reserves (1,605) (1,998) (2,071) (1,926) (3,626) (2,186) (2,244) (2,193) (2,486) (2,333) (2,442)<br />
Increase (decrease) of investments 0 0 0 0 0 0 0 0 0 0 0<br />
Total applications of capital funding (1,350) (1,557) (1,635) (1,474) (1,184) (704) (1,871) (1,930) (1,740) (2,071) (2,162)<br />
Surplus (deficit) of capital funding 1,424 1,810 1,753 1,764 1,802 1,907 1,968 1,981 2,005 2,057 2,083<br />
Funding balance 0 0 0 0 0 0 0 0 0 0 0<br />
<strong>Hurunui</strong> <strong>Community</strong> <strong>Long</strong> <strong>Term</strong> <strong>Plan</strong> <strong>2012</strong> - <strong>2022</strong><br />
Reconciliation between Financial Summary and Funding Impact Statement<br />
Operating Surplus/(Deficit) as per Financial Summary for<br />
<strong>Community</strong> Services and Facilities (1,458) (1,969) (1,905) (1,968) (2,034) (2,160) (2,243) (2,250) (2,275) (2,336) (2,396)<br />
Add depreciation 351 398 400 460 485 487 517 519 521 542 544<br />
Less development and financial contributions (317) (239) (248) (256) (253) (234) (242) (250) (251) (264) (232)<br />
Surplus (deficit) of operating funding (1,424) (1,810) (1,753) (1,764) (1,802) (1,907) (1,968) (1,981) (2,005) (2,057) (2,083)<br />
H:\<strong>Long</strong> <strong>Term</strong> <strong>Plan</strong> Workings\<strong>Hurunui</strong> <strong>District</strong> <strong>Council</strong> LTP Budgets <strong>2012</strong>-<strong>2022</strong> - Post Submissions.xls 31/05/<strong>2012</strong> 9:39 a.m.<br />
177
www.hurunui.govt.nz<br />
Environment and Safety - Group Activity Funding Impact Statement<br />
Annual <strong>Plan</strong> Year 1 Year 2 Year 3 Year 4 Year 5 Year 6 Year 7 Year 8 Year 9 Year 10<br />
2011/<strong>2012</strong> <strong>2012</strong>/2013 2013/2014 2014/2015 2015/2016 2016/2017 2017/2018 2018/2019 2019/2020 2020/2021 2021/<strong>2022</strong><br />
($000) ($000) ($000) ($000) ($000) ($000) ($000) ($000) ($000) ($000) ($000)<br />
Sources of operating funding<br />
General rates, uniform annual general charges, rates penalties 1,921 2,144 2,248 2,325 2,352 2,444 2,516 2,589 2,680 2,766 2,859<br />
Targeted rates - other than for water supply 1,001 1,046 1,064 1,100 1,136 1,176 1,213 1,251 1,294 1,339 1,386<br />
Subsidies and grants for operating purposes 0 0 0 0 0 0 0 0 0 0 0<br />
Fees, charges and targeted rates for water supply 0 0 0 0 0 0 0 0 0 0 0<br />
Internal charges and overheads recovered 0 0 0 0 0 0 0 0 0 0 0<br />
Local authorities fuel tax, fines, infringement fees, and other receipts 1,275 1,290 1,331 1,371 1,415 1,461 1,503 1,545 1,594 1,648 1,702<br />
Total operating funding 4,197 4,480 4,642 4,796 4,903 5,081 5,232 5,385 5,568 5,753 5,946<br />
Applications of operating funding<br />
Payments to staff and suppliers 3,431 3,673 3,800 3,934 3,992 4,149 4,241 4,387 4,499 4,678 4,802<br />
Finance costs 9 8 8 10 11 11 12 12 13 13 12<br />
Internal charges and overhead applied 695 717 742 776 796 827 854 881 922 948 984<br />
Other operating funding applications 0 0 0 0 0 0 0 0 0 0 0<br />
Total applications of operating funding 4,135 4,398 4,551 4,720 4,799 4,987 5,107 5,281 5,433 5,639 5,798<br />
Surplus (deficit) of operating funding 62 82 92 77 104 95 125 104 135 114 148<br />
Sources of capital funding<br />
Subsidies and grants for capital expenditure 0 0 0 0 0 0 0 0 0 0 0<br />
Development and financial contributions 0 0 0 0 0 0 0 0 0 0 0<br />
Increase (decrease) in debt (1) 2 19 14 11 9 6 2 (1) (5) (9)<br />
Gross proceed from sale of assets 0 0 0 0 0 0 0 0 0 0 0<br />
Lump sum contributions 0 0 0 0 0 0 0 0 0 0 0<br />
Total sources of capital funding (1) 2 19 14 11 9 6 2 (1) (5) (9)<br />
Applications of capital funding<br />
Capital expenditure<br />
- to meet additional demand 0 0 0 0 0 0 0 0 0 0 0<br />
- to improve the level of service 5 50 26 0 0 0 0 0 0 0 0<br />
- to replace existing assets 128 184 171 113 133 190 197 (0) 97 102 0<br />
Increase (decrease) in reserves (72) (150) (87) (23) (18) (86) (66) 106 37 8 139<br />
Increase (decrease) of investments 0 0 0 0 0 0 0 0 0 0 0<br />
Total applications of capital funding 61 84 110 90 115 104 131 106 134 109 139<br />
Surplus (deficit) of capital funding (62) (82) (92) (77) (104) (95) (125) (104) (135) (114) (148)<br />
Funding balance 0 0 0 0 0 0 0 0 0 0 0<br />
Reconciliation between Financial Summary and Funding Impact Statement<br />
Operating Surplus/(Deficit) as per Financial Summary for<br />
<strong>Community</strong> Services and Facilities (46) (25) (20) (37) (11) (22) 7 (15) 14 (9) 23<br />
Add depreciation 108 107 111 114 115 116 118 119 121 123 125<br />
Less development and financial contributions 0 0 0 0 0 0 0 0 0 0 0<br />
Surplus (deficit) of operating funding 62 82 92 77 104 95 125 104 135 114 148<br />
H:\<strong>Long</strong> <strong>Term</strong> <strong>Plan</strong> Workings\<strong>Hurunui</strong> <strong>District</strong> <strong>Council</strong> LTP Budgets <strong>2012</strong>-<strong>2022</strong> - Post Submissions.xls 31/05/<strong>2012</strong> 9:39 a.m.<br />
178
<strong>Hurunui</strong> <strong>Community</strong> <strong>Long</strong> <strong>Term</strong> <strong>Plan</strong> <strong>2012</strong> - <strong>2022</strong><br />
<strong>District</strong> Promotion - Group Activity Funding Impact Statement<br />
Annual <strong>Plan</strong> Year 1 Year 2 Year 3 Year 4 Year 5 Year 6 Year 7 Year 8 Year 9 Year 10<br />
2011/<strong>2012</strong> <strong>2012</strong>/2013 2013/2014 2014/2015 2015/2016 2016/2017 2017/2018 2018/2019 2019/2020 2020/2021 2021/<strong>2022</strong><br />
($000) ($000) ($000) ($000) ($000) ($000) ($000) ($000) ($000) ($000) ($000)<br />
Sources of operating funding<br />
General rates, uniform annual general charges, rates penalties 89 90 93 96 99 102 105 108 111 115 118<br />
Targeted rates - other than for water supply 275 286 297 309 319 328 338 348 359 369 380<br />
Subsidies and grants for operating purposes 0 0 0 0 0 0 0 0 0 0 0<br />
Fees, charges and targeted rates for water supply 0 0 0 0 0 0 0 0 0 0 0<br />
Internal charges and overheads recovered 0 0 0 0 0 0 0 0 0 0 0<br />
Local authorities fuel tax, fines, infringement fees, and other receipts 4 5 5 5 5 6 6 6 6 6 7<br />
Total operating funding 368 381 396 411 423 436 449 462 476 490 505<br />
Applications of operating funding<br />
Payments to staff and suppliers 394 416 436 452 466 480 494 509 524 541 557<br />
Finance costs 0 0 0 0 0 0 0 0 0 0 0<br />
Internal charges and overhead applied 13 3 4 4 4 4 4 4 4 5 5<br />
Other operating funding applications 0 0 0 0 0 0 0 0 0 0 0<br />
Total applications of operating funding 406 419 439 456 470 484 498 513 529 545 562<br />
Surplus (deficit) of operating funding (38) (38) (43) (45) (47) (48) (50) (51) (53) (55) (56)<br />
Sources of capital funding<br />
Subsidies and grants for capital expenditure 0 0 0 0 0 0 0 0 0 0 0<br />
Development and financial contributions 0 0 0 0 0 0 0 0 0 0 0<br />
Increase (decrease) in debt 0 0 0 0 (0) (0) (0) 0 0 (0) 0<br />
Gross proceed from sale of assets 0 0 0 0 0 0 0 0 0 0 0<br />
Lump sum contributions 0 0 0 0 0 0 0 0 0 0 0<br />
Total sources of capital funding 0 0 0 0 (0) (0) (0) 0 0 (0) 0<br />
Applications of capital funding<br />
Capital expenditure<br />
- to meet additional demand 0 0 0 0 0 0 0 0 0 0 0<br />
- to improve the level of service 0 0 0 0 0 0 0 0 0 0 0<br />
- to replace existing assets 0 0 0 0 0 0 0 0 0 0 0<br />
Increase (decrease) in reserves (38) (38) (43) (45) (47) (48) (50) (51) (53) (55) (56)<br />
Increase (decrease) of investments 0 0 0 0 0 0 0 0 0 0 0<br />
Total applications of capital funding (38) (38) (43) (45) (47) (48) (50) (51) (53) (55) (56)<br />
Surplus (deficit) of capital funding 38 38 43 45 47 48 50 51 53 55 56<br />
Funding balance 0 0 0 0 0 0 0 0 0 (0) 0<br />
Reconciliation between Financial Summary and Funding Impact Statement<br />
Operating Surplus/(Deficit) as per Financial Summary for<br />
Growth and Development (44) (45) (47) (49) (50) (52) (53) (55) (56) (58) (60)<br />
Add depreciation 6 8 4 4 4 4 4 4 4 4 4<br />
Surplus (deficit) of operating funding (38) (38) (43) (45) (47) (48) (50) (51) (53) (55) (56)<br />
H:\<strong>Long</strong> <strong>Term</strong> <strong>Plan</strong> Workings\<strong>Hurunui</strong> <strong>District</strong> <strong>Council</strong> LTP Budgets <strong>2012</strong>-<strong>2022</strong> - Post Submissions.xls 31/05/<strong>2012</strong> 9:39 a.m.<br />
179
www.hurunui.govt.nz<br />
Hanmer Springs Thermal Pools and Spa - Group Activity Funding Impact Statement<br />
Annual <strong>Plan</strong> Year 1 Year 2 Year 3 Year 4 Year 5 Year 6 Year 7 Year 8 Year 9 Year 10<br />
2011/<strong>2012</strong> <strong>2012</strong>/2013 2013/2014 2014/2015 2015/2016 2016/2017 2017/2018 2018/2019 2019/2020 2020/2021 2021/<strong>2022</strong><br />
($000) ($000) ($000) ($000) ($000) ($000) ($000) ($000) ($000) ($000) ($000)<br />
Sources of operating funding<br />
General rates, uniform annual general charges, rates penalties 0 0 0 0 0 0 0 0 0 0 0<br />
Targeted rates - other than for water supply 0 0 0 0 0 0 0 0 0 0 0<br />
Subsidies and grants for operating purposes 0 0 0 0 0 0 0 0 0 0 0<br />
Fees, charges and targeted rates for water supply 0 0 0 0 0 0 0 0 0 0 0<br />
Internal charges and overheads recovered 0 0 0 0 0 0 0 0 0 0 0<br />
Local authorities fuel tax, fines, infringement fees, and other receipts 9,632 9,572 10,004 10,305 10,923 11,257 11,591 12,283 12,656 13,044 13,840<br />
Total operating funding 9,632 9,572 10,004 10,305 10,923 11,257 11,591 12,283 12,656 13,044 13,840<br />
Applications of operating funding<br />
Payments to staff and suppliers 6,418 6,635 6,950 7,161 7,386 7,627 7,845 8,068 8,322 8,598 8,876<br />
Finance costs 761 936 1,027 1,074 1,147 1,147 1,147 1,147 1,147 1,147 1,147<br />
Internal charges and overhead applied 128 132 134 137 138 141 143 145 149 151 154<br />
Other operating funding applications 0 0 0 0 0 0 0 0 0 0 0<br />
Total applications of operating funding 7,307 7,704 8,111 8,372 8,671 8,914 9,135 9,360 9,618 9,896 10,177<br />
Surplus (deficit) of operating funding 2,325 1,869 1,893 1,933 2,252 2,343 2,457 2,923 3,038 3,149 3,663<br />
Sources of capital funding<br />
Subsidies and grants for capital expenditure 0 0 0 0 0 0 0 0 0 0 0<br />
Development and financial contributions 0 0 0 0 0 0 0 0 0 0 0<br />
Increase (decrease) in debt 0 2,000 1,039 537 833 0 0 0 0 0 0<br />
Gross proceed from sale of assets 0 0 0 0 0 0 0 0 0 0 0<br />
Lump sum contributions 0 0 0 0 0 0 0 0 0 0 0<br />
Total sources of capital funding 0 2,000 1,039 537 833 0 0 0 0 0 0<br />
Applications of capital funding<br />
Capital expenditure<br />
- to meet additional demand 0 0 0 0 0 0 0 0 0 0 0<br />
- to improve the level of service 0 2,550 1,351 537 833 0 0 0 0 0 0<br />
- to replace existing assets 200 100 104 107 111 115 119 124 130 136 142<br />
Increase (decrease) in reserves 2,125 1,219 1,477 1,826 2,141 2,228 2,337 2,799 2,909 3,013 3,522<br />
Increase (decrease) of investments 0 0 0 0 0 0 0 0 0 0 0<br />
Total applications of capital funding 2,325 3,869 2,932 2,470 3,085 2,343 2,457 2,923 3,038 3,149 3,663<br />
Surplus (deficit) of capital funding (2,325) (1,869) (1,893) (1,933) (2,252) (2,343) (2,457) (2,923) (3,038) (3,149) (3,663)<br />
Funding balance 0 0 0 0 0 0 0 0 0 0 0<br />
Reconciliation between Financial Summary and Funding Impact Statement<br />
Operating Surplus/(Deficit) as per Financial Summary for<br />
Hanmer Springs Thermal Pools and Spa 1,540 1,032 1,012 1,021 1,404 1,523 1,663 2,119 2,222 2,300 2,802<br />
Add depreciation 786 837 881 912 848 820 794 804 817 849 861<br />
Surplus (deficit) of operating funding 2,325 1,869 1,893 1,933 2,252 2,343 2,457 2,923 3,038 3,149 3,663<br />
H:\<strong>Long</strong> <strong>Term</strong> <strong>Plan</strong> Workings\<strong>Hurunui</strong> <strong>District</strong> <strong>Council</strong> LTP Budgets <strong>2012</strong>-<strong>2022</strong> - Post Submissions.xls 31/05/<strong>2012</strong> 9:39 a.m.<br />
180
<strong>Hurunui</strong> <strong>Community</strong> <strong>Long</strong> <strong>Term</strong> <strong>Plan</strong> <strong>2012</strong> - <strong>2022</strong><br />
Governance - Group Activity Funding Impact Statement<br />
Annual <strong>Plan</strong> Year 1 Year 2 Year 3 Year 4 Year 5 Year 6 Year 7 Year 8 Year 9 Year 10<br />
2011/<strong>2012</strong> <strong>2012</strong>/2013 2013/2014 2014/2015 2015/2016 2016/2017 2017/2018 2018/2019 2019/2020 2020/2021 2021/<strong>2022</strong><br />
($000) ($000) ($000) ($000) ($000) ($000) ($000) ($000) ($000) ($000) ($000)<br />
Sources of operating funding<br />
General rates, uniform annual general charges, rates penalties 882 991 1,052 1,158 1,096 1,186 1,245 1,205 1,310 1,374 1,336<br />
Targeted rates - other than for water supply 0 0 0 0 0 0 0 0 0 0 0<br />
Subsidies and grants for operating purposes 0 0 0 0 0 0 0 0 0 0 0<br />
Fees, charges and targeted rates for water supply 0 0 0 0 0 0 0 0 0 0 0<br />
Internal charges and overheads recovered 0 0 0 0 0 0 0 0 0 0 0<br />
Local authorities fuel tax, fines, infringement fees, and other receipts 28 16 17 17 18 18 19 19 20 20 21<br />
Total operating funding 910 1,007 1,069 1,175 1,114 1,204 1,264 1,224 1,330 1,395 1,357<br />
Applications of operating funding<br />
Payments to staff and suppliers 644 676 723 788 741 817 863 810 866 947 892<br />
Finance costs 0 0 0 0 0 0 0 0 0 0 0<br />
Internal charges and overhead applied 266 325 336 378 363 377 391 404 453 438 455<br />
Other operating funding applications 0 0 0 0 0 0 0 0 0 0 0<br />
Total applications of operating funding 910 1,001 1,059 1,166 1,104 1,194 1,254 1,214 1,319 1,384 1,347<br />
Surplus (deficit) of operating funding 0 6 9 9 9 10 10 10 10 10 10<br />
Sources of capital funding<br />
Subsidies and grants for capital expenditure 0 0 0 0 0 0 0 0 0 0 0<br />
Development and financial contributions 0 0 0 0 0 0 0 0 0 0 0<br />
Increase (decrease) in debt 0 0 0 0 0 0 0 0 0 0 0<br />
Gross proceed from sale of assets 0 0 0 0 0 0 0 0 0 0 0<br />
Lump sum contributions 0 0 0 0 0 0 0 0 0 0 0<br />
Total sources of capital funding 0 0 0 0 0 0 0 0 0 0 0<br />
Applications of capital funding<br />
Capital expenditure<br />
- to meet additional demand 0 0 0 0 0 0 0 0 0 0 0<br />
- to improve the level of service 0 0 0 0 0 0 0 0 0 0 0<br />
- to replace existing assets 0 0 36 0 0 40 0 0 45 0 0<br />
Increase (decrease) in reserves 0 6 (27) 9 9 (30) 10 10 (35) 10 10<br />
Increase (decrease) of investments 0 0 0 0 0 0 0 0 0 0 0<br />
Total applications of capital funding 0 6 9 9 9 10 10 10 10 10 10<br />
Surplus (deficit) of capital funding 0 (6) (9) (9) (9) (10) (10) (10) (10) (10) (10)<br />
Funding balance 0 0 (0) 0 0 (0) (0) 0 0 0 (0)<br />
Reconciliation between Financial Summary and Funding Impact Statement<br />
Operating Surplus/(Deficit) as per Financial Summary for<br />
Hanmer Springs Thermal Pools and Spa 910 1,007 1,069 1,175 1,114 1,204 1,264 1,224 1,330 1,395 1,357<br />
Add depreciation 266 325 336 378 363 377 391 404 453 438 455<br />
Surplus (deficit) of operating funding 1,176 1,331 1,405 1,554 1,477 1,581 1,655 1,628 1,783 1,833 1,812<br />
H:\<strong>Long</strong> <strong>Term</strong> <strong>Plan</strong> Workings\<strong>Hurunui</strong> <strong>District</strong> <strong>Council</strong> LTP Budgets <strong>2012</strong>-<strong>2022</strong> - Post Submissions.xls 31/05/<strong>2012</strong> 9:39 a.m.<br />
181
www.hurunui.govt.nz<br />
Rates System<br />
<strong>District</strong> Wide Rates - General Rate & Uniform Annual General Charge<br />
A portion of the general rate requirement will be collected<br />
by way of a General Rate which will be set under section 13<br />
of the Local Government (Rating) Act 2002 and be applied<br />
to all rateable land based on the capital value of the land. No<br />
differential has been included for the collection of the General<br />
Rate.<br />
The remainder of the General Rate Requirement will be<br />
collected by way of a Uniform Annual General Charge which<br />
will be set under section 15 of the Local Government (Rating)<br />
Act 2002 and be applied as a fixed amount per separately used<br />
or inhabited part of the rating unit (Separately used or inhabited<br />
part of a property or building includes any part of a rating unit<br />
inhabited or used by a person other than the owners, and who<br />
has the right to use or inhabit that portion by virtue of a tenancy,<br />
licence or other agreement).<br />
The portion of the rate collected by way of capital value and<br />
uniform annual general charge varies from year to year to<br />
ensure that <strong>Council</strong> continues to comply with section 21 of the<br />
Local Government (Rating) Act 2002, which sets a maximum<br />
level of rates collected by way of a fixed charge as a percentage<br />
of the total rates revenue of 30%.<br />
The General Rates fund (or offset by surpluses recorded from),<br />
the following activities:<br />
• <strong>District</strong> Promotion and Advocacy (part of the <strong>District</strong><br />
Promotion group of Activities)<br />
• Grants, Pensioner Housing, Residential and Other<br />
Property, Depots (all part of the <strong>Community</strong> Services<br />
and Facilities group of activities)<br />
• Subdivision Inspections, Health Inspection, Liquor<br />
Licensing, Ranging & Impounding, Building Control,<br />
Litter Bin Collection and Civil Defence (all part of the<br />
Environmental and Safety Group of Activities)<br />
• <strong>District</strong> Wide Stormwater (part of the Stormwater &<br />
Drainage Group of Activities)<br />
The General Rate requirement is also offset by approximately<br />
17.5% of the surplus recorded by the <strong>Council</strong>’s treasury function<br />
after allowance for Library funding is made.<br />
Governance<br />
A portion (50%) of the Governance Rate requirement will be<br />
collected by way of a General Rate which will be set under<br />
section 13 of the Local Government (Rating) Act 2002 and be<br />
applied to all rateable land based on the capital value of the land.<br />
The remainder (50%) of the Governance Rate Requirement will<br />
be collected by way of a Uniform Annual General Charge which<br />
will be set under section 15 of the Local Government (Rating)<br />
Act 2002 and be applied as a fixed amount per separately used<br />
or inhabited part of the rating unit.<br />
The Governance Rate funds the following activity:<br />
• Governance Group of Activities.<br />
The Governance Rate requirement is offset an allocation of<br />
approximately 7.5% of the surplus recorded by the <strong>Council</strong>’s<br />
treasury function after allowance for Library funding is made.<br />
Roading<br />
The Roading Rate requirement will be collected by way of a<br />
General Rate which will be set under section 13 of the Local<br />
Government (Rating) Act 2002, and be applied to all rateable<br />
land based on the capital value of the land.<br />
The Roading Rate funds the following activities:<br />
• Subsidised Roading, Special Purpose Roading, Unsubsidised<br />
Roading, and Road Safety Programme (all part of the Roads<br />
and Footpaths group of activities).<br />
The Roading Rate requirement is offset by an allocation of<br />
approximately 75% of the surplus recorded by the <strong>Council</strong>’s<br />
treasury function after allowance for Library funding is made.<br />
Resource Management - <strong>Plan</strong>ning<br />
The <strong>Plan</strong>ning Rate Requirement will be collected by way of a<br />
General Rate which will be set under section 13 of the Local<br />
Government (Rating) Act 2002 and be applied to all rateable<br />
land based on the capital value of the land.<br />
The <strong>Plan</strong>ning Rate funds, or is offset by surpluses recorded from,<br />
the following activities:<br />
• Resource Management Act Implementation, Resource<br />
Management Act Regulatory and Resource Management<br />
Act Policy Development (all part of the Environmental<br />
and Safety group of activities).<br />
182
<strong>Hurunui</strong> <strong>Community</strong> <strong>Long</strong> <strong>Term</strong> <strong>Plan</strong> <strong>2012</strong> - <strong>2022</strong><br />
Waste Minimisation<br />
The Waste Rate Requirement will collected by way of a Uniform<br />
Annual General Charge which will be set under section 15 of<br />
the Local Government (Rating) Act 2002 and be applied as a<br />
fixed amount per separately used or inhabited part of the rating<br />
unit.<br />
The Waste Minimisation Rate funds the following activities:<br />
• Recycling Centres and Transfer Stations (part of<br />
Environmental and Safety group of activities).<br />
Canterbury Museum<br />
The Canterbury Museum Rate Requirement will be collected<br />
by way of a Uniform Annual General Charge which will be<br />
set under section 15 of the Local Government (Rating) Act<br />
2002 and be applied as a fixed amount per separately used or<br />
inhabited part of the rating unit.<br />
The Canterbury Museum Rate funds the following activity:<br />
• Canterbury Museum Levy which is imposed on<br />
each contributing Local Authority pursuant to the<br />
Canterbury Museum Trust Board Act 1993 (part of<br />
<strong>Community</strong> Services and Facilities Group of Activities).<br />
Targeted Rates<br />
Ward Amenities Rates<br />
The Ward Amenities Rates will be assessed under section 16 of<br />
the Local Government (Rating) Act 2002. A portion of the Ward<br />
Amenities Rate will be collected by way of a fixed charge per<br />
separately used or inhabited part of the rating unit. The balance<br />
of the Ward Amenities Rate requirement will be collected by<br />
way of a rate applied to all rateable land in the Ward on Capital<br />
value.<br />
The Ward Amenities Rate requirement will be used to fund the<br />
following activities within each Ward:<br />
• General administration, cost of Ward Committees,<br />
township maintenance, halls, local amenity reserves<br />
and public swimming pools in each Ward (part of<br />
<strong>Community</strong> Services and Facilities group of activities).<br />
rate applied to all rateable land in the ward on the capital value.<br />
The Ward roadside construction rate will be set on a differential<br />
basis based on land use (the categories are “urban” and “rural”<br />
within each Ward).<br />
The Ward Roadside Construction Rate requirement funds the<br />
following activities:<br />
• Roadside construction including: local kerb, channel,<br />
footpath and street lights (part of Roads and Footpaths<br />
group of activities).<br />
Water Rates<br />
Water Rates will be assessed under section 19 of the Local<br />
Government (Rating) Act 2002. Water Rates will be collected<br />
by way of a fixed charge based on the volume of water supplied<br />
to all rating units. In addition a fixed charge will be set per<br />
separately used or inhabited part of a rating unit which is either<br />
connected to the scheme or for which connection is available.<br />
Both the fixed charges will be set on a differential basis based<br />
on location and on the availability of service (the categories<br />
are “connected” and “serviceable”). Rating units which are not<br />
connected to the schemes and are not serviceable will not be<br />
liable for this rate.<br />
The Water Rate requirement funds the following activities (all<br />
part of the Water Supply group of activities:<br />
• Amberley Water Supply<br />
• Amuri Plains Water Supply<br />
• Ashley Rural Water Supply<br />
• Balmoral Water Supply<br />
• Cheviot Water Supply<br />
• Culverden Township Water Supply<br />
• Hanmer Springs Water Supply<br />
• Hawarden-Waikari Water Supply<br />
• <strong>Hurunui</strong> Rural Water Supply<br />
• Leithfield Beach Water Supply<br />
• Waiau Rural Water Supply<br />
• Waiau Township Water Supply<br />
• Waipara Township Water Supply<br />
Ward Roadside Construction Rates<br />
The Ward Roadside Construction Rates will be assessed under<br />
section 16 of the Local Government (Rating) Act 2002. The<br />
Ward Roadside Construction Rate will be collected by way of a<br />
183
www.hurunui.govt.nz<br />
Water Treatment Rates<br />
Water Treatment Rates will be assessed under sections 16 &<br />
17 and Schedule 2 of the Local Government (Rating) Act 2002.<br />
Water Treatment Rates will be collected by way of a fixed<br />
charge on each dwelling connected to the applicable water<br />
supply requiring the new treatment.<br />
This charge will be set on a differential basis based on location<br />
and will be charged to those dwelling connected to the following<br />
water supplies:<br />
• Waipara Township Water Supply<br />
• Waiau Rural Water Supply<br />
• Cheviot Water Supply<br />
• <strong>Hurunui</strong> Rural Water Supply<br />
It should be noted that the new treatment proposed for the<br />
Ashley Rural Water Supply will be funded as part of its standard<br />
water rates.<br />
The Water Treatment Rate requirement funds the following<br />
activities:<br />
• <strong>District</strong> Wide Water Treatment (part of the Water<br />
Supplies group of activities).<br />
Sewerage Rates<br />
Sewerage Rates will be assessed under section 16 of the Local<br />
Government (Rating) Act 2002. Sewerage Rates will be collected<br />
by way of a fixed charge per separately used or inhabited part<br />
of a rating unit which is either connected to the scheme or<br />
for which connection is available. This charge will be set on a<br />
differential basis based on location and the provision of service<br />
(with the categories being “connected” and “serviceable”).<br />
Rating units which are not connected to the schemes and which<br />
are not serviceable will not be liable for this rate. A residence<br />
of not more than one household is deemed to have one water<br />
closet (toilet).<br />
The Sewerage rate requirement funds the following activities:<br />
• Sewerage group of activities.<br />
Stormwater/Drainage/Land<br />
Protection Rates<br />
Stormwater/Drainage/Land Protection Rates <strong>Council</strong> will be<br />
assessed under section 16 of the Local Government (Rating)<br />
Act 2002. The Stormwater/Drainage/Land Protection Rates will<br />
be collected by way of: a rate based on the land value of each<br />
rating unit; a fixed charge per hectare of land within a drainage<br />
area; or per separately used or inhabited part of a rating unit in<br />
each stormwater/drainage/land protection area. This charge will<br />
be set on a differential basis based on location.<br />
• The Stormwater and Drainage Rate requirements fund the<br />
following activities (all part of the Stormwater & Drainage<br />
group of activities).<br />
• Jed River Drainage<br />
• Amberley Stormwater<br />
• Hanmer Springs Stormwater<br />
• The Land Protection Rate funds the following activity:<br />
• Amberley Beach Erosion Protection Works (part of the<br />
Stormwater & Drainage group of activities).<br />
Tourism<br />
The Tourism Rate will be assessed under section 16 of the Local<br />
Government (Rating) Act 2002. In terms of section 2 of the Act,<br />
the categories of land to be assessed with the targeted rate have<br />
been determined by:<br />
• The use to which the land is put.<br />
• The capital value of the improvements on the land.<br />
• The location of the land.<br />
It is intended that the Tourism Rate will be phased out with the<br />
funding for the Tourism activity to come from another source,<br />
which is still to be determined.<br />
The targeted rate is assessed on the following:<br />
1. All rateable properties within the Ward of Hanmer<br />
Springs that are used for any use other than solely<br />
private use, or emergency services buildings, or that are<br />
used for any use other than an economic farming or<br />
forestry unit, but only to the extent that the unit is used<br />
solely for farming or forestry purposes; or<br />
2. All rateable properties within the <strong>Hurunui</strong> district<br />
that hold either a On, Off or Winemakers License as<br />
required by the Sale of Liquor Act 1989 except Sports<br />
Clubs; or<br />
3. All rateable properties within the <strong>Hurunui</strong> district that<br />
hold a Health License as required by the Food Hygiene<br />
Regulations 1974 except Sports Clubs, Hairdressers,<br />
Abattoirs, Apiaries, holders of a minor food licence; or<br />
4. All rateable properties within the <strong>Hurunui</strong> district that<br />
are used for accommodation purposes on commercially<br />
zoned land with a land use category of CAPA, CAPB; or<br />
5. All rateable properties within the <strong>Hurunui</strong> district that<br />
are used for the sale of petroleum products with a land<br />
use category of CSP; or<br />
6. All rateable properties within the <strong>Hurunui</strong> district that<br />
are used for Commercial Tourism operations with a<br />
land use category of CTP.<br />
184
<strong>Hurunui</strong> <strong>Community</strong> <strong>Long</strong> <strong>Term</strong> <strong>Plan</strong> <strong>2012</strong> - <strong>2022</strong><br />
The Targeted Tourism Rate will be calculated on the following<br />
nine classes in terms of the Value of the Improvements of the<br />
Rating Unit as follows:<br />
Levels<br />
Value of Improvements to Rating Unit<br />
Class A $100 to $150,000<br />
Class B $150,001 to $250,000<br />
Class C $250,001 to $350,000<br />
Class D $350,001 to $450,000<br />
Class E $450,001 to $550,000<br />
Class F $550,001 to $650,000<br />
Class G $650,001 to $750,000<br />
Class H $750,001 to $850,000<br />
Class I $850,001 and above<br />
Notes to Category 1:<br />
1 A rateable property within the Ward of Hanmer<br />
Springs will be considered to be used for solely private use if<br />
the ratepayer of the property:<br />
1.1 Does not receive or intend to receive any form of<br />
payment or other consideration from any other person for the<br />
use of the property; and<br />
1.2 Signs a declaration in the form required by the <strong>Council</strong><br />
declaring that the property is used solely for the private use of<br />
the ratepayer with no payment or consideration being received<br />
or to be received by the ratepayer. (In previous years, the<br />
<strong>Council</strong> has required a statutory declaration witnessed made in<br />
the presence of a solicitor, justice of the peace or other person<br />
authorised by the Oaths and Declarations Act 1957).<br />
2 If a ratepayer has made a declaration to the <strong>Council</strong><br />
that the property is used for the ratepayers own private use<br />
with the ratepayer not receiving any form of payment or other<br />
consideration from third parties for the use of the property,<br />
but the ratepayer subsequently does receive payment or other<br />
consideration for allowing other people to use the property<br />
then the property will immediately become liable for the<br />
Targeted Tourism Rate.<br />
The Tourism Rate funds the following activity:<br />
• Tourism activity (part of the <strong>District</strong> Promotion group<br />
of activities).<br />
Medical Buildings<br />
The medical Buildings Rate will be assessed under section<br />
16 of the Local Government (Rating) Act 2002. The Medical<br />
Buildings rate will be collected by way of a fixed charge per each<br />
separately used or inhabited part of the rating unit in the Ward<br />
that funds a medical building.<br />
The Medical Buildings Rate funds the following activity:<br />
• Medical Buildings (part of the <strong>Community</strong> Services and<br />
Facilities group of activities).<br />
Refuse and Recycling Collection<br />
The Refuse and Recycling Rate will be assessed under section<br />
16 of the Local Government (Rating) Act 2002. The Rate will be<br />
assessed as a fixed charge per separately used or inhabited part<br />
of the rating unit and under section 17 of the Local Government<br />
(Rating) Act 2002.<br />
The rate is set differentially according to the following categories<br />
of land:<br />
• Urban properties that receive the service<br />
• Rural properties that receive the service<br />
• Business properties that receive the service<br />
The Refuse and Recycling Rate funds the following activity:<br />
• Household and business waste collection and disposal<br />
(part of the Environmental and Safety group of activities).<br />
Amberley Ward <strong>District</strong> Library Rate<br />
The Amberley Ward <strong>District</strong> Library Rate will be assessed<br />
under section 16 of the Local Government (Rating) Act 2002.<br />
The Rate will be assessed as a fixed charge per separately used<br />
or inhabited part of the rating unit and under section 17 of the<br />
Local Government (Rating) Act 2002. The Rate shall be applied<br />
to each rating unit in the Amberley Ward.<br />
The Amberley Ward <strong>District</strong> Library Rate funds the following<br />
activity:<br />
• The costs associated with meeting the servicing costs<br />
of a loan that was apportioned to the Amberley Ward<br />
upon construction of the <strong>Hurunui</strong> Memorial <strong>District</strong><br />
Library (part of the <strong>Community</strong> Services and Facilities<br />
group of activities).<br />
Rural Fire<br />
The Rural Fire Rate will be assessed under section 16 of the<br />
Local Government (Rating) Act 2002. The Rural Fire Rate will<br />
be collected by way of a rate applied on all ratable land in the<br />
district based on the capital value. The Rural Fire rate will be set<br />
on a differential basis based on land location (the categories are<br />
“land within <strong>Hurunui</strong> <strong>District</strong> Rural Fire Authority (HDRFA)”<br />
and “land outside <strong>Hurunui</strong> <strong>District</strong> Rural Fire Authority<br />
(OHDRFA”). The differential is 80% HDRFA and 20% OHDRFA.<br />
The Rural Fire Rate requirement is used to fund the following<br />
activity:<br />
• Rural Fire (part of the Environmental and Safety group<br />
of activities).<br />
185
www.hurunui.govt.nz<br />
Swimming Pool Inspection Rate<br />
The Swimming Pool Inspection Rate will be assessed under<br />
section 16 of the Local Government (Rating) Act 2002. The<br />
Rate will be assessed as a fixed charge per separately used or<br />
inhabited part of the rating unit and under section 17 of the<br />
Local Government (Rating) Act 2002 the rate shall be applied to<br />
each rating unit on which a swimming pool is located.<br />
The Swimming Pool Inspection rate funds the following activity:<br />
• Pool Inspection (part of the Environmental and Safety<br />
group of activities).<br />
Woodbank Road Stage 1 Sealing<br />
The Woodbank Road Stage 1 Sealing Rate will be assessed<br />
under section 16 of the Local Government (Rating) Act<br />
2002. The rate will be assessed as a fixed charge per lot<br />
on Woodbank Road,that did not contribute a lump sum<br />
contribution when the sealing work was undertaken.<br />
The Woodbank Road Stage 1 Sealing Rate funds the following<br />
activity:<br />
• Woodbank Road Stage 1 Sealing (part of the roading and<br />
footpaths group of activities).<br />
Fixed Charges<br />
Under section 21 of the Local Government (Rating) Act 2002,<br />
the <strong>Council</strong> is limited to setting fixed charges, excluding charges<br />
for water and sewer, at no greater than 30% of the total revenue<br />
from all rates sought by <strong>Council</strong>.<br />
The <strong>Council</strong> ensures that the maximum allowable amount of<br />
fixed charges under the Act is proposed and to comply with<br />
this section of the Act, the Uniform Annual General Charge is<br />
adjusted on an annual basis.<br />
Differential Matters and Categories<br />
Where <strong>Council</strong> assess rates on a differential basis they are<br />
limited to the list of matters specified in Schedule Two of the<br />
Local Government (Rating) Act 2002. <strong>Council</strong> is required to<br />
state which matters will be used for what purpose, and the<br />
category or categories of any differentials.<br />
Differentials Based on Land Use<br />
<strong>Council</strong> will use this matter to:<br />
• Differentiate the Ward Roadside Construction rate and<br />
for paying some of the tourism promotion rate<br />
• Differentiate those properties to be charged a Water<br />
Treatment rate<br />
The differential categories are:<br />
• Urban – all rating units that are within the urban<br />
boundaries as defined by the <strong>District</strong> <strong>Plan</strong><br />
• Rural – all rating units that are outside the urban<br />
boundaries as defined by the <strong>District</strong> <strong>Plan</strong><br />
Properties which have more than one use (or where there is<br />
doubt as to the relevant primary use) will be placed in a category<br />
with the highest rate factor.<br />
Note: That, subject to the rights of objection to the rating<br />
information database set out in section 28 of the Local<br />
Government (Rating) Act 2002, the <strong>Council</strong> is the sole<br />
determiner of the categories.<br />
Differentials Based on Location<br />
<strong>Council</strong> will use this matter for:<br />
• The Ward or <strong>Community</strong> Rating Area amenity rate<br />
• Ward or <strong>Community</strong> Rating Area roadside construction<br />
rate, water supply rate, the water treatment rate, the<br />
sewage disposal rate, the refuse collection rate, land<br />
drainage rate, some of the tourism rate and medical<br />
facilities rate<br />
The following categories will apply:<br />
• Amberley Ward – all rating units situated within the<br />
Amberley Ward<br />
• Amuri <strong>Community</strong> Rating Area – all rating units situated<br />
within the former Amuri Ward (as defined prior to the<br />
October 2007 election)<br />
• Cheviot Ward – all rating units situated within the<br />
Cheviot Ward<br />
• Glenmark Ward – all rating units situated within the<br />
Glenmark Ward<br />
• Hanmer Springs Ward – all rating units situated within<br />
the Hanmer Springs Ward<br />
• <strong>Hurunui</strong> <strong>Community</strong> Rating Area – all rating units<br />
situated within the former <strong>Hurunui</strong> Ward (as defined<br />
prior to the October 2007 election)<br />
Where a rating unit is situated in more than one Ward or<br />
<strong>Community</strong> Rating Area, <strong>Council</strong> will assign the rating unit to a<br />
Ward or <strong>Community</strong> Rating Area based on whichever part of<br />
the rating unit has the greatest land area.<br />
Water and sewerage, refuse collection, land drainage and rural<br />
fire areas:<br />
• All rating units situated within serviced areas as defined<br />
on plans held at the <strong>Council</strong> Office.<br />
Note: that, subject to the rights of objection to the rating<br />
information database set out in section 28 of the Local<br />
Government (Rating) Act 2002, the <strong>Council</strong> is the sole<br />
determiner of the categories.<br />
186
<strong>Hurunui</strong> <strong>Community</strong> <strong>Long</strong> <strong>Term</strong> <strong>Plan</strong> <strong>2012</strong> - <strong>2022</strong><br />
Availability of Service<br />
The differential categories for the water supply rate are:<br />
• Connected – any rating unit that is connected to a<br />
council operated waterworks.<br />
• Serviceable – any rating unit that is not connected to a<br />
council operated waterworks but is within 100 metres<br />
of such waterworks.<br />
• A charge of 10 per cent on so much of any rates levied<br />
before 1 July 2011 which remain unpaid on 30 June <strong>2012</strong>.<br />
• A charge of 10 per cent on any rate to which a penalty<br />
has been added under (ii) if the rates remain unpaid on<br />
1 January 2013.<br />
The differential categories for the sewage disposal rate are:<br />
• Connected – any rating unit that is connected to a<br />
public sewerage drain.<br />
• Serviceable– any rating unit that is not connected to a<br />
public sewerage drain but is within 30 metres of such<br />
a drain.<br />
Differentials – Tourism Rate<br />
The differential categories for the Tourism Rate are:<br />
• All rateable properties within the Ward of Hanmer<br />
Springs that are used for any use other than solely<br />
private use, or emergency services buildings, or that are<br />
used for any use other than an economic farming or<br />
forestry unit, but only to the extent that the unit is used<br />
solely for farming or forestry purposes.<br />
• All rateable properties within the <strong>Hurunui</strong> <strong>District</strong><br />
that hold either an On, Off or Winemakers License as<br />
required by the Sale of Liquor Act 1989 except Sports<br />
Clubs.<br />
• All rateable properties within the <strong>Hurunui</strong> district that<br />
hold a Health License as required by the Food Hygiene<br />
Regulations 1974 except Sports Clubs, Hairdressers,<br />
Abattoirs, Apiaries, holders of a minor food licence.<br />
Due Date for Payment of Rates<br />
All rates will be payable in four instalments on due dates as<br />
follows:<br />
Penalties<br />
Instalment number<br />
Due Date<br />
One 20 August <strong>2012</strong><br />
Two 20 November <strong>2012</strong><br />
Three 20 February 2013<br />
Four 20 May 2013<br />
That pursuant to sections 57 and 58 of the Local Government<br />
(Rating) Act 2002, the <strong>Council</strong> prescribes the following penalties<br />
to be added to unpaid rates:<br />
• A charge of 10 per cent of the amount of any instalment<br />
that has been assessed after 1 July <strong>2012</strong> and which is<br />
unpaid after the due date.<br />
187
www.hurunui.govt.nz<br />
Breakdown of Rates<br />
Annual <strong>Plan</strong> Year 1 Year 2 Year 3 Year 4 Year 5 Year 6 Year 7 Year 8 Year 9 Year 10<br />
2011/<strong>2012</strong> <strong>2012</strong>/2013 2013/2014 2014/2015 2015/2016 2016/2017 2017/2018 2018/2019 2019/2020 2020/2021 2021/<strong>2022</strong><br />
<strong>District</strong> Wide Rates<br />
General Rates & UACG 370,737 522,122 668,683 708,890 688,113 731,386 745,314 760,890 790,202 804,459 830,314<br />
Canterbury Museum Rates 53,842 56,534 112,188 171,516 132,243 86,355 90,673 95,206 99,967 104,965 110,213<br />
Roading 2,530,693 2,522,460 2,650,253 2,831,198 2,854,822 2,989,558 3,083,289 3,148,085 3,267,386 3,397,244 3,510,100<br />
Governance 809,138 909,976 972,635 1,083,291 1,013,986 1,104,489 1,158,385 1,112,908 1,214,913 1,272,925 1,231,330<br />
<strong>Plan</strong>ning 718,324 818,130 859,221 887,870 900,957 932,287 960,276 988,734 1,023,089 1,058,187 1,094,636<br />
Waste Management 797,504 801,328 826,494 853,730 879,947 908,890 935,472 961,863 993,187 1,026,726 1,060,215<br />
Legislative Compliance 0 0 0 0 271,471 271,471 271,471 271,471 271,471 271,471 271,471<br />
Total <strong>District</strong> Wide Rates 5,280,238 5,630,550 6,089,475 6,536,495 6,741,539 7,024,437 7,244,880 7,339,157 7,660,215 7,935,977 8,108,278<br />
Raw Increase ($) 350,312 458,925 447,020 205,044 282,898 220,444 94,277 321,058 275,762 172,301<br />
Raw Increase (%) 6.63% 8.15% 7.34% 3.14% 4.20% 3.14% 1.30% 4.37% 3.60% 2.17%<br />
Growth Adjusted Increase (%) 5.63% 7.15% 6.34% 2.14% 3.20% 2.14% 0.30% 3.37% 2.60% 1.17%<br />
Targeted Rates<br />
Refuse Collection 801,348 742,201 748,378 771,949 795,513 821,623 844,931 868,731 897,084 926,239 956,462<br />
Swimming Pool Inspection 23,530 29,627 30,554 31,485 32,483 33,553 34,507 35,481 36,604 37,837 39,075<br />
Stormwater & Drainage 251,958 279,042 286,471 280,990 277,894 286,212 279,536 275,397 271,368 267,418 276,708<br />
Rural Fire Control 263,546 274,088 285,051 296,453 308,312 320,644 333,470 346,809 360,681 375,108 390,112<br />
Tourism 275,000 286,000 297,440 309,338 318,618 328,176 338,022 348,162 358,607 369,365 380,446<br />
Medical Centres 167,259 183,806 183,806 183,806 183,806 183,806 229,154 229,154 229,154 229,154 229,154<br />
Amberley Library Rate 34,358 34,358 34,358 9,253 0 0 0 0 0 0 0<br />
Sealing Contributions 0 5,043 5,043 5,043 5,043 5,043 5,043 5,043 5,043 0 0<br />
Amenities 1,305,678 1,329,755 1,371,316 1,419,704 1,469,996 1,521,419 1,574,849 1,630,369 1,688,066 1,748,031 1,810,358<br />
Sewerage 560,062 618,127 683,846 758,360 842,193 937,618 1,046,410 1,170,631 1,312,674 1,475,324 1,661,819<br />
Water 3,866,269 4,216,961 4,457,076 4,708,071 4,886,798 5,073,337 5,195,456 5,397,543 5,608,551 5,828,920 6,059,113<br />
Total Targeted Rates 7,549,008 7,999,008 8,383,339 8,774,452 9,120,655 9,511,430 9,881,377 10,307,320 10,767,832 11,257,396 11,803,247<br />
Raw Increase ($) 450,001 384,331 391,113 346,203 390,775 369,947 425,942 460,513 489,564 545,851<br />
Raw Increase (%) 5.96% 4.80% 4.67% 3.95% 4.28% 3.89% 4.31% 4.47% 4.55% 4.85%<br />
No Growth Adjustment made<br />
TOTAL RATE REQUIREMENT 12,829,246 13,629,559 14,472,814 15,310,947 15,862,194 16,535,867 17,126,258 17,646,477 18,428,048 19,193,373 19,911,525<br />
Raw Increase ($) 800,313 843,256 838,132 551,247 673,673 590,391 520,219 781,571 765,326 718,152<br />
Raw Increase (%) 6.24% 6.19% 5.79% 3.60% 4.25% 3.57% 3.04% 4.43% 4.15% 3.74%<br />
Growth Adjusted Increase (%)- adjusted for <strong>District</strong> Wide Rates only 5.83% 5.77% 5.37% 3.17% 3.82% 3.15% 2.61% 4.01% 3.74% 3.33%<br />
H:\<strong>Long</strong> <strong>Term</strong> <strong>Plan</strong> Workings\Rates - for Final LTP\Funding Impact Statement for <strong>2012</strong>-2013 - Post Submissions.xls 31/05/<strong>2012</strong> 10:23 a.m.<br />
188
<strong>Hurunui</strong> <strong>Community</strong> <strong>Long</strong> <strong>Term</strong> <strong>Plan</strong> <strong>2012</strong> - <strong>2022</strong><br />
Rates for the <strong>2012</strong>/2013, 2013/2014 and 2014/2015 years<br />
<strong>District</strong> Wide Rates<br />
Rate Type<br />
General Rate and UAGC<br />
Actual Rates for<br />
2011/<strong>2012</strong> inclusive of GST<br />
Actual Rates for<br />
<strong>2012</strong>/2013 inclusive of GST<br />
Indicative Rates for<br />
2013/2014 inclusive of GST<br />
Indicative Rates for<br />
2014/2015 inclusive of GST<br />
Rate per $ of Capital Value $0.00003256 $0.00005464 $0.00006865 $0.00007765<br />
Fixed Charge Per Property $36.08 $45.01 $57.46 $56.89<br />
Total Expected Rates (Excl GST) $370,738 $522,122 $668,683 $708,890<br />
Governance Rate<br />
Rate per $ of Capital Value $0.00010005 $0.00011179 $0.00011830 $79.79580451<br />
Fixed Charge Per Property $61.11 $68.38 $72.36 $62.21<br />
Total Expected Rates (Excl GST) $809,138 $909,976 $972,635 $1,083,291<br />
Roading Rate<br />
Rate per $ of Capital Value $0.00062568 $0.00061960 $0.00064454 $0.00068173<br />
Total Expected Rates (Excl GST) $2,530,693 $2,522,460 $2,650,253 $2,831,198<br />
<strong>Plan</strong>ning Rate<br />
Rate per $ of Capital Value $0.00017764 $0.00020101 $0.00020902 $0.00021385<br />
Total Expected Rates (Excl GST) $718,324 $818,130 $859,221 $887,870<br />
Waste Management Rate<br />
Fixed Charge Per Property $120.55 $120.52 $123.08 $125.87<br />
Total Expected Rates (Excl GST) $797,504 $801,328 $826,494 $853,730<br />
Canterbury Museum Rate<br />
Fixed Charge Per Property - Operational Rate $8.13 $8.49 $9.24 $10.53<br />
Fixed Charge Per Property - Capital Rate $0.00 $0.00 $7.43 $14.72<br />
Total Expected Rates (Excl GST) $53,842 $56,534 $112,188 $171,516<br />
Targeted Rates - Amenities Rates<br />
Rate Type<br />
Amberley Ward Amenities Rates<br />
Actual Rates for<br />
2011/<strong>2012</strong> inclusive of GST<br />
Actual Rates for<br />
<strong>2012</strong>/2013 inclusive of GST<br />
Indicative Rates for<br />
2013/2014 inclusive of GST<br />
Indicative Rates for<br />
2014/2015 inclusive of GST<br />
Rate per $ of Capital Value $0.00002059 $0.00002163 $0.00002271 $0.00002385<br />
Fixed Charge Per Property $145.56 $152.84 $160.48 $168.50<br />
Total Expected Rates (Excl GST) $291,293 $311,881 $323,439 $339,611<br />
Amuri Ward Amenities Rates<br />
Rate per $ of Capital Value $0.00000428 $0.00000420 $0.00000433 $0.00000446<br />
Fixed Charge Per Property $136.03 $136.03 $140.11 $144.31<br />
Total Expected Rates (Excl GST) $143,868 $146,649 $151,049 $155,580<br />
Cheviot Ward Amenities Rates<br />
Rate per $ of Capital Value $0.00001120 $0.00001120 $0.00001154 $0.00001188<br />
Fixed Charge Per Property $81.06 $81.06 $83.49 $86.00<br />
Total Expected Rates (Excl GST) $73,108 $73,108 $75,302 $77,561<br />
Glenmark Ward Amenities Rates<br />
Rate per $ of Capital Value $0.00000000 $0.00000000 $0.00000000 $0.00000000<br />
Fixed Charge Per Property $97.73 $97.73 $97.73 $97.73<br />
Total Expected Rates (Excl GST) $65,051 $65,051 $65,051 $65,051<br />
Hanmer Springs Ward Amenities Rates<br />
Rate per $ of Capital Value $0.00003315 $0.00003320 $0.00003420 $0.00003522<br />
Fixed Charge Per Property $206.11 $206.11 $212.29 $218.66<br />
Total Expected Rates (Excl GST) $316,323 $320,211 $329,817 $339,712<br />
<strong>Hurunui</strong> Ward Amenities Rates<br />
Rate per $ of Capital Value $0.00000500 $0.00000500 $0.00000520 $0.00000541<br />
Fixed Charge Per Property $68.51 $68.51 $71.25 $74.10<br />
Total Expected Rates (Excl GST) $50,258 $50,256 $52,266 $54,356<br />
Amberley Ward Roadside Construction Rates<br />
Urban Rate per $ of Capital Value $0.00022829 $0.00023993 $0.00025192 $0.00026452<br />
Rural Rate per $ of Capital Value $0.00003441 $0.00003612 $0.00003793 $0.00003982<br />
Total Expected Rates (Excl GST) $87,562 $93,739 $97,212 $102,073<br />
Amuri Ward Roadside Construction Rates<br />
Urban Rate per $ of Capital Value $0.00054937 $0.00054940 $0.00056588 $0.00058286<br />
Rural Rate per $ of Capital Value $0.00001091 $0.00001090 $0.00001123 $0.00001156<br />
Total Expected Rates (Excl GST) $50,005 $50,965 $52,494 $54,068<br />
Cheviot Ward Roadside Construction Rates<br />
Urban Rate per $ of Capital Value $0.00039341 $0.00039340 $0.00040520 $0.00041736<br />
Rural Rate per $ of Capital Value $0.00001666 $0.00001670 $0.00001720 $0.00001772<br />
Total Expected Rates (Excl GST) $38,219 $38,219 $39,365 $40,546<br />
Glenmark Ward Roadside Construction Rates<br />
Urban Rate per $ of Capital Value $0.00000000 $0.00000000 $0.00000000 $0.00000000<br />
Rural Rate per $ of Capital Value $0.00000000 $0.00000000 $0.00000000 $0.00000000<br />
Total Expected Rates (Excl GST) $0 $0 $0 $0<br />
Hanmer Springs Ward Roadside Construction Rates<br />
Urban Rate per $ of Capital Value $0.00031859 $0.00031860 $0.00032816 $0.00033800<br />
Rural Rate per $ of Capital Value $0.00009453 $0.00009450 $0.00009734 $0.00010026<br />
Total Expected Rates (Excl GST) $152,390 $154,246 $158,873 $163,640<br />
<strong>Hurunui</strong> Ward Roadside Construction Rates<br />
Urban Rate per $ of Capital Value $0.00051993 $0.00051990 $0.00054070 $0.00056232<br />
Rural Rate per $ of Capital Value $0.00001225 $0.00012300 $0.00012792 $0.00013304<br />
Total Expected Rates (Excl GST) $25,429 $25,430 $26,448 $27,506<br />
H:\<strong>Long</strong> <strong>Term</strong> <strong>Plan</strong> Workings\Rates - for Final LTP\Funding Impact Statement for <strong>2012</strong>-2013 20/06/<strong>2012</strong> - Post Submissions.xls<br />
10:48 a.m.<br />
189
www.hurunui.govt.nz<br />
Targeted Rates - Water Rates<br />
Rate Type<br />
Amberley Township<br />
Actual Rates for<br />
2011/<strong>2012</strong> inclusive of GST<br />
Actual Rates for<br />
<strong>2012</strong>/2013 inclusive of GST<br />
Indicative Rates for<br />
2013/2014 inclusive of GST<br />
Indicative Rates for<br />
2014/2015 inclusive of GST<br />
Fixed Charge per connected property $120.82 $129.98 $139.86 $150.49<br />
Fixed Charge per serviceable property $60.41 $64.99 $69.93 $75.24<br />
Fixed Charge per m3 supplied $0.61803731 $0.66501104 $0.71555188 $0.76993382<br />
Total Expected Rates (Excl GST) $225,992 $211,610 $227,693 $244,998<br />
Culverden Township<br />
Fixed Charge per connected property $174.65 $182.07 $189.81 $197.88<br />
Fixed Charge per serviceable property $87.33 $91.04 $94.91 $98.94<br />
Fixed Charge per m3 supplied $0.59079627 $0.61590900 $0.64208513 $0.66937375<br />
Total Expected Rates (Excl GST) $78,199 $81,522 $84,987 $88,599<br />
Hanmer Springs Township<br />
Fixed Charge per connected property $177.64 $184.76 $123.19 $199.83<br />
Fixed Charge per serviceable property $88.82 $92.38 $61.60 $99.92<br />
Fixed Charge per m3 supplied $0.60064762 $0.62467600 $0.64966304 $0.67564956<br />
Fixed Charge per Rural connected property $583.79 $607.14 $631.43 $656.68<br />
Total Expected Rates (Excl GST) $335,553 $359,520 $373,900 $388,856<br />
Hawarden-Waikari Township<br />
Fixed Charge per connected property $113.89 $118.46 $123.19 $128.12<br />
Fixed Charge per serviceable property $56.94 $59.23 $61.60 $64.06<br />
Fixed Charge per m3 supplied $0.41265941 $0.42916640 $0.44633306 $0.46418638<br />
Fixed Charge per Rural connected property on Medbury Line $393.40 $409.14 $425.50 $442.52<br />
Total Expected Rates (Excl GST) $138,180 $143,707 $149,455 $155,434<br />
Leithfield Beach<br />
Fixed Charge per connected property $205.28 $222.24 $240.57 $260.42<br />
Fixed Charge per serviceable property $102.64 $111.12 $120.29 $130.21<br />
Total Expected Rates (Excl GST) $40,517 $43,860 $47,478 $51,395<br />
Waiau Township<br />
Fixed Charge per connected property $137.12 $142.58 $148.29 $154.22<br />
Fixed Charge per serviceable property $68.56 $71.29 $74.14 $77.11<br />
Fixed Charge per m3 supplied $0.74907467 $0.77903280 $0.81019411 $0.84260188<br />
Total Expected Rates (Excl GST) $48,925 $50,882 $52,917 $55,034<br />
Waipara Township<br />
Fixed Charge per connected property $67.54 $67.55 $67.55 $67.55<br />
Fixed Charge per serviceable property $33.77 $33.78 $33.78 $33.78<br />
Fixed Charge per m3 supplied $0.66117976 $0.66118000 $0.66118000 $0.66118000<br />
Fixed Charge per Rural connected property $514.86 $514.86 $514.86 $514.86<br />
Total Expected Rates (Excl GST) $30,333 $30,333 $30,333 $30,333<br />
Ashley Rural<br />
Fixed Charge per unit provided $567.03 $589.68 $613.27 $637.80<br />
Fixed Charge for availability $10.00 $10.00 $10.00 $10.00<br />
Total Expected Rates (Excl GST) $1,115,757 $1,197,820 $1,251,065 $1,306,654<br />
Amuri Plains Rural<br />
Fixed Charge per unit provided $185.53 $192.92 $200.64 $208.66<br />
Total Expected Rates (Excl GST) $97,122 $101,007 $105,047 $109,249<br />
Balmoral Rural<br />
Fixed Charge per unit provided $65.86 $65.85 $65.85 $65.85<br />
Fixed Charge for availability $1.00 $1.00 $1.00 $1.00<br />
Total Expected Rates (Excl GST) $39,574 $39,574 $39,574 $39,574<br />
Waiau Rural<br />
Fixed Charge per unit provided $666.00 $692.64 $720.35 $749.16<br />
Total Expected Rates (Excl GST) $249,151 $259,117 $269,482 $280,261<br />
Cheviot<br />
Fixed Charge per unit provided in Rural area $576.06 $656.70 $689.53 $724.01<br />
Fixed Charge for each half unit provided to Rural Residential Properties $360.64 $411.14 $863.40 $906.57<br />
Fixed Charge for availability $20.00 $20.00 $20.00 $20.00<br />
Total Expected Rates (Excl GST) $554,122 $624,132 $655,339 $688,105<br />
<strong>Hurunui</strong> Rural<br />
Fixed Charge per unit provided for Operational $625.00 $656.25 $689.06 $723.52<br />
Fixed Charge per unit provided for Capital $0.00 $50.00 $50.00 $50.00<br />
Total Expected Rates (Excl GST) $912,500 $1,025,598 $1,073,247 $1,123,279<br />
Water Treatment Rate<br />
Fixed Charge per dwelling $0.00 $37.95 $75.90 $115.00<br />
Total Expected Rates (Excl GST) $0 $48,279 $96,558 $146,300<br />
H:\<strong>Long</strong> <strong>Term</strong> <strong>Plan</strong> Workings\Rates - for Final LTP\Funding Impact Statement for <strong>2012</strong>-2013 20/06/<strong>2012</strong> - Post Submissions.xls<br />
10:48 a.m.<br />
190
<strong>Hurunui</strong> <strong>Community</strong> <strong>Long</strong> <strong>Term</strong> <strong>Plan</strong> <strong>2012</strong> - <strong>2022</strong><br />
Targeted Rates - Sewerage Rates<br />
Rate Type<br />
Amberley & <strong>District</strong>s<br />
Actual Rates for<br />
2011/<strong>2012</strong> inclusive of GST<br />
Actual Rates for<br />
<strong>2012</strong>/2013 inclusive of GST<br />
Indicative Rates for<br />
2013/2014 inclusive of GST<br />
Indicative Rates for<br />
2014/2015 inclusive of GST<br />
Fixed Charge per connected property $144.95 $170.32 $200.12 $235.14<br />
Fixed Charge for second Water Closet or Urinal $72.50 $85.19 $100.10 $117.61<br />
Fixed Charge for additional Water Closets or Urinals $36.28 $42.63 $50.09 $58.85<br />
Fixed Charge per serviceable property $72.50 $85.19 $100.10 $117.61<br />
Total Expected Rates (Excl GST) $193,050 $191,489 $225,000 $264,375<br />
Cheviot<br />
Fixed Charge per connected property $324.07 $340.27 $357.29 $375.15<br />
Fixed Charge for second Water Closet or Urinal $162.05 $170.15 $178.66 $187.59<br />
Fixed Charge for additional Water Closets or Urinals $81.04 $85.09 $89.35 $93.81<br />
Fixed Charge per serviceable property $162.05 $170.15 $178.66 $187.59<br />
Total Expected Rates (Excl GST) $72,557 $76,185 $79,994 $83,994<br />
Greta Valley<br />
Fixed Charge per connected property $302.99 $331.02 $361.64 $395.09<br />
Fixed Charge for second Water Closet or Urinal $151.54 $165.56 $180.87 $197.60<br />
Fixed Charge for additional Water Closets or Urinals $75.82 $82.83 $90.50 $93.81<br />
Fixed Charge per serviceable property $151.54 $165.56 $180.87 $197.60<br />
Total Expected Rates (Excl GST) $10,786 $11,784 $12,874 $14,065<br />
Motunau Beach<br />
Fixed Charge per connected property $192.43 $201.57 $211.15 $221.17<br />
Fixed Charge per serviceable property $96.21 $100.79 $105.57 $110.59<br />
Total Expected Rates (Excl GST) $20,832 $21,822 $22,858 $23,944<br />
Hanmer Springs<br />
Fixed Charge per connected property $151.48 $168.14 $186.64 $207.17<br />
Fixed Charge for second Water Closet or Urinal $75.75 $84.08 $93.33 $103.60<br />
Fixed Charge for additional Water Closets or Urinals $37.88 $42.05 $46.67 $51.81<br />
Fixed Charge per serviceable property $75.75 $84.08 $93.33 $103.60<br />
Total Expected Rates (Excl GST) $180,358 $201,678 $223,863 $248,488<br />
Hawarden<br />
Fixed Charge per connected property $348.97 $358.57 $368.43 $378.56<br />
Fixed Charge for second Water Closet or Urinal $174.50 $179.30 $184.23 $189.30<br />
Fixed Charge for additional Water Closets or Urinals $87.24 $89.64 $92.10 $94.64<br />
Fixed Charge per serviceable property $174.50 $179.30 $184.23 $189.30<br />
Total Expected Rates (Excl GST) $40,359 $41,469 $42,609 $43,781<br />
Waikari<br />
Fixed Charge per connected property $502.28 $522.37 $543.27 $565.00<br />
Fixed Charge for second Water Closet or Urinal $251.14 $261.19 $271.63 $282.50<br />
Fixed Charge for additional Water Closets or Urinals $125.57 $130.59 $135.82 $141.25<br />
Fixed Charge per serviceable property $251.14 $261.19 $271.63 $282.50<br />
Total Expected Rates (Excl GST) $70,866 $73,701 $76,649 $79,715<br />
Targeted Rates - Stromwater/Drainage/Land Protection Rates<br />
Rate Type<br />
Jed River Drainage<br />
Actual Rates for<br />
2011/<strong>2012</strong> inclusive of GST<br />
Actual Rates for<br />
<strong>2012</strong>/2013 inclusive of GST<br />
Indicative Rates for<br />
2013/2014 inclusive of GST<br />
Indicative Rates for<br />
2014/2015 inclusive of GST<br />
Rate per $ of Land Value $0.00003599 $0.00003600 $0.00003600 $0.00003600<br />
Class A - Fixed Charge per hectare $10.34 $10.34 $10.34 $10.34<br />
Class B - Fixed Charge per hectare $7.55 $7.55 $7.55 $7.55<br />
Class C - Fixed Charge per hectare $4.14 $4.14 $4.14 $4.14<br />
Total Expected Rates (Excl GST) $810 $810 $810 $810<br />
Amberley Stormwater<br />
Fixed Charge per property $108.77 $108.77 $108.77 $108.77<br />
Total Expected Rates (Excl GST) $198,108 $234,713 $234,713 $234,713<br />
Hanmer Springs Stormwater<br />
Fixed Charge per property $0.00 $24.90 $31.73 $26.69<br />
Total Expected Rates (Excl GST) $0 $27,084 $34,513 $29,032<br />
Amberley Beach Erosion Protection<br />
Fixed Charge per property $175.00 $175.00 $175.00 $175.00<br />
Total Expected Rates (Excl GST) $18,911 $16,435 $16,435 $16,435<br />
Targeted Rates - Tourism Rates<br />
Rate Type<br />
Fixed Charge per property<br />
Actual Rates for<br />
2011/<strong>2012</strong> inclusive of GST<br />
Actual Rates for<br />
<strong>2012</strong>/2013 inclusive of GST<br />
Indicative Rates for<br />
2013/2014 inclusive of GST<br />
Indicative Rates for<br />
2014/2015 inclusive of GST<br />
Class A ($100 to $150,000) $238.67 $248.56 $258.50 $268.84<br />
Class B ($150,001 to $250,000) $355.35 $369.20 $383.97 $399.33<br />
Class C ($250,001 to $350,000) $472.04 $490.88 $510.52 $530.94<br />
Class D ($350,001 to $450,000) $599.33 $622.96 $647.88 $673.79<br />
Class E ($450,001 to $550,000) $710.71 $739.44 $769.02 $799.78<br />
Class F ($550,001 to $650,000) $822.09 $854.88 $889.08 $924.64<br />
Class G ($650,001 to $750,000) $928.16 $965.12 $1,003.72 $1,043.87<br />
Class H ($750,001 to $850,000) $1,039.54 $1,081.60 $1,124.86 $1,169.86<br />
Class I ($850,001 and over) $1,203.97 $1,252.16 $1,302.25 $1,354.34<br />
Total Expected Rates (Excl GST) $275,000 $286,000 $297,440 $309,338<br />
H:\<strong>Long</strong> <strong>Term</strong> <strong>Plan</strong> Workings\Rates - for Final LTP\Funding Impact Statement for <strong>2012</strong>-2013 20/06/<strong>2012</strong> - Post Submissions.xls<br />
10:48 a.m.<br />
191
www.hurunui.govt.nz<br />
Targeted Rates - Medical Centre Rates<br />
Rate Type<br />
Amuri Ward Medical Centre<br />
Actual Rates for<br />
2011/<strong>2012</strong> inclusive of GST<br />
Actual Rates for<br />
<strong>2012</strong>/2013 inclusive of GST<br />
Indicative Rates for<br />
2013/2014 inclusive of GST<br />
Indicative Rates for<br />
2014/2015 inclusive of GST<br />
Fixed Charge per property $101.30 $101.30 $101.30 $101.30<br />
Total Expected Rates (Excl GST) $105,000 $105,000 $105,000 $105,000<br />
Cheviot Ward Medical Centre<br />
Fixed Charge per property $24.93 $45.00 $45.00 $45.00<br />
Total Expected Rates (Excl GST) $20,553 $37,100 $37,100 $37,100<br />
Hanmer Springs Ward Medical Centre<br />
Fixed Charge per property $19.91 $19.91 $19.91 $19.91<br />
Total Expected Rates (Excl GST) $28,651 $28,651 $28,651 $28,651<br />
<strong>Hurunui</strong> Ward Medical Centre<br />
Fixed Charge per property $18.68 $18.68 $18.68 $18.68<br />
Total Expected Rates (Excl GST) $13,055 $13,055 $13,055 $13,055<br />
Targeted Rates - Other Targeted Rates<br />
Rate Type<br />
Refuse Collection Rates<br />
Actual Rates for<br />
2011/<strong>2012</strong> inclusive of GST<br />
Actual Rates for<br />
<strong>2012</strong>/2013 inclusive of GST<br />
Indicative Rates for<br />
2013/2014 inclusive of GST<br />
Indicative Rates for<br />
2014/2015 inclusive of GST<br />
Fixed Charge per Urban property $260.00 $260.00 $260.00 $260.00<br />
Fixed Charge per Rural property that receive the service $270.00 $270.00 $270.00 $270.00<br />
Fixed Charge per Business that receive the service $260.00 $260.00 $260.00 $260.00<br />
Total Expected Rates (Excl GST) $713,699 $742,201 $748,378 $771,949<br />
Amberley Ward Library Rate<br />
Fixed Charge per property $18.14 $18.14 $18.14 $4.88<br />
Total Expected Rates (Excl GST) $34,200 $34,358 $34,358 $9,253<br />
Rural Fire Rates<br />
Class A - Rate per $ of Capital Value $0.00008377 $0.00008715 $0.00009064 $0.00009426<br />
Class B - Rate per $ of Capital Value $0.00003546 $0.00003682 $0.00003829 $0.00003982<br />
Total Expected Rates (Excl GST) $263,546 $274,088 $285,051 $296,453<br />
Swimming Pool Inspection Rates<br />
Fixed Charge per property $77.09 $98.76 $101.85 $104.95<br />
Total Expected Rates (Excl GST) $23,530 $29,627 $30,554 $31,485<br />
Woodbank Road Stage 1 Sealing<br />
Fixed Charge per lot for which no lump sum contribution was made $0.00 $252.13 $252.13 $252.13<br />
Total Expected Rates (Excl GST) $0 $5,043 $5,043 $5,043<br />
H:\<strong>Long</strong> <strong>Term</strong> <strong>Plan</strong> Workings\Rates - for Final LTP\Funding Impact Statement for <strong>2012</strong>-2013 20/06/<strong>2012</strong> - Post Submissions.xls<br />
10:48 a.m.<br />
192
<strong>Hurunui</strong> <strong>Community</strong> <strong>Long</strong> <strong>Term</strong> <strong>Plan</strong> <strong>2012</strong> - <strong>2022</strong><br />
Reserve Funds<br />
The recent changes to the Local Government Act has imposed<br />
a new requirement to provide details and the movements over<br />
the ten year period for each reserve fund that the <strong>Council</strong> has<br />
set aside for a specific purpose.<br />
As outlined in the <strong>Council</strong>’s Internal Financing Policy on page<br />
268, the <strong>Council</strong> have developed a system where various<br />
activities hold a separate account. The account may hold funds,<br />
which is set aside to meet future capital expenditure specifically<br />
for that activity, or it may be in debt, which has been the result of<br />
funding capital expenditure in the past. As a result, the <strong>Council</strong><br />
holds 100 separate reserve funds, which are on the following<br />
pages.<br />
193
www.hurunui.govt.nz<br />
Special Funds<br />
Fund Name<br />
Activity the Fund relates<br />
to<br />
Group of Activities the Fund relates<br />
Forecast Balance 1 Funds Deposited Funds Withdrawn Forecast Balance 30<br />
to Reason for Holding Reserve Funds<br />
July <strong>2012</strong><br />
<strong>2012</strong>-<strong>2022</strong><br />
<strong>2012</strong>-<strong>2022</strong><br />
June <strong>2022</strong><br />
To fund earthquake strengthening work and maintenance of the<br />
1,258,438 0 1,258,438 Nurses Block on the Former Queen Mary Hospital Site<br />
To fund projects for Amberley Beach 25,939 10,651 0 To fund projects for the Amuri Ward 20,879 8,573 0 To fund projects for sports facilities in the Amuri Ward 14,474 88,063 0 To fund projects for Cheviot Ward 4,970 2,041 0 To fund projects for the Waipara Pavilion 14,355 5,894 0 To provide funds for the maintenance of the Waiau Ferry Bridge 11,248 58,196 0 To fund marketing projects for the Hanmer Springs Ward 39,831 26,772 70,000 To fund projects for the <strong>Hurunui</strong> Ward 3,489 1,433 0 To provides funds relating to adverse events 13,114 0 0 To continue to provide for commercial forests and funds projects as<br />
548,196 2,533,274 0 determined by the <strong>Council</strong>.<br />
964<br />
1,650<br />
0<br />
36,590<br />
29,452<br />
102,537<br />
7,011<br />
20,249<br />
69,444<br />
(3,397)<br />
4,922<br />
13,114<br />
3,081,470<br />
3,364,005<br />
Reserve Committee Funds<br />
Fund Name<br />
Activity the Fund relates<br />
to<br />
Group of Activities the Fund relates<br />
Forecast Balance 1 Funds Deposited Funds Withdrawn Forecast Balance 30<br />
to Reason for Holding Reserve Funds<br />
July <strong>2012</strong><br />
<strong>2012</strong>-<strong>2022</strong><br />
<strong>2012</strong>-<strong>2022</strong><br />
June <strong>2022</strong><br />
19,732 8,102 0 27,834<br />
determined by the Scargill - Motunau Reserve Committee<br />
Hawarden Reserve & Hall Reserves <strong>Community</strong> Services and Facilities To fund operations on the Hawarden Reserve as determined by the<br />
(343) 0 0 (343)<br />
Reserve Committee<br />
Waikari Reserve & Hall Reserves <strong>Community</strong> Services and Facilities To fund operations on the Waikari Reserve as determined by the<br />
24,160 0 0 24,160<br />
Reserve Committee<br />
<strong>Hurunui</strong> Reserve Reserves <strong>Community</strong> Services and Facilities To fund operations on the <strong>Hurunui</strong> Reserve as determined by the<br />
10,007 4,109 0 14,116<br />
Reserve Committee<br />
Waiau Reserve Reserves <strong>Community</strong> Services and Facilities To fund operations on the Waiau Reserve as determined by the<br />
67,253 13,282 0 80,535<br />
Reserve Committee<br />
Cheviot Reserve Reserves <strong>Community</strong> Services and Facilities To fund operations on the Cheviot Reserve as determined by the<br />
68,834 0 32,752 36,082<br />
Reserve Committee<br />
Domett Reserve Reserves <strong>Community</strong> Services and Facilities To fund operations on the Domett Reserve as determined by the<br />
11,190 (1,430) 0 9,760<br />
Reserve Committee<br />
Port Robinson - Gore Bay Camp Reserves <strong>Community</strong> Services and Facilities To fund operations on the Port Robinson-Gore Bay Camp Reserve<br />
74,908 97,808 45,000 127,716<br />
as determined by the Reserve Committee<br />
Port Robinson Reserve Reserves <strong>Community</strong> Services and Facilities To fund operations on the Port Robinson Reserve as determined by<br />
12,912 (2,065) 0 10,847<br />
the Reserve Committee<br />
Spotswood Reserve Reserves <strong>Community</strong> Services and Facilities To fund operations on the Spotswood Reserve as determined by the<br />
5,329 0 14,982 (9,653)<br />
Reserve Committee<br />
Domett Camp Reserve Reserves <strong>Community</strong> Services and Facilities To fund operations on the Domett Camp Reserve as determined by<br />
11,676 0 18,534 (6,858)<br />
305,658 119,805 111,268 314,195<br />
To fund operations on the Scargill-Motunau Recreation Reserve as<br />
the Reserve Committee<br />
H:\<strong>Long</strong> <strong>Term</strong> <strong>Plan</strong> Workings\<strong>Hurunui</strong> <strong>District</strong> <strong>Council</strong> LTP Budgets <strong>2012</strong>-<strong>2022</strong> - Post Submissions.xls 31/05/<strong>2012</strong> 12:03 p.m.<br />
194
<strong>Hurunui</strong> <strong>Community</strong> <strong>Long</strong> <strong>Term</strong> <strong>Plan</strong> <strong>2012</strong> - <strong>2022</strong><br />
Trust Funds<br />
Fund Name<br />
Activity the Fund relates<br />
to<br />
Group of Activities the Fund relates<br />
Forecast Balance 1 Funds Deposited Funds Withdrawn Forecast Balance 30<br />
to Reason for Holding Reserve Funds<br />
July <strong>2012</strong><br />
<strong>2012</strong>-<strong>2022</strong><br />
<strong>2012</strong>-<strong>2022</strong><br />
June <strong>2022</strong><br />
To provide funds for maintenance of gravestones in the <strong>Council</strong>'s<br />
169 69 0 Cemeteries<br />
To provide funds for maintenance of gravestones in the <strong>Council</strong>'s<br />
1,922 789 0 Cemeteries<br />
To provide funds for the replacement of the gates leading into the<br />
557 229 0 Culverden Domain<br />
23,539<br />
238<br />
2,711<br />
786<br />
5,919<br />
5,995<br />
1,009 414 0 1,423<br />
Cemeteries<br />
Forrester Trust Reserves <strong>Community</strong> Services and Facilities To provide funds for maintenance of gravestones in the <strong>Council</strong>'s<br />
1,083 445 0 1,528<br />
To provide funds for maintenance of gravestones in the <strong>Council</strong>'s<br />
Cemeteries<br />
29,873 12,266 0 42,139<br />
Development Contributions Funds<br />
Fund Name<br />
Activity the Fund relates<br />
to<br />
Group of Activities the Fund relates<br />
Forecast Balance 1 Funds Deposited Funds Withdrawn Forecast Balance 30<br />
to Reason for Holding Reserve Funds<br />
July <strong>2012</strong><br />
<strong>2012</strong>-<strong>2022</strong><br />
<strong>2012</strong>-<strong>2022</strong><br />
June <strong>2022</strong><br />
Amberley Water Development Contributions Fund Water Supplies Water Supplies To provide funds for growth related projects for Amberley Water (95,630) (124,498) 307,585 (527,713)<br />
Ashley Rural Water Development Contributions <strong>Community</strong> Services Water Supplies To provide funds for growth related projects for Ashley Rural<br />
0 612,955 612,955 0<br />
Fund<br />
Water<br />
Cheviot Water Development Contributions Fund Water Supplies Water Supplies To provide funds for growth related projects for Cheviot Water 0 61,261 61,261 0<br />
Hanmer Springs Water Development Contributions Water Supplies Water Supplies To provide funds for growth related projects for Hanmer Springs<br />
0 0 0 0<br />
Fund<br />
Water<br />
<strong>Hurunui</strong> Rural Water Development Contributions Sewerage Sewerage To provide funds for growth related projects for <strong>Hurunui</strong> Rural<br />
0 167,002 167,002 0<br />
Fund<br />
Water<br />
Amberley Sewer Pipe Development Contributions Sewerage Sewerage To provide funds for growth related projects for Amberley Sewer<br />
41,041 (308,036) 717,678 (984,673)<br />
Fund<br />
Pipes<br />
Amberley Sewer Pond Development Contributions Sewerage Sewerage To provide funds for growth related projects for Amberley Sewer<br />
(88,026) 68,105 0 (19,921)<br />
Fund<br />
Pond<br />
Hanmer Springs Sewer Development Contributions Sewerage Sewerage To provide funds for growth related projects for Hanmer Springs<br />
0 284,198 284,198 0<br />
Fund<br />
Sewer<br />
Amberley Stormwater Development Contributions Stormwater and Drainage Stormwater and Drainage To provide funds for growth related projects for Amberley<br />
(122,286) (136,005) 100,000 (358,291)<br />
Fund<br />
Stormwater<br />
Hanmer Springs Stormwater Development Stormwater and Drainage Stormwater and Drainage To provide funds for growth related projects for Hanmer Springs<br />
0 188,146 188,146 0<br />
Contributions Fund<br />
Stormwater<br />
<strong>District</strong> Library Development Contributions Fund <strong>Community</strong> Services <strong>Community</strong> Services and Facilities To provide funds for growth related projects for the <strong>District</strong> Library (125,214) 125,214 0 (0)<br />
Hanmer Springs Medical Centre Development<br />
Contributions Fund<br />
Amberley Reserve Pavilion Development<br />
Contributions Fund<br />
Property <strong>Community</strong> Services and Facilities To provide funds for growth related projects for the Medical Centre<br />
0 190,789 190,789 0<br />
in Hanmer Springs<br />
Property <strong>Community</strong> Services and Facilities To provide funds for growth related projects for the Amberley<br />
(38,187) 9,293 0 (28,894)<br />
Reserve Pavilion<br />
H:\<strong>Long</strong> <strong>Term</strong> <strong>Plan</strong> Workings\<strong>Hurunui</strong> <strong>District</strong> <strong>Council</strong> LTP Budgets <strong>2012</strong>-<strong>2022</strong> - Post Submissions.xls 31/05/<strong>2012</strong> 12:03 p.m.<br />
195
www.hurunui.govt.nz<br />
Development Contributions Funds (Cont'd)<br />
Forecast Balance 30<br />
to Property <strong>Community</strong> Services and Facilities (32,396) 32,395 (1)<br />
Property <strong>Community</strong> Services and Facilities (670,604) 0 (720,674)<br />
Reserves <strong>Community</strong> Services and Facilities 260,141 888,979 445,689<br />
Reserves <strong>Community</strong> Services and Facilities 54,168 96,037 (194,994)<br />
Reserves <strong>Community</strong> Services and Facilities 20,913 22,077 (157,323)<br />
Reserves <strong>Community</strong> Services and Facilities 114,071 400,754 514,825<br />
Omihi Reserve Development Contributions Fund Reserves <strong>Community</strong> Services and Facilities (9,911) 9,911 0 0<br />
June <strong>2022</strong><br />
Forecast Balance 1 July <strong>2012</strong><br />
Funds Deposited <strong>2012</strong>-<strong>2022</strong><br />
Funds Withdrawn <strong>2012</strong>-<strong>2022</strong><br />
0 50,070 703,431 345,199 200,312 0 Fund Name<br />
Hanmer Springs Hall Development Contributions Fund<br />
Hanmer Springs Town Centre Development Contributions Fund<br />
Queen Mary Development Contributions Fund Amberley Township Reserves Development Contributions Fund<br />
Amberley Walking and Cycling Routes Development Contributions Fund<br />
Amberley Ward Reserves Development<br />
Contributions Fund<br />
Activity the Fund relates to<br />
Group of Activities the Fund relates<br />
Reason for Holding Reserve Funds<br />
To provide funds for growth related projects for the Hanmer Springs<br />
Hall<br />
To provide funds for growth related projects for the Town Centre<br />
in Hanmer Springs<br />
To provide funds for growth related projects for development of the<br />
former Queen Mary Hospital Site<br />
To provide funds for growth related projects for township reserves<br />
in Amberley<br />
To provide funds for growth related projects for Walking and<br />
Cycling Routes in the Amberley Ward<br />
To provide funds for growth related projects for ward reserves in<br />
Amberley<br />
To provide funds for growth related projects for the Omihi Reserve 36,727 65,695 107,505 (5,083)<br />
area in Hanmer Springs<br />
Reserves <strong>Community</strong> Services and Facilities To provide funds for growth related projects for the Domain in<br />
0 138,924 553,690 (414,766)<br />
To provide funds for growth related projects for Conical Walkway<br />
Hanmer Springs<br />
Hanmer Springs Conical Hill Walkway Development Contributions Fund<br />
Hanmer Springs Domain Upgrade Development Contributions Fund<br />
(655,193) 2,793,195 4,589,820 (2,451,818)<br />
Rate Reserve Funds<br />
Activity the Fund relates Group of Activities the Fund relates<br />
Forecast Balance 1 Funds Deposited Funds Withdrawn Forecast Balance 30<br />
Fund Name<br />
to<br />
to Reason for Holding Reserve Funds<br />
July <strong>2012</strong><br />
<strong>2012</strong>-<strong>2022</strong><br />
<strong>2012</strong>-<strong>2022</strong><br />
June <strong>2022</strong><br />
Interim treatment Water Supplies Water Supplies To fund capital projects relating to interim treatment of water 0 349,715 758,000 (408,285)<br />
Full Treatment Water Supplies Water Supplies To fund capital projects relating to full treatment of water 0 2,111,887 0 2,111,887<br />
Amberley Water Water Supplies Water Supplies To fund capital projects for Amberley water (431,410) 800,259 1,250,754 (881,905)<br />
Leithfield Beach Water Water Supplies Water Supplies To fund capital projects for Leithfield Beach water (123,483) 39,929 0 (83,554)<br />
Ashley Rural Water Water Supplies Water Supplies To fund capital projects for Ashley Rural water (1,122,367) 6,388,174 2,292,870 2,972,938<br />
Culverden Water Water Supplies Water Supplies To fund capital projects for Culverden water (54,170) 56,085 177,534 (175,618)<br />
Waiau Township Water Water Supplies Water Supplies To fund capital projects for Waiau Township water 56,142 272,559 210,940 117,761<br />
Amuri Plains Water Water Supplies Water Supplies To fund capital projects for Amuri Plains water (11,878) 64,515 53,461 (824)<br />
Balmoral Water Water Supplies Water Supplies To fund capital projects for Balmoral water 129,586 (58,824) 47,527 23,235<br />
Waiau Rural Water Water Supplies Water Supplies To fund capital projects for Waiau Rural water (160,393) 575,200 328,225 86,582<br />
Cheviot Water Water Supplies Water Supplies To fund capital projects for Cheviot water (1,246,301) 559,226 972,326 (1,659,401)<br />
Waipara Township Water Water Supplies Water Supplies To fund capital projects for Waipara Township water 71,364 109,414 20,000 160,778<br />
Hanmer Springs Water Water Supplies Water Supplies To fund capital projects for Hanmer Springs water (552,899) 1,164,275 1,030,630 (419,254)<br />
Hawarden - Waikari Water Water Supplies Water Supplies To fund capital projects for Hawarden-Waikari water (43,500) 414,366 115,087 255,779<br />
<strong>Hurunui</strong> Rural Water Water Supplies Water Supplies To fund capital projects for <strong>Hurunui</strong> Rural water (433,283) 2,657,718 2,443,323 (218,888)<br />
Amberley Sewer Sewerage Sewerage To fund capital projects for Amberley sewer (2,397,254) 1,732,990 956,888 (1,621,153)<br />
Culverden Sewer Sewerage Sewerage To fund capital projects for Culverden sewer (4,116) (11,339) 0 (15,455)<br />
Cheviot Sewer Sewerage Sewerage To fund capital projects for Cheviot sewer (53,334) 210,660 165,286 (7,960)<br />
Greta Valley Sewer Sewerage Sewerage To fund capital projects for Greta Valley sewer (14,256) 15,242 59,015 (58,029)<br />
Motunau Beach Sewer Sewerage Sewerage To fund capital projects for Motunau Beach sewer 19,963 20,523 179,325 (138,839)<br />
Waipara Sewer Sewerage Sewerage To fund capital projects for Waipara sewer (16,362) (16,584) 0 (32,946)<br />
H:\<strong>Long</strong> <strong>Term</strong> <strong>Plan</strong> Workings\<strong>Hurunui</strong> <strong>District</strong> <strong>Council</strong> LTP Budgets <strong>2012</strong>-<strong>2022</strong> - Post Submissions.xls 31/05/<strong>2012</strong> 12:03 p.m.<br />
196
<strong>Hurunui</strong> <strong>Community</strong> <strong>Long</strong> <strong>Term</strong> <strong>Plan</strong> <strong>2012</strong> - <strong>2022</strong><br />
Rate Reserve Funds (Cont'd)<br />
Fund Name<br />
Activity the Fund relates<br />
to<br />
Group of Activities the Fund relates<br />
Forecast Balance 1 Funds Deposited Funds Withdrawn Forecast Balance 30<br />
to Reason for Holding Reserve Funds<br />
July <strong>2012</strong><br />
<strong>2012</strong>-<strong>2022</strong><br />
<strong>2012</strong>-<strong>2022</strong><br />
June <strong>2022</strong><br />
Hanmer Springs Sewer Sewerage Sewerage To fund capital projects for Hanmer Springs sewer (1,279,755) 190,929 1,750,003 (2,838,828)<br />
Hawarden Sewer Sewerage Sewerage To fund capital projects for Hawarden sewer 658 110,937 146,476 (34,880)<br />
Waikari Sewer Sewerage Sewerage To fund capital projects for Waikari sewer (215,871) 352,651 120,873 15,907<br />
Amberley Beach Foreshore Protection Stormwater and Drainage Stormwater and Drainage To fund capital projects for Amberley Beach Foreshore Protection 94,849 23,743 0 118,592<br />
Amberley Stormwater Stormwater and Drainage Stormwater and Drainage To fund capital projects for Amberley stormwater (1,162,479) 1,590,923 378,001 50,442<br />
Jed River Clearance Stormwater and Drainage Stormwater and Drainage To fund capital projects for Jed River Clearance 1,789 (3,165) 0 (1,376)<br />
Hanmer Springs Stormwater Stormwater and Drainage Stormwater and Drainage To fund capital projects for Hanmer Springs Stormwater (221,096) 280,648 216,438 (156,886)<br />
(29,821) 29,821 0 (0)<br />
Road in Hanmer Springs<br />
<strong>District</strong> Library Development - Amberley Ward <strong>Community</strong> Services <strong>Community</strong> Services and Facilities To fund portion of <strong>District</strong> Library construction costs (69,406) 69,406 0 (0)<br />
Amberley Amenities <strong>Community</strong> Services <strong>Community</strong> Services and Facilities To fund capital projects for Amberley Ward Amenities (1,081,191) 150,884 222,981 (1,153,288)<br />
Amuri Amenities <strong>Community</strong> Services <strong>Community</strong> Services and Facilities To fund capital projects for Amuri Ward Amenities (50,695) 427,361 250,728 125,938<br />
Cheviot Amenities <strong>Community</strong> Services <strong>Community</strong> Services and Facilities To fund capital projects for Cheviot Ward Amenities (2,739) 82,790 0 80,051<br />
Glenmark Amenities <strong>Community</strong> Services <strong>Community</strong> Services and Facilities To fund capital projects for Glenmark Ward Amenities 8,060 47,694 0 55,754<br />
Hanmer Springs Amenities <strong>Community</strong> Services <strong>Community</strong> Services and Facilities To fund capital projects for Hanmer Springs Ward Amenities (593,740) 785,970 1,057,871 (865,640)<br />
<strong>Hurunui</strong> Amenities <strong>Community</strong> Services <strong>Community</strong> Services and Facilities To fund capital projects for <strong>Hurunui</strong> Ward Amenities (3,508) 1,243 0 (2,264)<br />
Amuri Medical General Property <strong>Community</strong> Services and Facilities To fund capital projects for medical centres in the Amuri Ward (775,229) 693,907 0 (81,322)<br />
Cheviot Medical General Property <strong>Community</strong> Services and Facilities To fund capital projects for medical centres in the Cheviot Ward (194,502) 533,355 1,150,700 (811,847)<br />
Hanmer Springs Medical General Property <strong>Community</strong> Services and Facilities To fund capital projects for medical centres in the Hanmer Springs<br />
(343,553) 389,411 0 45,858<br />
Ward<br />
Waikari Medical Centre Property <strong>Community</strong> Services and Facilities To fund capital projects for medical centres in the <strong>Hurunui</strong> Ward (107,900) 88,972 0 (18,928)<br />
Rural Fire Control Emergency Services Environmental and Safety To fund previous deficits recorded for Rural Fire Control (96,197) (62,782) 0 (158,979)<br />
Animal Control Compliance and Regulatory Environmental and Safety Funds utilised to offset the cost of Animal Control 47,976 0 47,976 0<br />
Functions<br />
Dog Control Compliance and Regulatory Environmental and Safety Funds utilised to offset the cost of Animal Control 0 0 0 0<br />
Functions<br />
Refuse Collection Waste Minimisation Environmental and Safety To fund previous deficits recorded for Refuse Collection (15,372) 15,372 0 0<br />
<strong>District</strong> Tourism <strong>District</strong> Promotion <strong>District</strong> Promotion To hold funds for projects relating to <strong>District</strong> Tourism 0 0 0 0<br />
Hanmer Springs Thermal Reserve Balance Hanmer Springs Thermal Hanmer Springs Thermal Pools & Spa Unused surpluses derived from the operation of the HSTP&S 2,858,695 1,597,297 2,049,780 2,406,212<br />
Pools & Spa<br />
Hanmer Springs Thermal Reserve Internal Loan Hanmer Springs Thermal Hanmer Springs Thermal Pools & Spa Interest-only internal debt relating to key expansion projects for the<br />
(8,698,003) 0 4,409,125 (13,107,128)<br />
Pools & Spa<br />
To fund contributions for the first stage of sealing of Woodbank<br />
HSTP&S<br />
(18,316,983) 24,853,355 22,862,141 (16,325,769)<br />
TOTAL RESERVE FUNDS (16,679,098) 30,513,517 28,891,667 (15,057,249)<br />
H:\<strong>Long</strong> <strong>Term</strong> <strong>Plan</strong> Workings\<strong>Hurunui</strong> <strong>District</strong> <strong>Council</strong> LTP Budgets <strong>2012</strong>-<strong>2022</strong> - Post Submissions.xls 31/05/<strong>2012</strong> 12:03 p.m.<br />
197
www.hurunui.govt.nz<br />
<strong>Council</strong> Controlled Organisations<br />
The <strong>Hurunui</strong> <strong>District</strong> <strong>Council</strong> has financial interest in the<br />
following <strong>Council</strong> Controlled Organisations:<br />
• <strong>Hurunui</strong> Holdings Limited<br />
• Enterprise North Canterbury<br />
• Transwaste Canterbury Limited<br />
• Canterbury Economic Development Company<br />
<strong>Hurunui</strong> Holdings Limited<br />
<strong>Hurunui</strong> Holdings Limited is 100% owned by the <strong>Hurunui</strong><br />
<strong>District</strong> <strong>Council</strong>. The Company was incorporated in July 1995,<br />
with a principal activity to arrange the sale of the Lyttleton Port<br />
Company Shares previously purchased from the <strong>Council</strong>. The<br />
transaction of the sale of the shares was completed in June 1996.<br />
In May 2004, <strong>Hurunui</strong> Roading Limited, a former Local Authority<br />
Trading Enterprise (LATE), was amalgamated with <strong>Hurunui</strong><br />
Holdings Limited. The Company is retained as a ‘shelf company’,<br />
principally due to the fact that it has significant tax losses to<br />
carry forward. The future of the Company is being reviewed.<br />
In June 2010, the <strong>Council</strong> transferred the remaining assets from<br />
<strong>Hurunui</strong> Holdings Limited and resolved to exempt the Company<br />
for under section 7 (3) of the Local Government Act 2002. The<br />
result of this action is that <strong>Hurunui</strong> Holdings Limited is not<br />
considered to be a <strong>Council</strong> Controlled Organisation (CCO)<br />
for the purposes of the LGA and as such is not required to be<br />
audited.<br />
Enterprise North Canterbury<br />
Enterprise North Canterbury provides promotions and<br />
economic development services for the North Canterbury<br />
region. On behalf of Waimakariri and <strong>Hurunui</strong> <strong>District</strong> <strong>Council</strong>s<br />
its activities are focussed on developing existing businesses and<br />
promoting new businesses within the region. The Trust also<br />
promotes the region as a visitor destination.<br />
The Mayors of the two <strong>Council</strong>s are trustees and the two<br />
Chief Executive Officers are advisory trustees. Other trustees<br />
are appointed jointly by the <strong>Hurunui</strong> and Waimakariri <strong>District</strong><br />
<strong>Council</strong>s.<br />
Key Performance Targets and Objectives<br />
The main objects of the trust are to cultivate and promote<br />
economic activity and foster growth in North Canterbury.<br />
Performance targets are based around:<br />
• Retaining and supporting existing businesses<br />
• Promote and encourage large business<br />
opportunities into North Canterbury<br />
• Lobby for infrastructure and facilities where<br />
there are gaps that impact on the creation of<br />
wealth<br />
• Assist town development when invited<br />
Transwaste Canterbury Limited<br />
Transwaste Canterbury Limited operates a regional landfill at<br />
Kate Valley and associated transport services in a joint venture<br />
with Canterbury Waste Services.<br />
The <strong>Hurunui</strong> <strong>District</strong> <strong>Council</strong> is one of the councils in the<br />
Canterbury region which between them own 50% of the shares<br />
in Transwaste Canterbury Limited. <strong>Hurunui</strong>’s share of the<br />
Company amounts to 1.2%.<br />
The council shareholders appoint representatives to a joint<br />
committee which in turn appoints four of the eight directors.<br />
Key Performance Targets and Objectives<br />
Ensure that Transwaste performs in accordance with its<br />
Statement of Intent.<br />
Canterbury Economic Development Company<br />
The Canterbury Economic Development Company was set up<br />
as a <strong>Council</strong> Controlled Organisation (CCO) in 2006 to enable<br />
the allocation of regional partnership funding for economic<br />
development from Central Government for the Canterbury<br />
Region. Two of the ten Company Directors represent North<br />
Canterbury; one was nominated by the three <strong>Council</strong>s (Kaikoura,<br />
<strong>Hurunui</strong> and Waimakariri <strong>District</strong>’s) and the other is an industry<br />
representative endorsed by the <strong>Council</strong>s. The intention was<br />
for these directors to represent North Canterbury during any<br />
contestable funding allocation processes undertaken by this<br />
CCO.<br />
This company was expected to have a short life and as the<br />
Regional Strategy Funding Programme has now been completed;<br />
the Board has met to discuss the future of the company and<br />
whether the company is shelved for future use of the councils.<br />
no definite plans for the company have been made.<br />
Key Performance Targets and Objectives<br />
• Facilitate project proposals in the region.<br />
• Provide leadership to stimulate and transform the<br />
Canterbury economy.<br />
• Communicate national shifts to regional economic<br />
development role players.<br />
198
<strong>Hurunui</strong> <strong>Community</strong> <strong>Long</strong> <strong>Term</strong> <strong>Plan</strong> <strong>2012</strong> - <strong>2022</strong><br />
<strong>Council</strong> Policies<br />
200 Policy Introduction<br />
201 Development Contributions Policy<br />
217 External Liability Management Policy<br />
219 Investment Policy<br />
221 Rates Remission for Biodiversity<br />
Policy<br />
222 Rates Remissions on Land Affected by<br />
Natural Calamity Policy<br />
223 Reserves Funding Policy<br />
224 Revenue and Funding Policy<br />
251 Significance Policy<br />
258 Treasury Risk Management Policy<br />
262 Internal Financing Policy<br />
199
www.hurunui.govt.nz<br />
Policy Introduction<br />
Most of the policies that are included in this section have been<br />
reviewed and updated, hence their inclusion into this <strong>Plan</strong>.<br />
These policies are:<br />
• Development Contributions Policy<br />
• External Liability Management Policy<br />
• Investment Policy<br />
• Internal Financing Policy<br />
• Rates Remissions on Biodiversity Policy<br />
• Reserves Funding Policy<br />
• Revenue and Financing Policy<br />
• Treasury Risk Management Policy<br />
A new policy was developed in light of the Canterbury<br />
earthquakes and the reminder that from time to time, situations<br />
beyond anyone’s control can significantly impact on our ability<br />
to pay rates. It is the:<br />
• Rate Remissions on Land Affected by Natural Calamity<br />
Another policy has been added for your information as it is an<br />
important one regarding <strong>Council</strong> decision making. This policy<br />
sets out guidelines and requirements around what we must<br />
consider when making decisions. It is the:<br />
• Significance Policy<br />
We do have many other policies in place that are not included<br />
in this <strong>Plan</strong>. Our policy manual can be located on our website.<br />
200
Development Contributions Policy<br />
Introduction<br />
Any growth in the <strong>District</strong> will impact on the existing reserves,<br />
sewerage, water, stormwater, roading, township infrastructure<br />
and recreation facilities. To ensure that the expected population<br />
growth does not adversely affect residents the <strong>Council</strong> has<br />
identified a number of infrastructural developments needed to<br />
cope with this growth.<br />
The Local Government Act 2002 (LGA) allows councils to<br />
collect ‘Development Contributions’, which are contributions<br />
of land or money made by developers towards the cost of<br />
providing new infrastructure, or increased capacity in existing<br />
infrastructure as a result of growth.<br />
<strong>Council</strong>s can also collect Financial Contributions under the<br />
Resource Management Act 1991 via rules in the <strong>District</strong> <strong>Plan</strong>. A<br />
<strong>Council</strong> cannot however take both Development Contributions<br />
and Financial Contributions for the same purpose. The type<br />
of contribution must be stipulated in the Development<br />
Contributions Policy.<br />
The <strong>Hurunui</strong> <strong>District</strong> <strong>Council</strong> has decided that growth in the<br />
<strong>District</strong> will be funded from 3 main sources:<br />
• Financial Contributions (levied under the Resource<br />
Management Act), which are designed to offset adverse<br />
effects of a particular development, and are identified in<br />
the <strong>Hurunui</strong> <strong>District</strong> <strong>Plan</strong>.<br />
• Development Contributions (charged under the Local<br />
Government Act 2002) which are for growth related<br />
projects that are identified in the <strong>Hurunui</strong> <strong>Long</strong> <strong>Term</strong><br />
<strong>Community</strong> <strong>Plan</strong>.<br />
• Existing ratepayers and residents through rates and<br />
loans.<br />
Review of Development Contributions<br />
Policy<br />
<strong>Council</strong>’s Development Contributions Policy as outlined in the<br />
2009-2019 LTCCP was based on a number of assumptions, of<br />
which growth projections formed a key component. <strong>Council</strong><br />
directed that the Policy should provide for a significant increase<br />
in development in the Amberley Township, and adjustments to<br />
the Policy were made accordingly. However, in the intervening<br />
period, the amount of growth has been significantly lower<br />
than anticipated and as a result, the level of Development<br />
Contributions received has been lower than budgeted.<br />
<strong>Hurunui</strong> <strong>Community</strong> <strong>Long</strong> <strong>Term</strong> <strong>Plan</strong> <strong>2012</strong> - <strong>2022</strong><br />
review concluded that the methodology was sound, and based<br />
on experience sourced from other <strong>Council</strong>s, suggestions were<br />
made to simplify the methodology.<br />
One of the key suggestions was to consider rationalising the<br />
number of collection areas for contributions. For metropolitan<br />
<strong>Council</strong>s, this is relatively easy to achieve as each new<br />
development will generally receive the same benefit from the<br />
growth projects identified as the next development. Due to the<br />
geography of the <strong>Hurunui</strong> <strong>District</strong> and the specific requirements<br />
for individual areas, <strong>Council</strong> felt that this could not be easily<br />
achieved.<br />
A further suggestion was for the <strong>Council</strong> to reinstate an<br />
interest component to the calculation of the contribution. This<br />
suggestion was made in the light that a number of the growth<br />
related projects will occur ahead of receiving a sufficient level of<br />
development contributions and as a result, there will normally be<br />
a holding cost attached to the project. When this was reviewed<br />
as part of the 2009-2019 LTCCP, the <strong>Council</strong> favoured the use<br />
of an inflation component rather than an interest component,<br />
which meant that the individual development contribution will<br />
increase on an annual basis to match the increase in inflation, so<br />
as a result, the developer who pays a contribution in four years’<br />
time will pay a higher level of contribution than the developer<br />
who pays now. The <strong>Council</strong> considered that the inclusion of an<br />
interest component would result in further increases to the<br />
individual contributions and decided against it.<br />
Updated growth projections based on Statistics New Zealand<br />
data have been provided which are at a more conservative rate<br />
of development than was provided for in the 2009-2019 LTCCP<br />
due to the <strong>Council</strong> not making specific adjustments to particular<br />
areas. It is important to note that due to the earthquake in<br />
Christchurch in February 2011 that the census scheduled for 8<br />
March 2011 was not undertaken and as a result, the population<br />
projections have not been updated. The census has now been<br />
scheduled for 5 March 2013 and the population projections can<br />
be re-assessed at that stage.<br />
Key Changes made to Methodology<br />
As a result of the review, the <strong>Council</strong> has made some changes<br />
to the methodology.<br />
In general, the <strong>Council</strong> has retained the projects that are subject<br />
to the methodology, so those projects that were identified in<br />
the 2009-2019 methodology have been continued, however, due<br />
to the lower level of growth that has resulted in the last three<br />
years, some projects have been deferred for a longer period.<br />
As preparation for the <strong>2012</strong>-<strong>2022</strong> LTP, the <strong>Council</strong> contracted<br />
Pricewaterhouse Coopers, in conjunction with the <strong>Council</strong>’s<br />
legal advisers, Buddle Findlay, to undertake a comprehensive<br />
review of out Development Contributions Methodology. The<br />
The <strong>Council</strong> has, in some cases, reduced the portion of the<br />
project that relates to growth, reflecting that some of the<br />
projects (particularly in relation to <strong>Community</strong> Infrastructure<br />
and Reserves) will benefit the wider community rather than<br />
201
www.hurunui.govt.nz<br />
strictly those ratepayers who occupy the new developments.<br />
Specifically, the <strong>Council</strong> has resolved that the portion of the<br />
costs relating to growth for: the Amberley Township Reserves<br />
will reduce to 90% (down from 100%); Amberley Walking and<br />
Cycling Routes at 80% (down from 100%); Amberley Ward<br />
Reserves at 90% (down from 100%) and Conical Hill Reserve<br />
Walkway at 90% (down from 100%).<br />
The <strong>Council</strong> proposes to introduce one new development<br />
contribution for the Hanmer Springs Domain. As a result of<br />
community discussions, in the preparation of the budgets to be<br />
included in the <strong>2012</strong>-<strong>2022</strong> <strong>Long</strong> <strong>Term</strong> <strong>Plan</strong>, the Hanmer Springs<br />
<strong>Community</strong> Board recommended that a total of $1 million be<br />
budgeted for an upgrade to the various facilities situated on the<br />
Hanmer Springs Domain. The full identification of the project<br />
will be undertaken in <strong>2012</strong>/2013 with proposed physical works<br />
to be undertaken in 2015/2016. It was resolved that the portion<br />
of the project that relates to growth is estimated at 50%.<br />
Result of Key Changes<br />
The <strong>Council</strong>’s overriding philosophy in regards to the<br />
Development Contributions was that the level of the individual<br />
contribution should be consistent with the level that has been<br />
charged in the past, with the adjustment for inflation and any<br />
adjustment required as a result of reducing the growth related<br />
portion of the project.<br />
With the uncertain nature of development due to the current<br />
situation in Canterbury as a whole and Christchurch in particular<br />
and coupled with the delays in obtaining updated population<br />
projections, it was felt that there was a need for consistency<br />
of the level of contributions for the short term, in particular in<br />
light of various developments that are in their formative stage<br />
whose feasibility may be reliant on the levels of contributions<br />
not increasing significantly.<br />
On the basis of a consistent level of individual development<br />
contributions received and with a lower level of development<br />
forecast, to ensure that the levels of contributions received is<br />
sufficient to meet the similar level of project costs, the <strong>Council</strong><br />
has proposed that the collection period for some of the projects<br />
be extended. This will allow the similar number of developments<br />
that contribute to the cost of the project to be undertaken,<br />
however, it is expected to take longer to achieve that.<br />
Specifics of the Development<br />
Contributions Policy<br />
The specifics of this policy are divided into three main sections,<br />
which identify the rationale and formula for contributions<br />
for: Reserves, Network infrastructure, and <strong>Community</strong><br />
infrastructure. These are preceded by a few general policy<br />
statements, as set out below.<br />
Development Contributions<br />
The <strong>Council</strong> is charging development contributions to ensure<br />
that the growth related capital expenditure identified in this <strong>Long</strong><br />
<strong>Term</strong> <strong>Plan</strong> (LTP) is recovered from those who directly benefit<br />
from it, rather than from ratepayers. Development contributions<br />
will be charged when the effect of the development, or the<br />
cumulative effect of developments, contribute to the need for<br />
the development of physical works or <strong>Council</strong> services and<br />
when these works or services have been allowed for in the LTP.<br />
Financial Contributions<br />
The purposes for which Financial Contributions may be taken<br />
under the Resource Management Act 1991 are related to<br />
section 5 of the Act (the sustainable management of natural<br />
and physical resources). A Financial Contribution can be<br />
imposed on a resource consent as long as it is in accordance<br />
with a rule in the district plan.<br />
Financial Contributions in <strong>District</strong> <strong>Plan</strong> can be taken to pay the<br />
costs of services such as roads, water supplies, sewerage and<br />
drainage systems which must be developed to address adverse<br />
effects on the environment.<br />
<strong>Council</strong> uses financial contributions to fund capital expenditure<br />
on infrastructure and community facilities where:<br />
• The development has not been foreseen in the LTP,<br />
but the effect of development directly contributes to<br />
the need for physical works on <strong>Council</strong> services and<br />
infrastructure; or<br />
• The <strong>Council</strong>’s population projections do not indicate<br />
that the costs of the <strong>Council</strong>’s investment will be<br />
recovered within an appropriate timeframe; or<br />
• The costs of <strong>Council</strong>-funded investment will impact on<br />
existing ratepayers; or<br />
• There is a need to offset adverse environmental effects<br />
that may result from a development, for example to<br />
improve a wetland to offset land disposal.<br />
Financial contributions are also used to take land for any<br />
infrastructure, reserves or other community facility within a<br />
development, where that land or those facilities will vest in the<br />
<strong>Council</strong>.<br />
Further information on Financial Contributions is available in<br />
the <strong>Council</strong>’s <strong>District</strong> <strong>Plan</strong>.<br />
Basis for Calculation of Contribution<br />
The detailed basis for assessment for developments is explained<br />
for each contribution. There are two broad groups of<br />
contributions. One applies to services and facilities that have a<br />
<strong>District</strong> wide benefit and the costs are apportioned across the<br />
202
<strong>Hurunui</strong> <strong>Community</strong> <strong>Long</strong> <strong>Term</strong> <strong>Plan</strong> <strong>2012</strong> - <strong>2022</strong><br />
whole <strong>District</strong>. The second group has more tangible benefits for<br />
a defined group of users and the costs are apportioned to the<br />
direct beneficiaries.<br />
Growth Forecasting Assumptions<br />
Over the last three census periods, the <strong>Hurunui</strong> <strong>District</strong> has<br />
experienced a 10% increase in its permanent resident population<br />
as measured by Statistics New Zealand (SNZ). As the census<br />
timed for 8 March 2011 was deferred due to the earthquake in<br />
Christchurch in February, there have been no suitable updated<br />
population projections. High rates of absentee ownership of<br />
lifestyle blocks and holiday homes (especially in Hanmer Springs)<br />
complicate the process of forecasting growth in the <strong>District</strong>, but<br />
statistical correlations indicate a significant relationship between<br />
the census data upon which these figures are based (the “usually<br />
resident population”) and overall growth in the <strong>District</strong> (the<br />
number of properties added to the rating database from which<br />
development contributions may be collected, including holiday<br />
homes, seasonal accommodation etc.) In some localities, this<br />
correlation is stronger with census data in the surrounding area<br />
(Ward), or even with that for the <strong>District</strong> as a whole, and in<br />
such cases it has been assumed that population growth in these<br />
wider areas is more of a driver of growth (i.e. that there will be<br />
more migration into the locality than the SNZ figures for that<br />
locality indicate).<br />
The SNZ medium series has been used for long range<br />
forecasting, as this series is the more likely to be stable over<br />
time. When preparing the methodology for the 2009-2019<br />
LTCCP, the <strong>Council</strong> deviated from the projections to take into<br />
account a level of potential development in Amberley, which due<br />
to a number of reasons, did not eventuate over the subsequent<br />
three year period. The <strong>Council</strong>, erring on the conservative side<br />
have adopted the medium series for the growth projections for<br />
the period of the LTP, however, instead of reducing the number<br />
of new units of growth to be collected in the defined period<br />
to calculate the resulting level of the individual development<br />
contribution, it has extended the collection period in which to<br />
achieve that same level of growth. The graphs on page 26 show<br />
the growth expected in key areas of the <strong>District</strong> and for the<br />
<strong>District</strong> as a whole.<br />
Accuracy of Predictions<br />
Unfortunately, the “area unit” boundaries used by SNZ do not<br />
always align with the areas from which the <strong>Council</strong> wishes to<br />
collect development contributions, and, accordingly, a number<br />
of assumptions have been used for calculating the population<br />
projections for these areas (e.g. subtracting or adding areas for<br />
which we do have figures; extrapolating GIS data for unknown<br />
areas in cases in which there is a good correlation between this<br />
and known areas).<br />
This procedure and all of the assumptions mentioned above are<br />
potential sources of error for this policy, but they are necessary<br />
approximations given the information and resources that we<br />
have to work with.<br />
There is obviously a large degree of uncertainty in any attempt<br />
at predicting the future (the variance between the SNZ high<br />
and low population projection series is 17%), and, given the<br />
large number of assumptions for this policy (detailed above),<br />
this is difficult to quantify. All trends have also been checked in<br />
a qualitative way by examining graphs.<br />
The accuracy of the growth projections is further complicated<br />
by the as yet unknown effect of ability for land to be rebuilt on<br />
in both Christchurch and Kaiapoi and the possible effects that<br />
may have on the <strong>Hurunui</strong> <strong>District</strong>, being in close proximity to<br />
both areas.<br />
Administration<br />
Development Contributions will be levied at different<br />
development ‘trigger’ points. Under the Local Government Act<br />
2002 the contribution can be collected on grant of a resource<br />
consent under the Resource Management Act, or the grant of a<br />
building consent under the Building Act or an authorisation for<br />
a service connection. These are detailed for each contribution<br />
in the pages following.<br />
The particular development contributions payable will be<br />
determined from the policy schedules applicable at the date of<br />
approval of a resource consent, building consent, or serviceconnection<br />
authorisation.<br />
If these contributions are paid within a period of two years of the<br />
approval of the resource consent, building consent, or serviceconnection<br />
authorisation, no further development contributions<br />
will be payable for the units for which the contributions<br />
have been paid. Contributions paid upon sections will cover<br />
subsequent development relating to one residential housing<br />
unit per section. Additional sections, units of housing, and/or<br />
units of water connected will incur additional contributions as<br />
determined from the policy schedules applicable at the date of<br />
approval of the resource consent, building consent, or serviceconnection<br />
authorization for the additional units.<br />
If contributions are not paid within the period of two years from<br />
the date of assessment, a reassessment of contributions payable<br />
will be made in accordance with the policy schedules applicable<br />
at the date of payment. The consequence of this is that the total<br />
amount of contributions payable will likely be greater than that<br />
set out in the assessment made at the date of approval.<br />
Contributions will be refunded, less administration costs, if the<br />
works for which they were collected (ore equivalent works) do<br />
not proceed within the “maximum period” identified for each<br />
work in Appendix 2.<br />
203
www.hurunui.govt.nz<br />
The requirement to pay a development contribution is not<br />
imposed as a condition of the resource consent or the building<br />
consent, but arises by operation of law as a consequence of the<br />
adoption of this policy, and is not therefore subject to either the<br />
objection and appeal processes set out in Resource Management<br />
Act or the determination procedures set out in the Building Act.<br />
Projects Costs<br />
Projected units of demand have been updated for all projects, and<br />
where the capital cost of a project has increased or decreased<br />
from the amount previously projected, the capital expenditure<br />
on which the development contributions are calculated has<br />
been amended. All figures have been inflation adjusted as shown<br />
in Appendix 2, and the projected development contribution<br />
payable for each year of the ten year financial planning period<br />
of this plan is set out in Appendix 3. (GST added and figures<br />
rounded).<br />
Reserves Development Contribution<br />
Policy<br />
Definition<br />
Within the <strong>Hurunui</strong> <strong>District</strong>, development contributions for<br />
reserves apply to land and the development of land that is under<br />
the control and management of the <strong>Hurunui</strong> <strong>District</strong> <strong>Council</strong><br />
or is being managed under the Reserve Management Act 1977.<br />
Development contributions are collected for the following<br />
purposes:<br />
• Land purchase of reserves for the reserves network<br />
including linkage strips<br />
Development of vested reserve land, including:<br />
• Construction of recreation facilities including buildings<br />
• Fencing and gates<br />
• Sport surfaces<br />
• Development and upgrading of reserves to meet growth<br />
• Developing access to reserves, including paths, roads,<br />
car parking and cycleways<br />
• Signage<br />
• <strong>Plan</strong>ting of major trees<br />
• Public toilets associated with the use of the reserve<br />
• Playgrounds and play equipment<br />
• Park furniture including seats, litter bins, picnic tables<br />
and lighting<br />
• Infrastructure, water, irrigation, power and sewage<br />
• Any site specific requirements<br />
Particular projects are the:<br />
• Development and upgrade of the Queen Mary Site for<br />
recreational use<br />
• Redevelopment of the Amberley Pavilion<br />
• Omihi Domain Netball Court Development<br />
• Development of facilities on the Hanmer Springs<br />
Domain<br />
• Conical Hill/Oregon Heights/Lucas Lane walkway<br />
development<br />
• Acquisition and development of Amberley Ward<br />
Reserves<br />
• Acquisition and development of Amberley Township<br />
Reserves<br />
Need to Undertake the Activity<br />
The <strong>Council</strong> aims to add to and develop its reserve network<br />
to provide areas that allow people to enjoy physical and<br />
passive recreation, while at the same time retaining areas of<br />
conservation value. All of the above are important for individual<br />
and community wellness. The capital projects proposed will add<br />
considerable improvements to the existing network of reserves<br />
and facilities.<br />
<strong>Community</strong> Outcomes to which the Activity<br />
Primarily Relates<br />
A desirable and safe place to live.<br />
Distribution of Benefits<br />
Economic<br />
The ongoing development of the reserves network will result in<br />
a better physical environment and a healthier community, which<br />
in turn will encourage more people to do business and live in<br />
the area.<br />
Social<br />
As growth increases and demographic and lifestyle changes<br />
occur, it is necessary for appropriate reserve space to be<br />
provided and enhanced, in line with community expectations.<br />
Cultural<br />
Open spaces, pedestrian links and sports fields provide<br />
opportunities for sporting and other recreational activities<br />
which are important aspects of the community’s culture.<br />
Environmental<br />
The development of reserves will enable the physical<br />
environment, including special heritage, vistas and open spaces<br />
to be protected as growth increases.<br />
204
<strong>Hurunui</strong> <strong>Community</strong> <strong>Long</strong> <strong>Term</strong> <strong>Plan</strong> <strong>2012</strong> - <strong>2022</strong><br />
Duration of Benefits<br />
The reserves that are being developed over the next twenty<br />
years will provide ongoing and long term benefits to the<br />
<strong>Community</strong>.<br />
Impact of the Activity on the Current and<br />
Future Well Being of the <strong>Community</strong><br />
The development of reserves and the facilities on reserves<br />
to meet the demands from growth will have a considerable<br />
impact on the social, economic, cultural and environmental<br />
well being of the community. Future changes in lifestyle and the<br />
structure of the population will require responsiveness on the<br />
part of the <strong>Council</strong> to provide recreation opportunities, social,<br />
environmental and cultural spaces that will encourage individuals<br />
to be involved in a range of leisure, play and recreation activities<br />
and will promote a healthy community. Benefits apply to the<br />
whole community from the provision of reserves. While there<br />
are wider community and environmental benefits from the<br />
creation of new reserves, the <strong>Council</strong> considers that future<br />
property owners should contribute directly to the development<br />
costs of reserves to ensure that the <strong>District</strong> can continue to<br />
provide the existing level of service to a growing population.<br />
Sources of Funding<br />
Loans<br />
Rates<br />
Development Contributions<br />
Yes<br />
Yes<br />
Yes<br />
For further detail on funding for capital expenditure refer to<br />
the Capital Expenditure Schedule on page 230 the Revenue and<br />
Financing Policy, and the Reserves Activity <strong>Plan</strong>.<br />
Calculation of Contribution<br />
There are two reserve contributions, one for <strong>District</strong> Wide<br />
Reserves applicable to all new residential units of demand. This<br />
is based on a wider sphere of use of the land. The other is for<br />
Amenity Reserves, which are primarily based around use by the<br />
residents of a ward or township. In both cases, contributions<br />
will be payable on a unit rate of demand for any new residential<br />
activity or subdivision, which creates a residential opportunity<br />
whether urban or rural.<br />
Contributions are calculated per lot by dividing the cost of the<br />
capital expenditure due to growth as detailed in appendix 1. by<br />
the number of units of growth expected in the target period.<br />
The resulting amounts are set out in appendix 2. These amounts<br />
are capped as per statutory requirements at the greater of 7.5%<br />
of the value of the additional allotments created by a subdivision<br />
or the value equivalent of 20 square metres of land for each<br />
additional household unit created by the development. This value<br />
will be calculated on an individual basis based upon estimated<br />
market value at the time that the contributions are collected.<br />
Points at which Contributions are Collected<br />
Contributions will be collected at the time of granting a<br />
subdivision consent, or if a separate certificate of title exists<br />
against which no development levy has been paid, at the time of<br />
issuing a building consent.<br />
Rationale for Individual Projects<br />
The Queen Mary site is envisaged as providing for future<br />
recreational opportunities for a twenty year planning horizon<br />
from 2004. There is a need to add to and improve this land<br />
and expand its potential for recreation use. It will be a <strong>District</strong><br />
Reserve and, as such, all expenditure on development will be<br />
spread across both existing and future units of demand across<br />
the district over the twenty year period.<br />
The development and upgrade of the Conical Hill/Oregon<br />
Heights/Lucas Lane reserve walkway is required to cater for the<br />
increased demands put on this reserve from growth and a local<br />
desire to fund this project. The cost will therefore be spread<br />
across the future units of demand from within the Hanmer<br />
Springs Ward.<br />
The development of the facilities at the Hanmer Springs Domain<br />
was identified by the Hanmer Springs <strong>Community</strong> Board as a<br />
key project to undertake after discussions with the community.<br />
The portion of the costs that is deemed to be growth related<br />
will be spread across the future units of demand from within the<br />
Hanmer Springs Ward.<br />
The Amberley Domain Pavilion redevelopment provides for an<br />
improvement to an amenity reserve. The cost will therefore be<br />
spread across both existing and future units of demand from<br />
within the Amberley Ward.<br />
The Omihi Reserve Netball court upgrade provides for an<br />
improvement to an amenity reserve. The cost will therefore be<br />
spread across both existing and future units of demand from<br />
within the Glenmark Ward.<br />
The acquisition and development of Amberley Ward Reserves<br />
are to provide for additional recreation facilities and sports<br />
grounds within the Ward that will be required due to growth<br />
over the foreseeable future, as identified in the Amberley Reserve<br />
Strategy. Its cost will thus be recovered from development<br />
occurring within the Amberley Ward. Due to a lower amount of<br />
growth since the initial planning period, the date for this project<br />
has been pushed out to 2029, and its cost will be spread across<br />
the future units of demand expected.<br />
The acquisition and development of Amberley Township<br />
Reserves are to provide for additional neighbourhood reserves,<br />
passive reserve areas and linkage strips, in line with the Amberley<br />
205
www.hurunui.govt.nz<br />
Reserve Strategy. These reserves will be required due to growth<br />
within the Township. Since, again, this is projected to slow, these<br />
have been rescheduled to start at a later date, and therefore<br />
the cost will be spread across the future units of demand from<br />
within the Amberley Township.<br />
Basis for Assessment<br />
It is recognised that there are two main types of reserves; those<br />
that are used by the community as a whole and those that are<br />
used more often by those living or working in the immediate<br />
locality of the reserve. For this reason the Reserves Policy is<br />
divided into “<strong>District</strong> Wide Reserves” And “Amenity Reserves”.<br />
Residents and workers in a Ward or township area make use of<br />
Amenity Reserves, while a wider cross section of the community<br />
will more often use a <strong>District</strong> Reserve. Accordingly the formula<br />
for calculating contributions is adjusted to recognise the type of<br />
reserve which development is occurring on. The exception to<br />
this rule is the Conical Hill/Oregon Heights/Lucas Lane Reserve<br />
which is a <strong>District</strong> Reserve but will be funded by growth in the<br />
Hanmer Ward. This is due to a desire by the local community<br />
to upgrade this reserve in order to accommodate the demands<br />
from growth occurring within the Ward. The <strong>Council</strong> has<br />
accepted this modification to the general policy.<br />
Multi Unit Residential Developments<br />
The payment for multi unit residential housing including flats,<br />
town houses, retirement villages and apartments, will be applied<br />
on the basis that each separate residential unit shall be treated<br />
as a separate unit of demand and be charged accordingly<br />
Travellers Accommodation Including Hotel/Motel<br />
Units and <strong>Long</strong> <strong>Term</strong> Workers Accommodation<br />
For each hotel, motel unit or separate unit of travellers or workers<br />
accommodation (excluding home stays accommodating less<br />
than 6 visitors) a payment of 50% of the standard reserve development<br />
contribution will be applied to each separate unit of<br />
accommodation let for tariff.<br />
For camping grounds, hostels, bunkhouses and backpackers<br />
accommodation or comparative travellers accommodation a<br />
contribution shall be determined on the basis of payment of<br />
50% of the standard reserve development contribution for each<br />
4 visitors the premises/camping ground can accommodate.<br />
Any manager’s accommodation associated with travellers or<br />
workers accommodation shall be charged at the full rate.<br />
Assumptions<br />
That all households should contribute equally to either <strong>District</strong><br />
or Amenity Reserves irrespective of whether the unit of demand<br />
is urban based or rurally based. This assumption is based on the<br />
fact that the capital expenditure being proposed on reserves for<br />
growth is likely to be used on an equal basis by both urban and<br />
rural dwellers.<br />
That development that creates equivalent transient demands for<br />
infrastructure upgrades should contribute on a reduced scale.<br />
That the <strong>District</strong> will grow as per the forecasts set out in this<br />
Policy.<br />
Circumstances for Refunds or Reductions<br />
In the event that planned reserve purchases, developments or<br />
alternative upgrades are not undertaken within the “maximum<br />
period” set out in appendix 2, development contributions will be<br />
refunded, after allowing for the associated administration costs.<br />
(In the case of land taken for reserve purposes, the maximum<br />
period will be negotiated with the land owner at the time the<br />
contribution is made).<br />
Where land is transferred to the <strong>Council</strong> for reserve purposes<br />
by agreement that will have benefits to the community that are<br />
similar to those which would be provided by a reserve under<br />
its existing control, the <strong>Council</strong> may agree to a reduction in<br />
the reserve contribution to acknowledge the benefit. For<br />
Amberley Township Reserves and Amberley Ward Reserves,<br />
circumstances where this may be appropriate are detailed<br />
further in the Amberley Reserve Strategy.<br />
Where the <strong>Council</strong> and a developer agree that the development<br />
will incorporate assets of benefit to the community, the <strong>Council</strong><br />
may agree to a reduction in the reserve contribution to<br />
acknowledge the benefit.<br />
Where the <strong>Council</strong> assesses that no additional demand on<br />
reserves will arise from a development, the <strong>Council</strong> may agree<br />
to a reduction in the reserve contribution.<br />
Network Infrastructure Development<br />
Contributions Policies<br />
Definition<br />
Within the <strong>Hurunui</strong> <strong>District</strong>, network infrastructure for the<br />
purposes of development contributions includes sewer, water<br />
and stormwater services under the control and management of<br />
the <strong>Hurunui</strong> <strong>District</strong> <strong>Council</strong>.<br />
Policy Principles<br />
The policies for the assessment of development contributions<br />
for sewer, water, and stormwater have been developed on the<br />
206
<strong>Hurunui</strong> <strong>Community</strong> <strong>Long</strong> <strong>Term</strong> <strong>Plan</strong> <strong>2012</strong> - <strong>2022</strong><br />
broad principle that infrastructure costs incurred to meet<br />
demands associated with growth should be spread as equitably<br />
and as practicable among the beneficiaries of the expenditure.<br />
The primary beneficiaries of expenditure on new network<br />
infrastructure are developers, builders, and new property /<br />
building owners; hence development contributions are collected<br />
for the costs involved.<br />
<strong>District</strong> <strong>Plan</strong> Development Areas<br />
The <strong>District</strong> <strong>Plan</strong> identifies zoning for future growth in<br />
Amberley, Hanmer Springs and Leithfield. Growth is also<br />
occurring in areas serviced by the Ashley, Cheviot and <strong>Hurunui</strong><br />
Rural Water schemes. Growth in other towns in the <strong>District</strong><br />
can be accommodated without substantial upgrading of water,<br />
sewerage or stormwater infrastructure.<br />
Formula<br />
The formula and the contribution for each category of network<br />
infrastructure is the capital cost of the project attributable<br />
to growth Appendix 2 divided by the number of new units<br />
of demand expected in the target period, producing the<br />
contribution amounts shown in Appendix 3.<br />
Point at which Contributions are Collected<br />
Contributions for rural water schemes are collected at the<br />
point of making an application to connect to the scheme in<br />
question. Contributions for stormwater are collected when a<br />
subdivision consent is granted and / or where subsequently an<br />
additional dwelling house or business premise is promoted on<br />
the same lot at the time when either a resource consent or<br />
a building consent is granted. All other network infrastructure<br />
connections (i.e. Sewerage and Township water) are collected at<br />
the time of granting a subdivision consent or if no development<br />
levy has been paid, at the time of issuing a building consent or<br />
resource consent or at time of connection to the network<br />
service.<br />
Connecting to Existing Services<br />
In addition to any Development Contribution charge, all<br />
connections to utilities and services will be charged a connection<br />
fee, based on an assessment of actual costs.<br />
Water Infrastructure Policy<br />
The <strong>Hurunui</strong> <strong>District</strong> <strong>Council</strong> operates several different water<br />
supply schemes and while the policies and methodology for<br />
calculating development contributions are the same for each<br />
scheme, the actual level of contribution varies because of<br />
different growth and planned expenditure.<br />
The Schedule details the different amounts applicable to<br />
developments within each scheme.<br />
Need to Undertake the Activity<br />
The <strong>Council</strong> provides potable water to avoid the risk of water<br />
borne diseases affecting public health. The growth of the <strong>District</strong><br />
will result in additional connections to the system which will<br />
increase the demand on existing services. The <strong>Council</strong> believes<br />
it should be developing long term sustainable solutions that<br />
cater for users of today and tomorrow; therefore, any scheme<br />
it develops or extends will have a planned growth component<br />
within it.<br />
<strong>Community</strong> Outcomes to Which the Activity<br />
Primarily Contributes<br />
• A place with essential infrastructure<br />
• A desirable place to Live<br />
Distribution of Benefits<br />
Economic<br />
The supply of potable water supports economic growth, which<br />
impacts on the whole community; however the individuals that<br />
are connecting to a system will gain the direct benefits of the<br />
service.<br />
Social<br />
It is convenient and efficient that an agreed level of supply is<br />
made available. The expansion of the systems in line with growth<br />
benefits the health of individuals and the community.<br />
Cultural<br />
The extraction of water is done in a manner that respects<br />
cultural relationships with water.<br />
Environmental<br />
The extraction of water for potable water supply systems<br />
impacts on the natural waterways and ecosystems of this<br />
district. Sustainable growth contributes to the maintenance of<br />
a high quality natural environment.<br />
Duration of Benefits<br />
The water supply systems that are being upgraded over the years<br />
within their respective planning horizons will provide long-term<br />
benefit to the <strong>Community</strong>. The duration of benefit is dependent<br />
on the ability to gain the necessary resource consents, but is<br />
anticipated to be a minimum of 35 years with any engineering<br />
solution intended to provide future benefits equivalent to the<br />
design life of the system’s components which for certain assets<br />
is in excess of 70 years.<br />
Impact of the Activity on the Current and Future<br />
Well Being of the <strong>Community</strong><br />
207
www.hurunui.govt.nz<br />
Water is a necessity of life and the supply of potable water<br />
to meet the needs of growth will have a considerably positive<br />
impact on the social, economic and environmental well being of<br />
the community.<br />
The capacity of the schemes allow for growth that ensures not<br />
only current users, but also future users, will benefit from the<br />
system. It is equitable that those who join a scheme should<br />
contribute to the cost of providing for growth. Current users<br />
must fund the cost of additional capacity until those future users<br />
are connected; therefore it is reasonable that when those future<br />
users arrive they make a contribution to the cost of catering for<br />
that growth.<br />
Sources of Funding:<br />
Loans<br />
Rates<br />
Development Contributions<br />
Yes<br />
Yes<br />
Yes<br />
For further detail on funding for capital expenditure refer to the<br />
Capital Expenditure Schedule, the Revenue and Financing Policy<br />
or the Water Activity <strong>Plan</strong>.<br />
Calculation of Contribution<br />
The contribution for Hanmer Springs Water, Amberley Water<br />
and Ashley, Cheviot and <strong>Hurunui</strong> Rural Water Supplies will be<br />
calculated on the cost of the capital expenditure associated with<br />
increasing the capacity of the systems to enable growth divided<br />
by the number of new units of demands (including business and<br />
residential use development) that the area is capable of servicing.<br />
The result is the cost that will apply to each new unit of demand.<br />
The units of demand for Hanmer have been calculated on the<br />
basis of providing capacity for the future. The units of demand<br />
for Amberley, Cheviot Rural, Ashley Rural and <strong>Hurunui</strong> Rural<br />
have been calculated on the basis of providing capacity for<br />
the future as well. These figures have been extended from the<br />
planning periods set out in earlier versions of this policy due to<br />
lower than expected growth.<br />
Basis for Assessment<br />
Current users and future users benefit equally from the maximum<br />
capacity of a water supply system. Based on the assumption<br />
that one current user will consume the same amount of system<br />
capacity as a future user, they should equally share the cost of<br />
providing that maximum capacity.<br />
Residential & Business Activities (Urban Areas)<br />
Each new standard connection or subdivision lot established<br />
will be charged one development contribution as identified in<br />
the schedule. Additional business established on the same lot<br />
will be charged a separate development contribution.<br />
Multi Unit Residential Developments:<br />
The payment for multi unit residential housing including flats,<br />
town houses, retirement villages and apartments, will be applied<br />
on the basis that each separate residential unit shall be treated<br />
as a separate unit of demand and be charged accordingly.<br />
Travellers Accommodation Including Hotel/Motel Units and<br />
<strong>Long</strong> <strong>Term</strong> Workers Accommodation (Urban Areas)<br />
For each hotel, motel unit or separate unit of travellers or<br />
workers accommodation (excluding home stays accommodating<br />
less than 6 visitors) a payment of 50% of the standard water<br />
development contribution will be applied to each separate unit<br />
of accommodation let for tariff. For camping grounds, hostels,<br />
bunkhouses and backpackers accommodation or comparative<br />
travellers accommodation a contribution shall be determined on<br />
the basis of payment of 50% of the standard water development<br />
contribution for each 4 visitors the premises/camping ground<br />
can accommodate. Any manager’s accommodation associated<br />
with travellers or workers accommodation shall be charged at<br />
the full rate.<br />
Assumptions<br />
That all Residential and Business zone properties consume the<br />
same unit of demand and that where this is not the case a means<br />
exist to determine a variance to the standard (see above).<br />
That the <strong>District</strong> will continue to grow as per the population<br />
forecasting contained within this Policy and new infrastructure<br />
assets will be designed to cater for additional growth capacity.<br />
Circumstances for Refunds or Reductions<br />
In the event that planned system upgrades or alternative<br />
upgrades are not undertaken within the “maximum period” set<br />
out in appendix 2. development contributions will be refunded,<br />
after allowing for the costs of investigating the upgrade options<br />
and associated administrative costs.<br />
There will be no postponements of payments or remissions of<br />
payments.<br />
Sewer Infrastructure Policy<br />
The <strong>District</strong> operates sewerage schemes in Amberley and<br />
Hanmer which are subject to the pressures of growth and<br />
require extra capacity. While the policies and methodology<br />
for calculating Development Contributions are the same for<br />
each scheme, the actual level of contribution varies because<br />
of different growth and the level of planned expenditure. The<br />
Schedule (Appendix 3) details the different amounts applicable<br />
to developments within each area.<br />
In addition to the Amberley sewerage contribution, <strong>Council</strong><br />
208
<strong>Hurunui</strong> <strong>Community</strong> <strong>Long</strong> <strong>Term</strong> <strong>Plan</strong> <strong>2012</strong> - <strong>2022</strong><br />
also charges financial contributions under the <strong>District</strong> <strong>Plan</strong><br />
in particular areas along Osbourne Road, Douglas Road<br />
and Leithfield Road. (Further information on the areas these<br />
contributions apply to can be obtained from <strong>Council</strong>’s offices.)<br />
Need to Undertake the Activity<br />
The <strong>Council</strong> provides reticulated sewer treatment and<br />
disposal systems to achieve high quality public health and to<br />
minimise adverse effects on the receiving environment. There<br />
is an expectation from the community that high environmental<br />
standards will be met.<br />
The growth of the <strong>District</strong> and the resulting additional<br />
connections to the system will increase the demand on existing<br />
services. The <strong>Council</strong> believes it should be developing long<br />
term sustainable solutions that cater for users of today and<br />
tomorrow, therefore, any scheme it develops or extends will<br />
have a planned growth component within it.<br />
<strong>Community</strong> Outcomes to Which the Activity<br />
Primarily Contributes<br />
• A place with essential infrastructure<br />
• A place that demonstrate environmental responsibility<br />
• A desirable Place to Live<br />
Distribution of Benefits<br />
Economic<br />
Effective and efficient sewerage treatment and disposal systems<br />
will support economic growth, which impacts on the whole<br />
community, however the individuals that are connecting to a<br />
system, will gain the direct benefits of the service.<br />
Social<br />
The expansion of the systems in line with growth benefits the<br />
health of individuals and the community.<br />
Cultural<br />
Effective sewerage treatment and disposal systems and practices<br />
respect the values of all sections of the community.<br />
Environmental<br />
The health of the <strong>District</strong>’s water resources and natural<br />
ecosystems will be better protected by reticulated treatment<br />
and disposal systems.<br />
Duration of Benefits<br />
The reticulation, treatment and disposal systems that are being<br />
implemented over the life if this <strong>Plan</strong> is anticipated to have a<br />
minimum of 35 years benefit, with any engineering solution<br />
intended to provide future benefits equivalent to the design life<br />
of the systems’ components.<br />
Impact of the Activity on the Current and Future<br />
Well Being of the <strong>Community</strong><br />
The continued provision of sewerage reticulation treatment<br />
and disposal systems to meet the needs of growth will have a<br />
considerable positive impact on the economic, social, cultural<br />
and environmental well being of the community. The capacity<br />
of the schemes allow for growth that ensures not only current<br />
users, but also future users, will benefit from the system. It<br />
is equitable that those who join a scheme should contribute<br />
to the cost of providing for that growth. Current users must<br />
fund the cost of additional capacity until those future users are<br />
connected; therefore it is reasonable that when those future<br />
users arrive they make a contribution to the cost of catering<br />
for that growth.<br />
Sources of Funding:<br />
• Loans Yes<br />
• Rates Yes<br />
• Development Contributions Yes<br />
For further detail on funding for capital expenditure refer to the<br />
Expenditure Schedule at the rear of this Policy, the Revenue and<br />
Funding Policy or the Sewerage Activity <strong>Plan</strong>.<br />
Calculation of Contribution<br />
The contribution for both Amberley and Hanmer Sewerage<br />
Schemes is calculated on the cost of the capital expenditure<br />
associated with increasing the capacity of the system to provide<br />
for growth, divided by the number of units of demand that are<br />
expected. The result is the cost that will apply to each new lot.<br />
(Refer to Appendix 3 for details of each contribution.)<br />
The Amberley Sewerage Scheme is broken down into two<br />
contributions: one which applies to all Amberley Urban areas<br />
serviced by the scheme for a pond upgrade which will increase<br />
capacity for the whole scheme; the other for pipe upgrades<br />
which benefit and are therefore funded by future Amberley<br />
township units only. The Hanmer Springs capital expenditure<br />
is funded by new units of growth within the Hanmer Springs<br />
sewer area.<br />
209
www.hurunui.govt.nz<br />
Basis for Assessment for Treatment, Disposal and<br />
Reticulation Costs<br />
Current users and future users benefit equally from the maximum<br />
capacity of a sewerage system. Based on the assumption that<br />
one current user will consume the same amount of system<br />
capacity as a future user, they should equally share the cost of<br />
providing that maximum capacity.<br />
Residential & Business Activities (Urban Areas):<br />
Each new standard connection or subdivision lot established<br />
will be charged one development contribution as identified in<br />
the schedule. Additional business established on the same lot<br />
will be charged a separate development contribution.<br />
Multi Unit Residential Developments:<br />
The payment for multi unit residential housing including flats,<br />
town houses, retirement villages and apartments, will be applied<br />
on the basis that each separate residential unit shall be treated<br />
as a separate unit of demand and be charged accordingly.<br />
Travellers Accommodation Including Hotel/Motel Units and<br />
<strong>Long</strong> <strong>Term</strong> Workers Accommodation (Urban Areas)<br />
For each hotel, motel unit or separate unit of travellers or<br />
workers accommodation (excluding home stays accommodating<br />
less than 6 visitors) a payment of 50% of the standard sewer<br />
development contribution will be applied to each separate unit<br />
of accommodation let for tariff. For camping grounds, hostels<br />
bunkhouses and backpackers accommodation or comparative<br />
travellers accommodation a contribution shall be determined on<br />
the basis of payment of 50 % of the standard sewer development<br />
contribution for each 4 visitors the premises/camping ground<br />
can accommodate. Any managers’ accommodation associated<br />
with travellers’ or workers accommodation shall be charged at<br />
the full rate.<br />
Assumptions<br />
That all residential lots produce the same unit of demand.<br />
That the <strong>District</strong> will continue to grow as set out within the<br />
population forecasting contained within this policy.<br />
That new infrastructural assets will be designed to allow for<br />
additional growth capacity.<br />
That the costs of reticulating, treating and disposing of sewage<br />
are in proportion to the volume of sewage produced.<br />
Circumstances for Refunds or Reductions<br />
In the event that planned system upgrades, or alternative<br />
upgrades, are not undertaken within the “maximum period” set<br />
out in appendix 2, development contributions will be refunded,<br />
after allowing for the costs of investigating the upgrade options<br />
and associated administrative costs.<br />
There will be no postponements of payments or remissions of<br />
payments.<br />
Stormwater and Drainage<br />
Infrastructure Policy<br />
The <strong>Council</strong> is establishing a new stormwater area in Hanmer<br />
Springs for stormwater disposal associated with expected<br />
demands created by growth. The <strong>Council</strong> will also undertake<br />
extensive upgrades to the Amberley stormwater system, for<br />
off-site upgrades to the reticulation system required by the<br />
expected growth in the township and for flood-management<br />
purposes (a component of which will cater for future growth).<br />
All on-site stormwater works in Amberley will be funded by<br />
developers through financial contributions under the <strong>District</strong><br />
<strong>Plan</strong>. The stormwater systems and upgrades will cater for growth.<br />
The policy and methodology for calculating Development<br />
Contributions are the same for each area, but the actual level of<br />
contribution varies depending upon the capital cost and upon<br />
the growth component.<br />
Appendix 3. includes details of the different amounts applicable<br />
to developments within each township area.<br />
Need to Undertake the Activity<br />
The <strong>Council</strong> needs to provide stormwater systems to achieve<br />
high quality public health and to minimise adverse effects on the<br />
receiving environment.<br />
Effective stormwater systems and networks remove a constraint<br />
on land development.<br />
There is an expectation from the community for high<br />
environmental standards to be met.<br />
The growth of the <strong>District</strong> and the resulting additional<br />
connections will increase the demand on existing services. The<br />
<strong>Council</strong> believes it should be developing long-term sustainable<br />
solutions that cater for users tomorrow; therefore, any scheme<br />
it develops will primarily be designed to accommodate planned<br />
growth.<br />
<strong>Community</strong> Outcomes to Which the Activity<br />
Primarily Contributes<br />
• A place with essential infrastructure<br />
• A desirable and safe place to live<br />
Distribution of Benefits<br />
Economic<br />
Effective and efficient stormwater systems will support economic<br />
growth and mitigate the costs associated with flooding for the<br />
whole community. The individuals that are connecting to a<br />
system will gain the direct benefits of the service.<br />
210
<strong>Hurunui</strong> <strong>Community</strong> <strong>Long</strong> <strong>Term</strong> <strong>Plan</strong> <strong>2012</strong> - <strong>2022</strong><br />
Social<br />
Health, efficiency and safety benefits apply indirectly to the<br />
whole community and directly to those who are connected to<br />
each scheme. Stormwater systems minimise harm to people<br />
from potential flooding.<br />
Cultural<br />
Effective stormwater systems protect community values<br />
associated with waterways and incorporate the cultural<br />
concerns of Maori with land and water.<br />
Environmental<br />
Stormwater systems contribute to a high quality natural<br />
environment and mitigate the adverse environmental effects of<br />
flooding.<br />
Duration of Benefits<br />
The stormwater systems that are being implemented will<br />
provide a long-term benefit to the <strong>Community</strong>. The duration<br />
of benefit is dependent on the ability to gain the necessary<br />
resource consents, but is anticipated to be a minimum of 35<br />
years.<br />
Impact of the Activity on the Current and Future<br />
Well Being of the <strong>Community</strong><br />
Effective and efficient stormwater systems that meet the needs<br />
of growth will have a considerable impact on the current and<br />
future social, economic, cultural and environmental well being of<br />
the community.<br />
Current users must fund the cost of providing capacity until<br />
those future users are connected; therefore it is reasonable that<br />
when those future users arrive they make a contribution that<br />
relates to the cost of providing stormwater systems.<br />
Sources of Funding:<br />
Loans<br />
Rates<br />
Development Contributions<br />
Yes<br />
Yes<br />
Yes<br />
For further detail on funding for capital expenditure refer to the<br />
Funding Schedule at the rear of this Policy or the Finance and<br />
Revenue Policy.<br />
Calculation of Contribution<br />
The contribution is calculated on the cost of the capital<br />
expenditure associated with constructing that component of<br />
the stormwater systems that cater for growth (estimated at<br />
about 80% in the case of Hanmer Springs and Amberley, and then<br />
dividing it by the number of new units of demand establishing<br />
within the area being serviced. The result is the cost that will<br />
apply to each new lot. (Refer to appendix 2. for details of each<br />
contribution.)<br />
Basis for Assessment<br />
Future users both business and residential benefit equally from<br />
the maximum capacity of a stormwater system. Based on the<br />
assumption that one current user will need the same amount of<br />
system capacity as a future user, they should equally share the<br />
cost of providing that maximum capacity. Each new business or<br />
subdivision allotment that is created will pay on the basis of one<br />
unit of demand.<br />
Assumptions<br />
That all Residential and Business zone properties have the same<br />
volume of run off.<br />
That the <strong>District</strong> will continue to grow as predicted in the<br />
population forecasting as contained in this Policy and the new<br />
infrastructure assets will be designed to accommodate the<br />
growth projected over 26 years (2004-2030).<br />
Circumstances for Refunds or Reductions<br />
In the event that planned system upgrades, or alternative<br />
upgrades, are not undertaken within the “maximum period” set<br />
out in appendix 2, development contributions will be refunded,<br />
after allowing for the costs of investigating the upgrade options<br />
and associated administrative costs.<br />
There will be no postponements of payments or remissions of<br />
payments.<br />
<strong>Community</strong> Infrastructure<br />
Development Contribution Policy<br />
Within the life of the LTP, the <strong>Hurunui</strong> <strong>District</strong> <strong>Council</strong> has<br />
planned for considerable capital investment on <strong>Community</strong><br />
Infrastructure that is under its management and control.<br />
A proportion of this expenditure relates to catering for<br />
the increased demands of growth. The five projects listed<br />
below relate to planned capital development associated with<br />
community infrastructure demands within the HLTCP.<br />
• <strong>Hurunui</strong> <strong>District</strong> Library<br />
• Hanmer Springs Medical Centre<br />
• Hanmer Springs Hall redevelopment<br />
• Hanmer Springs town centre development<br />
• Amberley walkway & cycleway network<br />
All these community infrastructure projects fall under the<br />
‘<strong>Community</strong> Services and Facilities’ group of activities.<br />
211
www.hurunui.govt.nz<br />
Need to Undertake the Projects<br />
The community infrastructure projects identified are essential<br />
to the ongoing economic, social, cultural and environmental<br />
wellbeing of the <strong>District</strong>, especially the Hanmer Springs and<br />
Amberley Townships.<br />
In particular, the <strong>District</strong> Library facilities provide opportunities<br />
for people and visitors to the <strong>District</strong> to participate in life<br />
long learning experiences, and have access to high standards<br />
of education. The Hanmer Springs projects will enhance<br />
community facilities, provide access to health care, and result<br />
in an improved and pleasant environment, which will meet the<br />
demands of future growth. Extending and improving Amberley’s<br />
walkway and cycleway network will help create connectivity<br />
between the existing township and new development areas.<br />
<strong>Community</strong> Outcomes to Which the Activity<br />
Primarily Contributes<br />
• A place where traditional rural values and heritage<br />
make <strong>Hurunui</strong> unique<br />
Distribution of Benefits<br />
Economic<br />
Improved community facilities will draw people into the <strong>District</strong><br />
to invest in new business or to participate in the labour force.<br />
Cultural<br />
Facilities provide opportunities for participation in educational,<br />
recreational and cultural activities.<br />
Social<br />
<strong>Community</strong> infrastructure supports a high quality of life for<br />
residents through participation in activities and access to<br />
services.<br />
The built environment is integral to the look, feel and functionality<br />
of the <strong>District</strong>.<br />
Environmental<br />
<strong>Community</strong> infrastructure supports the natural environment by<br />
providing appropriate places to carry out activities.<br />
Duration of Benefits<br />
<strong>Community</strong> infrastructure provides benefits for the duration of<br />
the assets. Given the nature of the assets, the duration is likely<br />
to be for the next 50 years.<br />
Impact of the Activities on the Current and Future<br />
Well Being of the <strong>Community</strong><br />
The provision and development of the <strong>Community</strong><br />
infrastructure identified to meet the demands of growth will<br />
have a considerable impact on the social, economic, cultural and<br />
environmental wellbeing of the whole community. The proposed<br />
projects will each provide varying levels of benefit to different<br />
members of the community. The <strong>District</strong> Library will provide<br />
principally <strong>District</strong> benefits whereas the Hanmer Springs Medical<br />
Centre, Hanmer Springs Hall redevelopment and Hanmer<br />
Springs town centre development will provide benefits to those<br />
owning property in the Hanmer Springs Ward. The expansion of<br />
Amberley’s walkways and cycleways will principally be of benefit<br />
to the town’s residents.<br />
Future population growth, the demographic profile of the<br />
<strong>District</strong> and changes in lifestyle will require the <strong>Council</strong> to<br />
provide a range of opportunities for individuals and groups to<br />
participate in at various levels.<br />
The <strong>Council</strong> considers that future property owners should<br />
contribute to the provision of these projects proposed under<br />
<strong>Community</strong> Infrastructure as they provide opportunities for<br />
individual and group wellbeing.<br />
Sources of Funding:<br />
Loans<br />
Rates<br />
Development Contributions<br />
Yes<br />
Yes<br />
Yes<br />
For further detail on funding for capital expenditure refer to<br />
appendix 2. at the rear of this Policy, the Finance and Revenue<br />
Policy or the Libraries / Local Facilities and Maintenance Activity<br />
<strong>Plan</strong>s.<br />
Point at which Contributions are Collected<br />
Contributions for community infrastructure will be collected<br />
upon granting a subdivision consent or Building Consent or<br />
Resource Consent. All new subdivisions will be subject to the<br />
community infrastructure contributions set out in appendix 2.<br />
Where allotments already exist but have not been built on the<br />
contribution will be collected on the granting of the building<br />
consent or resource consent.<br />
Basis for Assessment<br />
The Library, medical centre and hall redevelopment benefits<br />
current and future users equally from access to and opportunities<br />
provided by these items of community infrastructure. Therefore<br />
each unit of demand, both existing and future, should contribute<br />
equally to infrastructure intended to be constructed over the<br />
period (set at the initial planning period of 10 years from 2004).<br />
212
<strong>Hurunui</strong> <strong>Community</strong> <strong>Long</strong> <strong>Term</strong> <strong>Plan</strong> <strong>2012</strong> - <strong>2022</strong><br />
The Hanmer Springs town centre development has some<br />
benefit to existing residents, but is required due to increasing<br />
infrastructure to cope with the expected growth over the<br />
planning period. <strong>Council</strong> has determined that it is fair and<br />
equitable that development contributions fund those areas<br />
of development which are necessitated by growth, not driven<br />
by community desire. <strong>Council</strong> recognises that renewals or<br />
upgrades of existing facilities will also benefit new residents,<br />
but considers that the demand for these are from the existing<br />
population are therefore should be funded by existing units of<br />
demand. The target period for collection is set at initial 20 year<br />
planning period of the project (from 2004).<br />
Where the extension of Amberley’s existing walkway and<br />
cycleway network is into new development areas, each new<br />
unit of demand should contribute to the development of the<br />
network. Where the proposed infrastructure is an upgrade to<br />
existing areas it will be met by existing units of demand. The<br />
target period has been extended from its initial 20 year horizon<br />
to as a result of the lower level of growth anticipated.<br />
Residential & Business Activities:<br />
Each new subdivision lot established will be charged one<br />
development contribution for each item of community<br />
infrastructure as identified in the schedule. Additional business<br />
established on the same lot will be charged a separate<br />
development contribution.<br />
Assumptions<br />
That all people in the <strong>District</strong> create a demand for <strong>Community</strong><br />
Infrastructure irrespective of the type of lot created.<br />
That all people in the <strong>District</strong> have the same opportunity to use<br />
<strong>Community</strong> Infrastructure facilities.<br />
That <strong>Community</strong> Infrastructure use is related to people not<br />
type of property.<br />
That the <strong>District</strong> will continue to grow as set out in the<br />
population forecasting contained in this Policy.<br />
Circumstances for Refunds or Reductions<br />
In the event that planned <strong>Community</strong> Infrastructure upgrades<br />
are not undertaken within the “maximum period” set out in<br />
appendix 2, or alternative upgrades are not completed within<br />
that time-frame, development contributions will be refunded,<br />
after allowing for the costs of investigating the upgrade options<br />
and associated administrative costs.<br />
There will be no postponements of payments or remissions of<br />
payments.<br />
Multi Unit Residential Developments:<br />
The payment for multi unit residential housing including flats,<br />
town houses, retirement villages and apartments, will be applied<br />
on the basis that each separate residential unit shall be treated<br />
as a separate unit of demand and be charged accordingly.<br />
Travellers Accommodation Including Hotel/Motel<br />
Units and <strong>Long</strong> <strong>Term</strong> Workers Accommodation<br />
(Urban Areas)<br />
For each hotel, motel unit or separate unit of travellers<br />
or workers accommodation (excluding home stays<br />
accommodating less than 6 visitors) a payment of 50% of the<br />
standard community infrastructure development contributions<br />
identified in the schedule will be applied to each separate unit<br />
of accommodation let for tariff. For camping grounds, hostels,<br />
bunkhouses and backpackers accommodation or comparative<br />
travellers accommodation a contribution shall be determined<br />
on the basis of payment of 50 % of the standard community<br />
infrastructure development contribution for each 4 visitors<br />
the premises/camping ground can accommodate. Any manager’s<br />
accommodation associated with travellers’ or workers’<br />
accommodation shall be charged at the full rate.<br />
213
www.hurunui.govt.nz<br />
Appendix 1.<br />
Projected Number of New Units<br />
Development Contribution Year 1 Year 2 Year 3 Year 4 Year 5 Year 6 Year 7 Year 8 Year 9 Year 10<br />
Collection Area <strong>2012</strong>/2013 2013/2014 2014/2015 2015/2016 2016/2017 2017/2018 2018/2019 2019/2020 2020/2021 2021/<strong>2022</strong><br />
Amberley Sewer Area 9 9 9 9 9 9 9 9 9 11<br />
Amberley Township 7 7 7 7 7 7 7 7 7 8<br />
Amberley Ward 24 24 24 24 21 21 21 21 21 20<br />
Amberley Water 9 9 9 9 9 9 9 9 9 11<br />
Ashley Water 10 10 10 10 10 10 10 10 10 10<br />
Cheviot Water 2 2 2 2 2 2 2 2 2 2<br />
Glenmark Ward 4 4 4 4 2 2 2 2 2 2<br />
Hanmer Springs Sewer Area 9 9 9 9 14 14 14 14 14 9<br />
Hanmer Springs Township 15 15 15 15 23 23 23 23 23 15<br />
Hanmer Springs Urban Water<br />
Area 13 13 13 13 20 20 20 20 20 13<br />
Hanmer Springs Ward 30 30 30 30 38 38 38 38 38 29<br />
<strong>Hurunui</strong> Water 6 6 6 6 3 3 3 3 3 3<br />
<strong>Hurunui</strong> <strong>District</strong> 106 106 106 106 98 98 98 98 98 82<br />
214
<strong>Hurunui</strong> <strong>Community</strong> <strong>Long</strong> <strong>Term</strong> <strong>Plan</strong> <strong>2012</strong> - <strong>2022</strong><br />
Appendix 2.<br />
Inflation adjusted Capital Costs and Proporation Realting to Growth for Year 1-3 and 10 of this plan<br />
Project Funded From Total Capital Cost of<br />
Project (including nongrowth<br />
related<br />
components) in 2013<br />
dollars<br />
Est. Proportion of<br />
Growth attributable to<br />
Development (net<br />
result of estimates for<br />
each capital item in<br />
Est. Total Units of<br />
Demand by end of<br />
target period (to<br />
spread Development<br />
Cost if applicable)<br />
Est. (actual when<br />
available) Total<br />
Capital Cost due to<br />
growth, inflation<br />
adjusted to 2013<br />
Est. (actual when<br />
available) Total<br />
Capital Cost due to<br />
growth, inflation<br />
adjusted to 2014<br />
Est. (actual when<br />
available) Total<br />
Capital Cost due to<br />
growth, inflation<br />
adjusted to 2015<br />
Est. (actual when<br />
available) Total<br />
Capital Cost due to<br />
growth, inflation<br />
adjusted to <strong>2022</strong><br />
Amberley Domain Pavilion Amberley Ward $257,699 Spread based on a 1,912 $40,459 $42,045 $43,444 $57,345<br />
ratio of new units<br />
of demand / total<br />
units of demand<br />
Amberley Sewer Pipe Upgrades<br />
Amberley<br />
$678,000 100% 1,199 $678,000 $704,578 $728,029 $960,978<br />
Township<br />
Amberley Sewer Pond Upgrade<br />
Amberley<br />
$670,823 80% 1,581 $536,658 $557,696 $576,258 $760,644<br />
Sewer Area<br />
Amberley Stormwater<br />
Amberley<br />
$488,215 68% 1,107 $332,929 $345,980 $357,496 $471,884<br />
Township<br />
Amberley Township Reserves<br />
Amberley<br />
$813,000 90% 1,257 $731,700 $760,383 $785,692 $1,037,091<br />
Township<br />
Amberley Walking & Cycling Routes Amberley<br />
$274,000 80% 1,199 $219,200 $227,793 $235,375 $310,688<br />
Township<br />
Amberley Ward Reserves Amberley Ward $1,450,000 90% 2,890 $1,305,000 $1,356,157 $1,401,295 $1,849,669<br />
Amberley Water<br />
Amberley<br />
$609,869 63% 1,088 $383,869 $398,917 $412,194 $544,084<br />
Water<br />
Ashley Water Ashley Water $4,176,700 87% 2,763 $3,626,700 $3,768,869 $3,894,312 $5,140,381<br />
Cheviot Water Cheviot Water $493,869 66% 1,174 $327,807 $340,657 $351,995 $464,624<br />
Connical Hill Reserve Walkway<br />
Hanmer Springs $100,000 90% 1,822 $90,000 $93,528 $96,641 $127,563<br />
Development<br />
Ward<br />
Hanmer Springs Hall<br />
Hanmer Springs $507,340 Spread based on a 1,687 $127,201 $132,188 $136,587 $180,291<br />
Ward<br />
ratio of new units<br />
of demand / total<br />
units of demand<br />
Hanmer Springs Medical<br />
Hanmer Springs $798,208 Spread based on a 1,687 $200,128 $207,973 $214,896 $283,656<br />
Ward<br />
ratio of new units<br />
of demand / total<br />
units of demand<br />
Hanmer Springs Sewer<br />
Hanmer Springs<br />
Sewer Area<br />
$1,141,272 60% 1,593 $681,543 $708,260 $731,833 $965,999<br />
Hanmer Springs Stormwater<br />
Hanmer Springs<br />
Township<br />
$616,423 80% 1,764 $493,138 $512,469 $529,526 $698,960<br />
Hanmer Springs Town Centre<br />
Hanmer Springs $2,276,479 60% 2,446 $1,365,887 $1,419,431 $1,466,675 $1,935,969<br />
Development<br />
Ward<br />
Hanmer Springs Domain<br />
Hanmer Springs $1,000,000 50% 2,277 $500,000 $519,600 $536,895 $708,686<br />
Ward<br />
Hanmer Springs Water<br />
Hanmer Springs $581,849 60% 1,583 $349,109 $362,795 $374,870 $494,818<br />
Urban Water<br />
Area<br />
<strong>Hurunui</strong> <strong>District</strong> Library <strong>Hurunui</strong> <strong>District</strong> $2,135,217 Spread based on a 6,043 $412,685 $428,863 $443,137 $584,928<br />
ratio of new units<br />
of demand / total<br />
units of demand<br />
<strong>Hurunui</strong> Water <strong>Hurunui</strong> Water $424,861 75% 1,721 $318,646 $331,137 $342,159 $451,640<br />
Omihi Reserve Glenmark Ward $36,941 100% 458 $36,941 $38,389 $39,667 $52,359<br />
Queen Mary Development <strong>Hurunui</strong> <strong>District</strong> $4,479,382 Spread based on a<br />
ratio of new units<br />
of demand / total<br />
units of demand<br />
6,993 $1,356,791 $1,409,978 $1,456,908 $1,923,076<br />
215
www.hurunui.govt.nz<br />
Appendix 3.<br />
Development Contribution Schedule for Years 1-3 and 10 of this plan<br />
Project Funded From Relevant Subsection of Policy (Category of<br />
Contribution)<br />
Point at which Contribution is<br />
collected (number refers to<br />
options in NOTES below)<br />
Start Year for<br />
Contributions<br />
Maximum No. of years from<br />
start year until project is<br />
undertaken*<br />
Target period (years from<br />
start year) over which to<br />
collect contributions<br />
Est. Num of New Units to<br />
Collect From in target<br />
period based on growth<br />
model<br />
New Development<br />
Contribution (GST<br />
added) <strong>2012</strong>/2013<br />
New Development<br />
Contribution (GST<br />
added) 2013/2014<br />
New Development<br />
Contribution (GST<br />
added) 2014/2015<br />
New Development<br />
Contribution (GST<br />
added) 2021/<strong>2022</strong><br />
Amberley Domain Pavilion Amberley Ward Reserves 1 2004 10 10 300 $150 $160 $170 $220<br />
Amberley Sewer Pipe Upgrades Amberley Township Network Infrastructure 2 2008 10 76 497 $1,570 $1,630 $1,690 $2,230<br />
Amberley Sewer Pond Upgrade Amberley Sewer Area Network Infrastructure 2 2004 10 48 482 $1,280 $1,330 $1,370 $1,810<br />
Amberley Stormwater Amberley Township Network Infrastructure 3 2004 10 66 476 $800 $840 $860 $1,140<br />
Amberley Township Reserves Amberley Township Reserves 1 2008 25 85 555 $1,520 $1,570 $1,630 $2,150<br />
Amberley Walking & Cycling Routes Amberley Township <strong>Community</strong> Infrastructure 4 2008 20 76 497 $500 $520 $530 $700<br />
Amberley Ward Reserves Amberley Ward Reserves 1 2008 25 63 1,109 $1,350 $1,410 $1,450 $1,920<br />
Amberley Water Amberley Water Network Infrastructure 2 2004 15 37 390 $1,130 $1,180 $1,210 $1,600<br />
Ashley Water Ashley Water Network Infrastructure 5 2006 15 27 703 $5,930 $6,170 $6,370 $8,410<br />
Cheviot Water Cheviot Water Network Infrastructure 5 2006 10 60 157 $2,410 $2,500 $2,590 $3,410<br />
Connical Hill Reserve Walkway<br />
Hanmer Springs Ward Reserves 1 2008 10 10 410 $250 $260 $270 $360<br />
Hanmer Development Springs Hall Hanmer Springs Ward <strong>Community</strong> Infrastructure 4 2004 10 10 423 $350 $360 $370 $490<br />
Hanmer Springs Medical Hanmer Springs Ward <strong>Community</strong> Infrastructure 4 2004 10 10 423 $540 $570 $580 $770<br />
Hanmer Springs Sewer Hanmer Springs Sewer Area Network Infrastructure 2 2004 10 22 326 $2,410 $2,500 $2,580 $3,410<br />
Hanmer Springs Stormwater Hanmer Springs Township Network Infrastructure 3 2004 20 26 600 $940 $980 $1,010 $1,340<br />
Hanmer Springs Town Centre<br />
Hanmer Springs Ward <strong>Community</strong> Infrastructure 4 2004 10 35 1,182 $1,330 $1,380 $1,430 $1,880<br />
Hanmer Development Springs Domain Hanmer Springs Ward Reserves 1 2013 10 20 620 $930 $960 $1,000 $1,310<br />
Hanmer Springs Water Hanmer Springs Urban Water Area Network Infrastructure 2 2004 10 18 390 $1,030 $1,070 $1,110 $1,460<br />
<strong>Hurunui</strong> <strong>District</strong> Library <strong>Hurunui</strong> <strong>District</strong> <strong>Community</strong> Infrastructure 4 2004 10 10 1,168 $410 $420 $440 $580<br />
<strong>Hurunui</strong> Water <strong>Hurunui</strong> Water Network Infrastructure 5 2006 10 21 105 $3,500 $3,640 $3,760 $4,960<br />
Omihi Reserve Glenmark Ward Reserves 1 2004 10 11 85 $500 $510 $530 $700<br />
Queen Mary Development <strong>Hurunui</strong> <strong>District</strong> Reserves 1 2004 20 20 2,118 $740 $770 $790 $1,040<br />
NOTES: Points at which Contributions are payable and maximum contribution for reserves** Totals:<br />
1. At the time of granting a subdivision consent, or if a separate certificate of title exists against Hanmer Springs Township $8,930 $9,270 $9,580 $12,640<br />
which no development levy has been paid, at the time of issuing a building consent. Hanmer Springs Ward (excl. Town) $4,550 $4,720 $4,880 $6,430<br />
2. At time of granting subdivision consent or if no development levy has been paid, Amberley Township $9,450 $9,830 $10,140 $13,390<br />
at the time of issuing a building consent or resource consent or at time of connection to service. Leithfield Township & Amberley Beach Township $9,860 $10,260 $10,590 $13,980<br />
3. When subdivision consent is granted and or where subsequently an additional dwelling house or business premise Leithfield Beach Township $3,930 $4,090 $4,220 $5,570<br />
is promoted on the same lot at the time when either a resource consent or a building consent is granted. Amberley Ward (excl. Townships) $2,650 $2,760 $2,850 $3,760<br />
4. Upon granting a subdivision consent or Building Consent or Resource Consent. All new subdivisions will be subject to the Glenmark Ward $1,650 $1,700 $1,760 $2,320<br />
community infrastructure contributions set out in this table. Where allotments already exist but have not been built on Cheviot Ward $3,560 $3,690 $3,820 $5,030<br />
the contribution will be collected on the granting of the building consent or resource consent. <strong>Hurunui</strong> <strong>Community</strong> (/Ward) $4,650 $4,830 $4,990 $6,580<br />
5. At time of application to the Rural Water Scheme. Amuri <strong>Community</strong> (/Ward) $1,150 $1,190 $1,230 $1,620<br />
** In the case of reserves contributions, the contribution payable will be capped at the greater of 7.5% of the value of the additional allotments created * In the case of land taken for reserve purposes, this figure will be negotiated with the land owner at the time the contribution is made.<br />
by a subdivision or the value equivalent of 20 square metres of land for each additional household unit created by the development.<br />
216
External Liability Management Policy<br />
Introduction<br />
Asset Management <strong>Plan</strong>s<br />
<strong>Hurunui</strong> <strong>Community</strong> <strong>Long</strong> <strong>Term</strong> <strong>Plan</strong> <strong>2012</strong> - <strong>2022</strong><br />
<strong>Council</strong> took on external debt for the first time in 2010. It is<br />
intended that the <strong>Council</strong> shall have a level of core debt for<br />
the period outlined in the <strong>Long</strong> <strong>Term</strong> <strong>Plan</strong>. <strong>Council</strong>’s liabilities<br />
comprise borrowings and various other liabilities.<br />
Debt Ratios and Limits<br />
Debt will be managed within the following macro limits.<br />
Ratio<br />
<strong>Hurunui</strong><br />
Net debt as a percentage of equity
www.hurunui.govt.nz<br />
Under the Debenture Trust Deed <strong>Council</strong>’s borrowing is<br />
secured by a floating charge over all <strong>Council</strong> rates levied under<br />
the Rating Act, excluding any rates collected by <strong>Council</strong> on<br />
behalf of any other local authority. In such circumstances, the<br />
security offered by <strong>Council</strong> ranks ‘Pari Passu’ for all stock issued<br />
by <strong>Council</strong> including any security stock issued.<br />
(e) Secure its borrowing from the LGFA and the performance<br />
of other obligations to the LGFA or its creditors with a<br />
charge over the <strong>Council</strong>’s rates and rates revenue.<br />
<strong>Council</strong> offers deemed rates as security for general borrowing<br />
programs. From time to time, with prior <strong>Council</strong> and Debenture<br />
Trustee approval, security may be offered by providing a charge<br />
over one or more of <strong>Council</strong>s assets.<br />
Physical assets will be charged only where:<br />
• There is a direct relationship between the debt and<br />
the purchase or construction of the asset, which it<br />
funds (e.g. an operating lease, or project finance).<br />
• <strong>Council</strong> considers a charge over physical assets to be<br />
appropriate.<br />
• Any pledging of physical assets must comply with the<br />
terms and conditions contained within the Debenture<br />
Deed.<br />
Debt Repayment<br />
The funds from all asset sales and operating surpluses will<br />
be applied to the reduction of debt and/or a reduction in<br />
borrowing requirements, unless the <strong>Council</strong> specifically directs<br />
that the funds will be put to another use.<br />
New Zealand Local Government Funding Agency Limited<br />
Investment<br />
Despite anything earlier in this Liability Management Policy, the<br />
<strong>Council</strong> may borrow from the New Zealand Local Government<br />
Funding Agency Limited (LGFA) and, in connection with that<br />
borrowing, may enter into the following related transactions to<br />
the extent it considers necessary or desirable:<br />
(a) Contribute a portion of its borrowing back to the LGFA<br />
as an equity contribution to the LGFA, for example<br />
Borrower Notes;<br />
(b) Provide guarantees of the indebtedness of other local<br />
authorities to the LGFA and of the indebtedness of the<br />
LGFA itself;<br />
(c) Commit to contributing additional equity (or subordinated<br />
debt) to the LGFA if required;<br />
(d) Subscribe for shares and uncalled capital in the LGFA; and<br />
218
Investment Policy<br />
General Policy<br />
Investments are maintained to meet specified business reasons.<br />
Such reasons can be:<br />
1. For strategic purposes consistent with <strong>Council</strong>’s <strong>Long</strong><br />
<strong>Term</strong> <strong>Plan</strong>;<br />
2. To reduce the current ratepayer burden;<br />
3. The retention of vested land;<br />
4. Holding short term investments for working capital<br />
requirements;<br />
5. Holding investments that are necessary to carry out<br />
<strong>Council</strong> operations consistent with Annual <strong>Plan</strong>s.<br />
<strong>Council</strong> recognises that as a responsible public authority all<br />
investments held, should be low risk. <strong>Council</strong> also recognises<br />
that low risk investments generally mean lower returns.<br />
In its financial investment activity, <strong>Council</strong>’s primary objective when<br />
investing is the protection of its investment capital and that a prudent<br />
approach to risk/return is always applied within the confines of this<br />
policy. Accordingly, only approved credit worthy counterparties are<br />
acceptable.<br />
Investment Mix<br />
<strong>Council</strong> maintains investments in the following assets from time<br />
to time:<br />
• Equity investments, including investments held in CCO/<br />
CCTO and other shareholdings.<br />
• Property investments incorporating land, buildings, a<br />
portfolio of ground leases and land held for development.<br />
• Forestry investments<br />
• Financial investments<br />
• Loan advances for staff and rural housing purposes<br />
• Other.<br />
Equity Investments<br />
<strong>Council</strong> maintains equity investments and other minor<br />
shareholdings.<br />
<strong>Hurunui</strong> <strong>Community</strong> <strong>Long</strong> <strong>Term</strong> <strong>Plan</strong> <strong>2012</strong> - <strong>2022</strong><br />
<strong>Council</strong>’s equity investments fulfill various strategic, economic<br />
development and financial objectives as outlined in the LTP.<br />
<strong>Council</strong> seeks to achieve an acceptable rate of return on all its<br />
equity investments consistent with the nature of the investment<br />
and their stated philosophy on investments.<br />
Dividends received from CCO’s and unlisted companies not<br />
controlled by <strong>Council</strong> are recognised when they are received<br />
in the consolidated revenue account.<br />
Any purchase or disposition of equity investments requires<br />
<strong>Council</strong> approval and any profit or loss arising from the<br />
sale of these investments is to be recognised in the Statement<br />
of Comprehensive Income.<br />
Any purchase or disposition of equity investments will be<br />
reported to the next meeting of <strong>Council</strong>.<br />
Unless otherwise directed by <strong>Council</strong>, the proceeds from the<br />
disposition of equity investments will be used firstly to repay<br />
any debt relating to the investment and then included in the<br />
relevant consolidated capital account.<br />
<strong>Council</strong> recognises that there are risks associated with holding<br />
equity investments and to minimise these risks <strong>Council</strong>, through<br />
the relevant sub-committee, monitors the performance of its<br />
equity investments on a twice yearly basis to ensure that the<br />
stated objectives are being achieved. <strong>Council</strong> seeks professional<br />
advice regarding its equity investments when it considers this<br />
appropriate.<br />
Property Investments<br />
<strong>Council</strong>’s overall objective is to only own property that is<br />
necessary to achieve its strategic objectives. As a general rule,<br />
<strong>Council</strong> will not maintain a property investment where it is<br />
not essential to the delivery of relevant services, and<br />
property is only retained where it relates to a primary output<br />
of <strong>Council</strong>. <strong>Council</strong> reviews property ownership through<br />
assessing the benefits of continued ownership in comparison<br />
to other arrangements which could deliver the same results.<br />
This assessment is based on the most financially viable method<br />
of achieving the delivery of <strong>Council</strong> services. <strong>Council</strong> generally<br />
follows similar assessment criteria in relation to new property<br />
investments.<br />
<strong>Council</strong> reviews the performance of its property investments<br />
on a regular basis.<br />
All income, including rentals and ground rent from property<br />
investments is included in the Statement of Comprehensive<br />
Income.<br />
219
www.hurunui.govt.nz<br />
Forestry Investments<br />
Forestry assets are held as long term investments on the basis<br />
of net positive discounted cash flows, factoring in projected<br />
market prices and annual maintenance and cutting costs.<br />
All income from forestry is included in the Statement of<br />
Comprehensive Income.<br />
Any disposition of these investments requires <strong>Council</strong> approval.<br />
The proceeds from forestry disposition are used firstly to<br />
repay related borrowings and then included in the relevant<br />
consolidated capital account.<br />
Financial Investments<br />
Liquid investment funds will be prudently invested as follows:<br />
• Any liquid investments must be restricted to a term<br />
that meets future cash flow and capital expenditure<br />
projections.<br />
• Interest income from financial investments is credited<br />
to general funds, except for income from investments<br />
for special funds, reserve funds and other funds where<br />
interest may be credited to the particular fund.<br />
• Internal borrowing will be used wherever possible to<br />
avoid external borrowing<br />
Financial Investment Objectives<br />
Trust Funds<br />
Where <strong>Council</strong> hold funds as a trustee, or manages funds for a<br />
Trust then such funds must be invested on the terms provided<br />
within the trust. If the Trusts investment policy is not specified<br />
then this policy should apply.<br />
New Zealand Local Government<br />
Funding Agency Limited Investment<br />
Despite anything earlier in this Investment Policy, the <strong>Council</strong><br />
may invest in shares and other financial instruments of the New<br />
Zealand Local Government Funding Agency Limited (LGFA), and<br />
may borrow to fund that investment. The <strong>Council</strong>’s objective in<br />
making any such investment will be to:<br />
(a) Obtain a return on the investment; and<br />
(b) Ensure that the LGFA has sufficient capital to become<br />
and remain viable, meaning that it continues as a source<br />
of debt funding for the <strong>Council</strong>.<br />
Because of these dual objectives, the <strong>Council</strong> may invest in<br />
LGFA shares in circumstances in which the return on that<br />
investment is potentially lower than the return it could achieve<br />
with alternative investments.<br />
If required in connection with the investment, the <strong>Council</strong> may<br />
also subscribe for uncalled capital in the LGFA.<br />
• <strong>Council</strong>’s primary objectives when investing is the<br />
protection of its investment capital. Accordingly,<br />
<strong>Council</strong> may only invest in approved creditworthy<br />
counterparties. Creditworthy counterparties and<br />
investment restrictions are covered in the Treasury Risk<br />
Management Policy. Credit ratings are monitored and<br />
reported quarterly to <strong>Council</strong>.<br />
• <strong>Council</strong> may invest in approved financial instruments<br />
as set out in the Treasury Risk Management Policy These<br />
investments are aligned with <strong>Council</strong>’s objective<br />
Special Funds and Reserve Funds<br />
Liquid assets are not required to be held against special funds<br />
and reserve funds. Instead <strong>Council</strong> will internally borrow or<br />
utilise these funds wherever possible.<br />
Unless otherwise directed by <strong>Council</strong>, internal borrowing to/<br />
(from) reserves will be undertaken at the external cost of<br />
borrowing.<br />
220
Rates Remission for Biodiversity Policy<br />
Introduction<br />
<strong>Hurunui</strong> <strong>Community</strong> <strong>Long</strong> <strong>Term</strong> <strong>Plan</strong> <strong>2012</strong> - <strong>2022</strong><br />
The purpose of this rates remission policy is to recognise<br />
voluntary protection of the <strong>District</strong>’s indigenous flora and fauna<br />
via conservation covenants and to promote and encourage<br />
more land owners to participate in this process. This policy<br />
also acknowledges the wider community benefit of protecting<br />
Significant Natural Areas (SNAs), which are on privately<br />
owned land, by sharing the cost by way of a rates remission<br />
commensurate with the level of protection offered.<br />
Conservation Covenants<br />
<strong>Council</strong> will grant 100% rates remission to those rating units or<br />
portions of rating units, which are protected by a conservation<br />
covenant that is registered on the Certificate of Title in perpetuity.<br />
This includes protection afforded by conservation covenants<br />
established under the Queen Elizabeth the Second Trust Act,<br />
Reserves Act, Conservation Act, Resource Management Act<br />
1991 (as a condition of resource consent), and the Wildlife Act.<br />
Rates remission will be granted on receipt of a Certificate of<br />
Title registering the protective covenant and a deposited plan<br />
that shows the affected land area.<br />
Significant Natural Areas<br />
<strong>Council</strong> will grant up to 90% rates remission to those rating<br />
units or portions of rating units, which are scheduled as a<br />
Significant Natural Area in the <strong>District</strong> <strong>Plan</strong>. The percentage<br />
remission granted will depend on the extent to which the area<br />
is actively managed to protect and enhance biodiversity values.<br />
221
www.hurunui.govt.nz<br />
Rates Remissions on Land Affected by Natural Calamity Policy<br />
Introduction<br />
The purpose of the policy is to give the <strong>Council</strong> discretion to<br />
remit rates where a rating unit has been detrimentally affected<br />
by a natural calamity.<br />
Policy<br />
The <strong>Council</strong> may remit rates either wholly or in part where<br />
land has been detrimentally affected by erosion, subsidence,<br />
submersion or other natural calamity to an extent the <strong>Council</strong><br />
considers that it would be unfair or unreasonable to require<br />
that the rates be paid as assessed.<br />
Applications must be made in writing and signed by the owner(s)<br />
of the rating unit.<br />
Full details must be provided of the nature of the event that<br />
caused the damage and the degree of damage to the land. If the<br />
damage is temporary and the land is expected to return to its<br />
former use in the future, an estimate of the time it will take the<br />
land to recover to a useable state and the steps that the owner<br />
will take to achieve this should be provided. The <strong>Council</strong> may<br />
ask for a report from a Registered Engineer or other similarly<br />
qualified expert.<br />
The amount of remission given in any case will be set by the<br />
<strong>Council</strong> having regard to the severity of the event, the degree<br />
of damage to the subject land and other land in the district and<br />
other financial assistance available. Consideration will also be<br />
given to the effect of remissions on the remaining rating base.<br />
222
Reserves Funding Policy<br />
Introduction<br />
All reserves in the <strong>District</strong> will be divided into two categories<br />
for funding purposes, which are identified by area of benefit<br />
rather than by the legal classification of reserve. This policy will<br />
provide a foundation for the creation of a prioritised long-term<br />
development programme for reserves and how they are funded.<br />
In determining the category status and the extent of benefit of<br />
any reserve, the <strong>Council</strong> will have regard to the degree to which<br />
one or more of the factors apply to a particular reserve:<br />
• Heritage value<br />
• Visitor numbers<br />
• Local use<br />
• Local amenity value<br />
• Social / Economic value<br />
• Location to visitor attractions<br />
• Location to State Highways<br />
• Location to tourist routes<br />
• Ecological value<br />
For example, the higher the degree of local use or contribution<br />
towards local amenity, the greater the weighting towards<br />
classification as an “Amenity Reserve”. The more visitor-oriented<br />
or the greater the heritage or ecological value, the greater the<br />
weighting towards classification as a “<strong>District</strong> Reserve”.<br />
Should these factors change over time, <strong>Council</strong> may review the<br />
funding category of any reserve if circumstances warrant this.<br />
<strong>District</strong> Reserves<br />
Funding: Capital expenditure and maintenance is funded 100%<br />
by the general rate or the Hanmer Springs Thermal Pools and<br />
Spa Reserve surpluses if available.<br />
Defined as: A reserve that serves and provides benefits<br />
principally to the district and wider community as a w h o l e<br />
rather than the local community. <strong>District</strong> Reserves are utilised<br />
by a wide range of user groups and visitors may travel some<br />
distance to access the reserve. <strong>District</strong> Reserves may also have<br />
distinctive features which make them unique, such as geothermal<br />
activity, or uncommon landforms and vegetation. They may<br />
also be valuable in terms of their historic buildings, proximity<br />
to watercourses and their amenity value. The accessibility to<br />
and public use of <strong>District</strong> Reserves will generally tend to be<br />
high, (with the exception of undeveloped esplanade reserves,<br />
ecological reserves, gravel pits and some historical reserves). All<br />
gravel, forestry, cemetery and esplanade reserves will be funded<br />
as “<strong>District</strong> Reserves”.<br />
Amenity Reserves<br />
<strong>Hurunui</strong> <strong>Community</strong> <strong>Long</strong> <strong>Term</strong> <strong>Plan</strong> <strong>2012</strong> - <strong>2022</strong><br />
Funding: Capital expenditure and maintenance are funded 100%<br />
by the local amenity rate or, at the discretion of the <strong>Council</strong>,<br />
fully or partially funded by Hanmer Springs Thermal Pools and<br />
Spa Reserve surpluses.<br />
Defined as: A reserve that provides benefits principally to the<br />
local community in which it is situated.<br />
Limitations<br />
In setting out the above formulas it is recognised that funding<br />
of reserve projects will still be subject to the normal budgeting<br />
processes. Individual wards/rating areas may utilise funds which<br />
are derived from the Hanmer Springs Thermal Pools and Spa<br />
Reserve surpluses and allocated to it by <strong>Council</strong> on an annual<br />
basis . There is also a need to ensure local support exists for<br />
meeting the costs of maintenance where these fall locally. The<br />
following limitations also apply:<br />
• In the case of all capital works, the first call for project<br />
funding on a <strong>District</strong> Reserve Amenity Reserve shall<br />
be against unallocated funding from a ward’s land<br />
subdivision account or unallocated surpluses held<br />
within all accounts of the reserve’s administering body.<br />
An exception to this applies in the case of the Cheviot<br />
Reserves Committee’s Joint Venture forestry surpluses,<br />
the interest from which it requires to fund the ongoing<br />
maintenance of the reserves under its control.<br />
• Prior to any capital expenditure being promoted on<br />
an Amenity Reserve, the ward committee or group<br />
managing the reserve on the <strong>Council</strong>’s behalf agree to<br />
the project, acknowledging that future maintenance<br />
costs will fall on the amenity account.<br />
The administering group of any category of reserve can<br />
promote projects and fund them locally outside the funding<br />
regime described above in the event that <strong>Council</strong> decides not<br />
to fund a particular project.<br />
Funding for reserve development may also be obtained from<br />
development contributions levied under the Local Government<br />
Act (2002) via the <strong>Hurunui</strong> <strong>Community</strong> <strong>Long</strong> <strong>Term</strong> <strong>Plan</strong> or<br />
financial contributions levied under the Resource Management<br />
Act (1991) via the <strong>District</strong> <strong>Plan</strong>.<br />
223
www.hurunui.govt.nz<br />
Revenue and Financing Policy<br />
Introduction<br />
This policy is about <strong>Council</strong> services and who pays for them, and<br />
is required under Section 102 (4) of the Local Government Act<br />
2002. Sections 103 and 101(3) of this act require the <strong>Council</strong> to<br />
identify for each <strong>Council</strong> service:<br />
Drainage Rate:<br />
Targeted Rate on a defined area benefiting from a classified<br />
drainage scheme.<br />
Lot:<br />
(i)<br />
(ii)<br />
(iii)<br />
(iv)<br />
the community outcomes to which the service<br />
primarily contributes;<br />
the distribution of benefits between the <strong>District</strong><br />
as a whole, any identifiable part of the <strong>District</strong>,<br />
and individuals;<br />
the period in or over which those benefits are<br />
expected to occur;<br />
the extent to which the actions or inaction of<br />
particular individuals or a group contribute to<br />
the need to undertake the service; and<br />
A rateable property (lots can be combined). A lot is a legal entity.<br />
Targeted Rate:<br />
Is a rate within a ward or other defined area and may be based<br />
on cents per dollar of capital value of every property or a fixed<br />
amount per rating unit (known for the purposes of this policy<br />
as a “Uniform Annual Charge”, UAC). Money is spent in that<br />
area only.<br />
UAC:<br />
(v)<br />
the costs and benefits, including consequences<br />
for transparency and accountability, of funding<br />
the service distinctly from other services.<br />
There is also a requirement to consider the overall impact of<br />
any allocation for revenue needs on the current and future<br />
social, economic, environmental, and cultural wellbeing of the<br />
community.<br />
Costs for each service are collected unless the <strong>Council</strong> believes<br />
that to do so would not be fair or not be in the interest of<br />
residents and ratepayers or is in conflict with <strong>Council</strong> policy. As<br />
an elected representative body, the <strong>Council</strong> has the responsibility<br />
to make the final decision.<br />
The following section of this policy is an explanation of the<br />
policy and terms used.<br />
Capital Value:<br />
The value expected to be realised at the time of valuation if<br />
offered for sale on such reasonable terms and conditions as a<br />
bona fide seller might be expected to require.<br />
Development Contributions:<br />
Charges on future lots or units of demand to fund the growth<br />
portion of capital expenditure.<br />
<strong>District</strong> Rate:<br />
Uniform Annual Charge. Within the context of this policy,<br />
this is a Targeted Rate for a set dollar amount collected for<br />
each rateable property (or each separately used or inhabited<br />
part of a property) in the <strong>District</strong> as a whole or within part<br />
of the <strong>District</strong> for a specific <strong>Council</strong> service (e.g. water supply,<br />
sewerage, reserves).<br />
UAGC:<br />
Uniform Annual General Charge. This is a set dollar amount<br />
which is collected for each rateable property or each separately<br />
used or inhabited part of a property in the <strong>District</strong>, irrespective<br />
of the value of the property, to cover the combined costs of<br />
various <strong>Council</strong> services.<br />
User Charges:<br />
Charges collected from individuals at the time service is used.<br />
Utilities:<br />
Combination of water, wastewater and refuse services.<br />
Service by Service Review<br />
The service by service reviews are detailed on the following<br />
pages.<br />
<strong>District</strong> wide collection of revenue based on a set number of<br />
cents per dollar of the Capital Value of every property, or a<br />
uniform annual general charge (UAGC).<br />
224
<strong>Hurunui</strong> <strong>Community</strong> <strong>Long</strong> <strong>Term</strong> <strong>Plan</strong> <strong>2012</strong> - <strong>2022</strong><br />
Service<br />
Relevant <strong>Community</strong><br />
Outcomes<br />
Relevant Issues &<br />
Constraints<br />
Who benefits,<br />
and over what<br />
period<br />
Future Funding & Sustainability<br />
Water Supply<br />
Treatment and<br />
Reticulation of Water<br />
to the following<br />
Water Supply areas:<br />
• Amberley<br />
• Leithfield Beach<br />
• Ashley Rural<br />
• Culverden<br />
• Waiau Town<br />
• Amuri Plains<br />
• Balmoral<br />
• Waiau Rural<br />
• Cheviot<br />
• Waipara<br />
• Hanmer Springs<br />
• Hawarden-Waikari<br />
• <strong>Hurunui</strong> Rural<br />
The <strong>Council</strong>’s funding of<br />
Water Supply services<br />
contributes to the<br />
<strong>Hurunui</strong> district being:<br />
A desirable and safe place<br />
to live:<br />
• We have attractive well<br />
designed townships<br />
• Communities have<br />
access to adequate<br />
health and emergency<br />
services and systems<br />
and resources are<br />
available to meet civil<br />
defence emergencies<br />
• Risks to public health<br />
are identified and<br />
appropriately managed<br />
A place with essential<br />
infrastructure:<br />
• We have a strong<br />
emphasis on service<br />
delivery across<br />
all infrastructure<br />
including roading,<br />
water (for drinking and<br />
development), waste<br />
water, stormwater and<br />
solid waste<br />
Restricted supply<br />
schemes are based on<br />
unmetered, restricted<br />
supply with a maximum<br />
supply per day<br />
irrespective of usage.<br />
Unrestricted schemes<br />
face a number of issues.<br />
There is a need to curb<br />
excess water use. In<br />
addition, bach owners<br />
who use their beaches<br />
infrequently, object to<br />
paying fees for a system<br />
that they say they<br />
hardly use. However,<br />
the system was built to<br />
handle the needs of all<br />
the residents and if they<br />
sold to a permanent<br />
resident that person<br />
would want a system<br />
that could meet their<br />
needs. The existence<br />
of water supply to a<br />
property is reflected<br />
in the value of that<br />
property.<br />
Accordingly, as all<br />
ratepayers own an<br />
equal share in the water<br />
supply system, all users<br />
should meet an equal<br />
component of the fixed<br />
costs of the water<br />
supply that was built to<br />
meet their needs. They<br />
should then pay the<br />
economic marginal cost<br />
of any additional usage.<br />
Costs will be reallocated<br />
across users<br />
and significant change is<br />
expected.<br />
100% private<br />
benefit to users.<br />
Operational Costs:<br />
• Restricted Supply<br />
• As a local Uniform Annual Charge on water unit<br />
entitlement.<br />
Unrestricted Supply:<br />
• Fixed costs – As a local Uniform Annual Charge.<br />
Variable Costs :<br />
• As a set price based per cubic meter of water as<br />
recorded by the individual water meters.<br />
Capital Costs:<br />
• Significant <strong>Council</strong> capital expenditure should be<br />
funded by loan for the life of the investment; if loans<br />
are not raised then it will be treated as a fixed cost<br />
and funded from annual rates. If any of the Capital<br />
Expenditure caters for future growth of the scheme,<br />
then that portion of the expenditure that relates<br />
to growth may be funded from future users via<br />
Development Contributions.<br />
• Landowners with new connections will pay the cost of<br />
connecting to the nearest main plus, if a new subdivide,<br />
putting in the sub-main and any levies as specified in<br />
the Development Contributions policy.<br />
• Property owners wanting new connections will pay<br />
those costs necessary for the connection.<br />
Loan Repayments:<br />
• Significant <strong>Council</strong> capital expenditure should be<br />
funded by loan for the life of the investment. Repayment<br />
of the loan will be treated as a fixed cost and will be<br />
funded from a local Uniform Annual Charge.<br />
Sustainability:<br />
• The ongoing negative effects on the economic<br />
wellbeing of those who pay for water supply services<br />
will be offset by future gains in social, economic and<br />
environmental well- being.<br />
Increased Drinking Water Standards:<br />
• The increased requirements to meet desired<br />
standards for drinking water place an exceptional (if<br />
not unaffordable) burden on small water schemes.<br />
To fund the increased costs associated with meeting<br />
standards and to avoid the exorbitant fines that will be<br />
imposed on small local authorities who cannot meet<br />
these requirements, the <strong>Council</strong> is considering funding<br />
all drinking water requirements form a General Rate,<br />
rather than placing that burden on a limited number<br />
of ratepayers.<br />
225
www.hurunui.govt.nz<br />
Service<br />
Relevant <strong>Community</strong><br />
Outcomes<br />
Relevant Issues &<br />
Constraints<br />
Who benefits, and over<br />
what period<br />
Future Funding & Sustainability<br />
Sewerage<br />
Provision of<br />
reticulation and<br />
treatment of<br />
sewage for the<br />
following Sewerage<br />
Areas:<br />
• Amberley<br />
• Cheviot<br />
• Greta Valley<br />
• Motunau Beach<br />
• Hanmer Springs<br />
• Hawarden<br />
• Waikari<br />
The <strong>Council</strong>’s funding<br />
of Sewerage services<br />
contributes to the <strong>Hurunui</strong><br />
district being:<br />
A desirable and safe place<br />
to live:<br />
• We have attractive well<br />
designed townships<br />
• Communities have<br />
access to adequate<br />
health and emergency<br />
services and systems and<br />
resources are available<br />
to meet civil defence<br />
emergencies<br />
• Risks to public health<br />
are identified and<br />
appropriately managed<br />
A place that demonstrates<br />
e n v i r o n m e n t a l<br />
responsibility:<br />
• We protect our<br />
environment while<br />
preserving people’s<br />
property rights<br />
• We minimise solid waste<br />
to the fullest extent, and<br />
manage the rest in a<br />
sustainable way<br />
A place with essential<br />
infrastructure:<br />
• We have a strong<br />
emphasis on service<br />
delivery across<br />
all infrastructure<br />
including roading,<br />
water (for drinking and<br />
development), waste<br />
water, stormwater and<br />
solid waste<br />
This is a significant service<br />
in terms of expenditure,<br />
so there are benefits<br />
for accountability and<br />
transparency from funding<br />
it separately from other<br />
services. Funding this<br />
service separately adds no<br />
significant extra cost.<br />
The various resource<br />
consents the <strong>Council</strong><br />
holds under the Resource<br />
Management Act 1991<br />
govern the way in which the<br />
<strong>Council</strong> manages disposal<br />
whether it is the <strong>Council</strong>’s<br />
own or ratepayer’s disposal.<br />
Significant capital<br />
investments made by the<br />
existing ratepayers can be<br />
used by new connections,<br />
which may be considered<br />
unfair.<br />
100% benefit to users of the<br />
system.<br />
Benefits from capital<br />
expenditure accrue over the<br />
life of the investment and<br />
benefits from operational<br />
expenditure accrue at the time<br />
of the expenditure. Capital<br />
Expenditure should be funded<br />
by a loan, pursuant to the<br />
<strong>Council</strong>’s Internal Financing<br />
Policy. New connections will<br />
pay all costs of connecting to<br />
nearest sewer main. If any of<br />
the capital expenditure caters<br />
for future growth, then that<br />
portion of the expenditure<br />
that relates to growth may<br />
be funded from future lots<br />
or units of demand within<br />
the ward or community<br />
rating area via development<br />
contributions.<br />
Operations & Loan Repayments:<br />
• Operation and loan repayments should be<br />
funded by way of a wastewater Uniform<br />
Annual Charge on each connection and for<br />
connected commercial properties a charge<br />
of 1 for the first pan, ½ charges on the<br />
second pan and ¼ charges on the third and<br />
subsequent pans. Serviceable properties<br />
within the urban sewerage scheme will be<br />
charged ½ the Uniform Annual Charge.<br />
• <strong>Council</strong> may allow capital contributions to<br />
be made at its discretion in place of a loan<br />
Uniform Annual Charge.<br />
Capital Costs:<br />
• Significant <strong>Council</strong> capital expenditure<br />
should be funded by loan pursuant to the<br />
<strong>Council</strong>’s Internal Financing Policy, if loans<br />
are not raised then it will be from targeted<br />
rates.<br />
• The <strong>Council</strong> may loan fund sewerage main<br />
extensions with the loan repayments met<br />
by those properties directly benefiting<br />
where the majority of the property owners<br />
agree to the extension.<br />
• If any of the Capital Expenditure caters<br />
for future growth of the scheme, then that<br />
portion of the expenditure that relates<br />
to growth may be funded from future<br />
users via Development Contributions and<br />
Financial Contributions, as detailed in the<br />
Development Contributions Policy and the<br />
<strong>District</strong> <strong>Plan</strong>.<br />
• Landowners with new connections will pay<br />
the cost of connecting to the nearest main<br />
plus, if a new subdivide, putting in the submain.<br />
• Property owners wanting new connections<br />
will pay those costs necessary for the<br />
connection and any levies as specified in<br />
the Development Contributions policy. The<br />
<strong>Council</strong> should pay any costs of scheme<br />
requirements that are over and above<br />
those necessary for the connection and the<br />
direct costs<br />
Sustainability:<br />
• The ongoing negative effects on the<br />
economic wellbeing of those who pay for<br />
sewerage services will be offset by future<br />
gains in social and environmental wellbeing.<br />
226
<strong>Hurunui</strong> <strong>Community</strong> <strong>Long</strong> <strong>Term</strong> <strong>Plan</strong> <strong>2012</strong> - <strong>2022</strong><br />
Service<br />
Relevant<br />
<strong>Community</strong><br />
Outcomes<br />
Relevant Issues &<br />
Constraints<br />
Who benefits, and<br />
over what period<br />
Future Funding & Sustainability<br />
Stormwater &<br />
Drainage<br />
Costs relating to<br />
construction and<br />
maintenance of<br />
stormwater and<br />
drainage systems<br />
in the following<br />
area:<br />
• Amberley<br />
Ward<br />
• Jed River,<br />
Cheviot<br />
• Hanmer<br />
Springs<br />
Township<br />
The <strong>Council</strong>’s funding<br />
of Stormwater and<br />
Drainage services<br />
contributes to the<br />
<strong>Hurunui</strong> district being:<br />
A desirable and safe<br />
place to live:<br />
- We have attractive<br />
well designed<br />
townships<br />
- Communities<br />
have access to<br />
adequate health and<br />
emergency services<br />
and systems and<br />
resources are<br />
available to meet<br />
civil defence<br />
emergencies<br />
- Risks to public<br />
health are identified<br />
and appropriately<br />
managed<br />
A place with essential<br />
infrastructure:<br />
- We have a strong<br />
emphasis on service<br />
delivery across<br />
all infrastructure<br />
including roading,<br />
water (for drinking<br />
and development),<br />
waste water,<br />
stormwater and<br />
solid waste<br />
Those who use the<br />
service benefit more<br />
than those who do<br />
not, hence, for reasons<br />
of transparency and<br />
account- ability, there<br />
is justification for<br />
funding it distinctly<br />
from other services.<br />
There are no significant<br />
costs involved in this<br />
distinction.<br />
100% benefit to the<br />
properties, and this based<br />
on the area drained.<br />
Benefits from capital<br />
expenditure accrue over<br />
the life of the investment.<br />
If any of the Capital<br />
Expenditure caters for<br />
future growth of the<br />
scheme, then that portion<br />
of the expenditure that<br />
relates to growth may<br />
be funded from future<br />
users via Development<br />
Contributions. Benefits<br />
from operational<br />
expenditure accrue at the<br />
time of the expenditure;<br />
benefits are proportional<br />
to the area drained.<br />
Operational Costs:<br />
- 100% Targeted Rate based on the area benefiting.<br />
- Engineer for stormwater catchment and<br />
management plans funded through the General<br />
Rate.<br />
Capital Costs:<br />
- Significant <strong>Council</strong> capital expenditure is funded by<br />
a loan as per the <strong>Council</strong>’s Internal Financing Policy.<br />
- If loans are not raised, then it will be from targeted<br />
rates.<br />
- If any of the Capital Expenditure caters for future<br />
growth of the scheme, then that portion of the<br />
expenditure that relates to growth may be funded<br />
from future users via Development Contributions<br />
and Financial Contributions.<br />
Sustainability:<br />
- The ongoing negative effects on the economic<br />
wellbeing of those who pay for stormwater<br />
services will be offset by future gains in economic<br />
and environmental wellbeing.<br />
227
www.hurunui.govt.nz<br />
Service<br />
Relevant<br />
<strong>Community</strong><br />
Outcomes<br />
Relevant Issues &<br />
Constraints<br />
Who benefits, and over<br />
what period<br />
Future Funding & Sustainability<br />
Roads and<br />
Footpaths<br />
The <strong>Council</strong>’s funding<br />
of Roading services<br />
contributes to the<br />
<strong>Hurunui</strong> district being:<br />
A place with essential<br />
infrastructure:<br />
- We have a strong<br />
emphasis on service<br />
delivery across<br />
all infrastructure<br />
including roading,<br />
water (for drinking<br />
and development),<br />
waste water,<br />
stormwater and solid<br />
waste<br />
This is a significant service in<br />
terms of expenditure, so there<br />
are benefits for accountability<br />
and transparency from funding it<br />
separately from other services.<br />
Funding this service separately<br />
adds no significant extra cost.<br />
We have an issue relating to<br />
maintaining our roading network<br />
at the levels of service shown<br />
through our Asset Management<br />
<strong>Plan</strong>s due to NZTA reducing<br />
funding. Whereas we expect to<br />
manage for the next three years,<br />
the problem will start to appear<br />
from 2015 when our income<br />
will not match our maintenance<br />
programme. We have built<br />
inflation into the NZTA subsidy<br />
but unsure at this stage whether<br />
that will actually be the case.<br />
Is it fair that ratepayers on state<br />
highways should pay for local<br />
roads?<br />
Yes, because they have access<br />
and the option of using all<br />
the roads in the district and<br />
throughout NZ.<br />
Is it fair that one ratepayer on<br />
a road should have their road<br />
(which is essentially a drive)<br />
maintained?<br />
Yes, because it is a network<br />
and we all get the potential<br />
to use any part of the roading<br />
network. A road may well lead<br />
to a recreational resource. Such<br />
roads provide public access as<br />
well providing benefit to trades<br />
people requiring access to farms<br />
for their business.<br />
100% benefit to road users,<br />
but all people in the <strong>District</strong><br />
will use the roads at some<br />
stage, and it is generally not<br />
practical to distinguish between<br />
different levels of use. Optional<br />
enhancements to road surfaces<br />
will require contributions from<br />
affected property owners<br />
(see the Road Seal Extensions<br />
Policy), with the balance being<br />
met by the <strong>Council</strong>. There will<br />
be some component of benefit<br />
to visitors to the <strong>District</strong>, and<br />
in recognition of this, subsidies<br />
from the New Zealand Land<br />
Transport Agency will be<br />
employed where possible.<br />
Benefits from roading may<br />
generally be tagged to the area<br />
of property owned, and hence<br />
to Capital Value.<br />
Benefits from capital<br />
expenditure occur for the<br />
lifetime of the road (15 to 30<br />
years). However the roads are<br />
maintained in perpetuity so<br />
the roading should be funded<br />
by loan for its life without<br />
maintenance. Benefits from<br />
operational expenditure accrue<br />
at the time the expenditure was<br />
made.<br />
Operational Costs:<br />
• For the <strong>Council</strong> contribution, 100%<br />
<strong>District</strong> Rate for operations, roads<br />
and bridges to be known as the<br />
Roading Rate.<br />
Caital Costs:<br />
• Capital improvements above<br />
$100,000 may be funded by reserves<br />
or loans pursuant to the <strong>Council</strong>’s<br />
Internal Financing Policy. Other<br />
Capital Expenditure to be funded as<br />
operational.<br />
• If a community wishes the <strong>Council</strong><br />
to carry out resealing work that<br />
does not qualify for a NZTA Subsidy,<br />
then there is a mechanism through<br />
the Road Seal Extension policy<br />
which allows for the ratepayers<br />
to meet 50% of the costs and the<br />
<strong>Council</strong> contributing the remaining<br />
50% from the General rate.<br />
• If any of the Capital Expenditure<br />
caters for future growth, then that<br />
portion of the expenditure that<br />
relates to growth may be funded<br />
from future users via Financial<br />
Contributions.<br />
Footpaths<br />
• Operational and Capital Costs:<br />
• Township maintenance100% local<br />
amenity rate on ward or community<br />
rating area.<br />
Sustainability:<br />
• The ongoing maintenance and<br />
building of new roads will continue<br />
to be demanding financially,<br />
to individual ratepayers and<br />
government subsidies. However, the<br />
negative effects on the economic<br />
wellbeing of those who pay for<br />
roads will be offset by future gains in<br />
social and economic wellbeing.<br />
228
<strong>Hurunui</strong> <strong>Community</strong> <strong>Long</strong> <strong>Term</strong> <strong>Plan</strong> <strong>2012</strong> - <strong>2022</strong><br />
Service<br />
Relevant <strong>Community</strong><br />
Outcomes<br />
Relevant Issues &<br />
Constraints<br />
Who benefits, and over<br />
what period<br />
Future Funding & Sustainability<br />
<strong>Community</strong><br />
Services and<br />
Facilities - Local<br />
Halls<br />
The <strong>Council</strong>’s funding of<br />
Local Halls contributes to<br />
the <strong>Hurunui</strong> district being:<br />
A desirable and safe place<br />
to live:<br />
• We have attractive well<br />
designed townships<br />
• Communities have access<br />
to adequate health and<br />
emergency services and<br />
systems and resources<br />
are available to meet civil<br />
defence emergencies<br />
• Risks to public health<br />
are identified and<br />
appropriately managed<br />
A place where our<br />
traditional rural values and<br />
heritage make <strong>Hurunui</strong><br />
unique:<br />
• People have a range<br />
of opportunities to<br />
participate in leisure and<br />
culture activities<br />
• Our historic and cultural<br />
heritage is protected for<br />
future generations<br />
Those living closest to a<br />
facility benefit more than<br />
those living further away,<br />
hence there is a need to<br />
fund this service distinctly<br />
from other services.<br />
There are no significant<br />
costs associated with this<br />
distinction, and there are<br />
benefits for transparency<br />
and accountability, as the<br />
<strong>Council</strong>’s revenue from and<br />
expenditure on halls can<br />
more easily be related to<br />
the state of the <strong>District</strong>’s<br />
halls.<br />
The predominant benefit is to<br />
users of the hall, but there are<br />
indirect benefits to the local<br />
community in which the hall<br />
is situated, as the hall may<br />
attract visitors and events to<br />
the area.<br />
Operational Costs:<br />
• A rental charge the local market will stand,<br />
with any shortfall met from a local amenity<br />
rate on the local ward or community rating<br />
area. ta<br />
Capital Costs:<br />
• If any of the capital expenditure caters for<br />
future growth, then that portion of the<br />
expenditure that relates to growth may be<br />
funded from future lots or units of demand<br />
within the ward or community rating area<br />
via development contributions. If long term<br />
funding is required, it can be catered for<br />
under the <strong>Council</strong>’s Internal Financing Policy.<br />
The monies needed to meet the loan costs<br />
under the Internal Financing Policy should be<br />
treated as operational expenditureinabili<br />
Sustainability:<br />
• Local facilities such as halls in small<br />
communities are viewed as important to the<br />
social wellbeing of those communities and<br />
people are generally content to pay. These<br />
are very much local assets and decisions<br />
about future funding are guided by those who<br />
are prepared to pay (or not pay).<br />
229
www.hurunui.govt.nz<br />
Service<br />
Relevant <strong>Community</strong><br />
Outcomes<br />
Relevant Issues &<br />
Constraints<br />
Who benefits, and over<br />
what period<br />
Future Funding & Sustainability<br />
<strong>Community</strong><br />
Services and<br />
Facilities - Reserves<br />
The <strong>Council</strong>’s funding of<br />
Services and Facilities -<br />
Reserves contributes to the<br />
<strong>Hurunui</strong> district being:<br />
A desirable and safe place<br />
to live:<br />
• We have attractive well<br />
designed townships<br />
• Communities have access<br />
to adequate health and<br />
emergency services and<br />
systems and resources<br />
are available to meet civil<br />
defence emergencies<br />
• Risks to public health<br />
are identified and<br />
appropriately managed<br />
A place where our<br />
traditional rural values<br />
and heritage make<br />
<strong>Hurunui</strong> unique:<br />
- People have a range<br />
of opportunities to<br />
participate in leisure and<br />
culture activities<br />
- Our historic and cultural<br />
heritage is protected for<br />
future generations<br />
<strong>Council</strong> reserves are funded<br />
differently depending upon<br />
whether they are classified as<br />
<strong>District</strong> or Amenity (i.e. local)<br />
reserves. <strong>Council</strong> policy is<br />
that camping grounds should<br />
pay their own way. There<br />
are small administrative<br />
costs associated with the<br />
separate funding of reserves<br />
(e.g. costs for running<br />
Reserves Committees in<br />
each area), but these are<br />
outweighed by the benefits<br />
in increased transparency<br />
and accountability in regard<br />
to the allocation of funds for<br />
reserves and the statutory<br />
requirement that any revenue<br />
from reserves be spent only<br />
on reserves.<br />
<strong>District</strong> Reserves - 100%<br />
benefit to the <strong>District</strong> in<br />
that people from all over the<br />
<strong>District</strong> use the reserve, and<br />
the reserve attracts visitors<br />
to the <strong>District</strong>.<br />
Amenity Reserves - 100%<br />
benefit to residents in the<br />
local rating area.<br />
Hanmer Springs Thermal<br />
Pools & Spa - 100% benefit<br />
to users.<br />
Camping Grounds - 100%<br />
benefit to users.<br />
The benefits from capital<br />
expenditure accrue over the<br />
life of the investment and the<br />
benefits from operational<br />
expenditure accrue at the<br />
time of expenditure.<br />
Operational; Costs:<br />
• Amenity Reserves - 100% local amenity<br />
rates on the ward or community rating<br />
area in which the reserve is located.<br />
• <strong>District</strong> Reserves - 100% <strong>District</strong> Rate.<br />
• Hanmer Springs Thermal Pools - 100% user<br />
charge.<br />
• Camping Grounds - 100% user charge<br />
with any shortfall met by a local amenity<br />
rate in the ward or community rating<br />
area.ita<br />
Capital Costs:<br />
• <strong>District</strong> Reserves - Capital expenditure for<br />
<strong>District</strong> Reserves is funded 100% by the<br />
<strong>District</strong> Rate and/or the Hanmer Springs<br />
Thermal Reserve surpluses.<br />
• Amenity Reserves - Capital expenditure<br />
for Amenity Reserves is funded 100% by<br />
the local amenity rate on the ward or<br />
community rating area within which the<br />
reserve in question is located.<br />
• If any of the capital expenditure caters for<br />
future growth, then that portion of the<br />
expenditure that relates to growth may<br />
be funded from future lots or units of<br />
demand via development contributions.<br />
If long term funding is required, it can be<br />
catered for under the <strong>Council</strong>’s Internal<br />
Financing Policy. The monies needed to<br />
meet the loan costs under the Internal<br />
Financing Policy should be treated as<br />
operational expenditure.<br />
• Contestable Funding - <strong>Council</strong> may also<br />
provide an amount of funds from the<br />
surpluses from the Hanmer Springs<br />
Thermal Reserve to each Ward or<br />
Rating area that may be used for meeting<br />
development costs on amenity reserves.<br />
Sustainability:<br />
• There are slight negative effects on the<br />
current and future economic wellbeing<br />
of the communities affected, but this<br />
will be offset by proportional gains in<br />
current and future social, environmental<br />
and cultural wellbeing. There will also be<br />
some gain in economic wellbeing, to the<br />
extent that tourists are attracted to the<br />
<strong>District</strong>’s reserves.<br />
230
<strong>Hurunui</strong> <strong>Community</strong> <strong>Long</strong> <strong>Term</strong> <strong>Plan</strong> <strong>2012</strong> - <strong>2022</strong><br />
Service<br />
Relevant <strong>Community</strong><br />
Outcomes<br />
Relevant Issues &<br />
Constraints<br />
Who benefits, and over<br />
what period<br />
Future Funding & Sustainability<br />
<strong>Community</strong><br />
Services and<br />
Facilities –<br />
Township<br />
Maintenance<br />
The <strong>Council</strong>’s funding of Township<br />
Maintenance contributes to the<br />
<strong>Hurunui</strong> district being:<br />
A desirable and safe place to live:<br />
• We have attractive well<br />
designed townships<br />
• Communities have access<br />
to adequate health and<br />
emergency services and<br />
systems and resources are<br />
available to meet civil defence<br />
emergencies<br />
• Risks to public health are<br />
identified and appropriately<br />
managed<br />
A place where our traditional<br />
rural values and heritage make<br />
<strong>Hurunui</strong> unique:<br />
- People have a range of<br />
opportunities to participate in<br />
leisure and culture activities<br />
- Our historic and cultural<br />
heritage is protected for future<br />
generations<br />
Those living closest to a facility<br />
benefit more than those living<br />
further away, hence there is a<br />
benefit in terms of transparency<br />
and accountability from funding<br />
this service distinctly from other<br />
activities, and however, it is not<br />
practical in cost-benefit terms to<br />
implement a differential rating<br />
scheme for this service within<br />
each ward or community rating<br />
area. There is no significant<br />
cost associated with funding this<br />
service separately.<br />
There is an element of benefit<br />
to the wider <strong>District</strong> (e.g.<br />
street refuse bins improve the<br />
cleanliness and image of the<br />
<strong>District</strong> by minimizing littering),<br />
but the predominant benefit is<br />
to property owners in the ward<br />
or community rating area in<br />
question.<br />
The benefits from capital<br />
expenditure accrue over the<br />
life of the investment and the<br />
benefits from operational<br />
expenditure accrue at the time of<br />
expenditure.<br />
Operational and Capital Costs:<br />
• Township maintaneance100%<br />
local amenity rate on ward or<br />
community rating area.<br />
Sustainability:<br />
• Local communities are very<br />
involved in the decision<br />
making around what township<br />
maintenance is done and<br />
to what standard and are<br />
prepared to pay the cost. This<br />
is viewed as vital to the four<br />
wellbeings (social, economic,<br />
cultural and environmental) of<br />
our communities.<br />
231
www.hurunui.govt.nz<br />
Service<br />
Relevant <strong>Community</strong><br />
Outcomes<br />
Relevant Issues &<br />
Constraints<br />
Who benefits, and<br />
over what period<br />
Future Funding & Sustainability<br />
<strong>Community</strong> Services<br />
and Facilities - <strong>Hurunui</strong><br />
Youth and <strong>Community</strong><br />
Development<br />
Programmes<br />
The <strong>Council</strong>’s funding<br />
of community service<br />
programmes contributes to<br />
the <strong>Hurunui</strong> district being:<br />
A desirable and safe place<br />
to live:<br />
• We have attractive well<br />
designed townships<br />
• Communities have access<br />
to adequate health and<br />
emergency services and<br />
systems and resources<br />
are available to meet civil<br />
defence emergencies<br />
• Risks to public health<br />
are identified and<br />
appropriately managed<br />
A place where our<br />
traditional rural values and<br />
heritage make <strong>Hurunui</strong><br />
unique:<br />
• People have a range<br />
of opportunities to<br />
participate in leisure and<br />
culture activities<br />
• Our historic and cultural<br />
heritage is protected for<br />
future generations<br />
The programmes delivered<br />
by council are often<br />
dependent on external<br />
funding. If funded via <strong>Council</strong><br />
rates, their continuation<br />
is very dependent on<br />
the community actively<br />
supporting the programmes.<br />
<strong>Long</strong> term continuation can<br />
not be guaranteed.<br />
100% benefit to the<br />
people in the district<br />
through strengthening<br />
communities ability to<br />
find local solutions and<br />
strengthening the skills<br />
and development of youth.<br />
There are no capital<br />
costs, and benefits from<br />
operational costs accrue<br />
at the time of expenditure.<br />
Operating Costs:<br />
• Youth is funded via <strong>District</strong> rate or thermal<br />
reserve surplus.<br />
• <strong>Community</strong> development programme is<br />
100% funded via government grant.<br />
Sustainability:<br />
• Both programmes are not likely to be<br />
sustainable into the future as they are<br />
dependent on external funding which<br />
has finite dates, or funding via rates. The<br />
programmes are designed to suit today’s<br />
issues and not necessarily the right fit in<br />
future years. They are very dependent on<br />
public support and results being produced.<br />
232
<strong>Hurunui</strong> <strong>Community</strong> <strong>Long</strong> <strong>Term</strong> <strong>Plan</strong> <strong>2012</strong> - <strong>2022</strong><br />
Service<br />
Relevant <strong>Community</strong><br />
Outcomes<br />
Relevant Issues &<br />
Constraints<br />
Who benefits, and over what<br />
period<br />
Future Funding & Sustainability<br />
<strong>Community</strong><br />
Services and<br />
Facilities –<br />
Medical Centres<br />
The <strong>Council</strong>’s funding<br />
of Medical Centres<br />
contributes to the <strong>Hurunui</strong><br />
district being:<br />
A desirable and safe place<br />
to live:<br />
• We have attractive well<br />
designed townships<br />
• Communities have<br />
access to adequate<br />
health and emergency<br />
services and systems<br />
and resources are<br />
available to meet civil<br />
defence emergencies<br />
• Risks to public health<br />
are identified and<br />
appropriately managed<br />
A place where our<br />
traditional rural values and<br />
heritage make <strong>Hurunui</strong><br />
unique:<br />
• People have a range<br />
of opportunities to<br />
participate in leisure and<br />
culture activities<br />
• Our historic and cultural<br />
heritage is protected for<br />
future generations<br />
In remote rural locations,<br />
property developers /<br />
property owners do not<br />
wish to take the commercial<br />
risk to develop and lease<br />
out specialised medical<br />
facilities. Without these<br />
facilities, local residents<br />
and visitors would be some<br />
distance away from primary<br />
medical care. Users<br />
closest to a facility have<br />
the potential to benefit<br />
most from it, hence there<br />
are benefits in terms of<br />
increased transparency and<br />
accountability from funding<br />
these facilities separately<br />
from other <strong>Council</strong><br />
services, and however it is<br />
not practical to implement<br />
a differential rate within<br />
each ward or community<br />
rating area. Funding this<br />
service separately adds no<br />
extra cost.<br />
The predominant benefit is to users<br />
of the facilities, but there will also be<br />
a benefit to each local community in<br />
which facilities are situated, in that<br />
the general health of the community<br />
is likely to be improved and in that<br />
there will be less need to transport<br />
those who are in need of treatment<br />
to other areas of the <strong>District</strong>. In this<br />
sense there may also be some benefit<br />
to the <strong>District</strong> as a whole.<br />
The benefits from Capital Expenditure<br />
accrue over the life of the investment<br />
and so capital expenditure should be<br />
funded by a loan or from reserves. The<br />
benefits from operational expenditure<br />
accrue at the time of expenditure.<br />
Operational Costs:<br />
• 100% User charges with any shortfall<br />
funded by a medical centre rate within<br />
the relevant ward or community<br />
rating area.<br />
Capital Costs:<br />
• Any capital requirements will be<br />
catered for by loan funding pursuant<br />
to the <strong>Council</strong>’s Internal Financing<br />
Policy to be funded by a medical<br />
centre rate within the relevant ward<br />
or community rating area. If <strong>Council</strong><br />
decides that the <strong>District</strong> should<br />
contribute (in the past, there has been<br />
a $150,000 contribution made to each<br />
community) then the amount of the<br />
contribution is subtracted from the<br />
loan. If any of the Capital Expenditure<br />
caters for future growth, then that<br />
portion of the expenditure that relates<br />
to growth may be funded from future<br />
units of demand via Development<br />
Contributions and loans.<br />
Sustainability:<br />
• There are slight negative effects on<br />
the current and future economic<br />
wellbeing of the communities<br />
affected, but this will be offset by gains<br />
in current and future social wellbeing.<br />
There will also be some gain in<br />
economic wellbeing, to the extent<br />
that the need for out-of-district travel<br />
is lessened.<br />
233
www.hurunui.govt.nz<br />
Service<br />
Relevant <strong>Community</strong><br />
Outcomes<br />
Relevant Issues & Constraints<br />
Who benefits, and<br />
over what period<br />
Future Funding & Sustainability<br />
<strong>Community</strong> Services<br />
and Facilities –<br />
Pensioner Housing<br />
The <strong>Council</strong>’s funding of<br />
Pensioner Housing contributes<br />
to the <strong>Hurunui</strong><br />
district being:<br />
A desirable and safe place<br />
to live:<br />
• We have attractive well<br />
designed townships<br />
• Communities have<br />
access to adequate<br />
health and emergency<br />
services and systems<br />
and resources are<br />
available to meet civil<br />
defence emergencies<br />
• Risks to public health<br />
are identified and<br />
appropriately managed<br />
A place where our<br />
traditional rural values and<br />
heritage make <strong>Hurunui</strong><br />
unique:<br />
• People have a range<br />
of opportunities to<br />
participate in leisure<br />
and culture activities<br />
• Our historic and<br />
cultural heritage is<br />
protected for future<br />
generations<br />
Those living in an area with<br />
housing benefit more than<br />
those living outside of such<br />
an area, and those who qualify<br />
for housing benefit much<br />
more than those who do not,<br />
hence there is a benefit in<br />
terms of increased transparency<br />
and accountability from<br />
funding this service distinctly<br />
from other activities. There<br />
are no significant costs associated<br />
with this distinction.<br />
The predominant benefit<br />
is to those provided with<br />
housing, however the<br />
<strong>District</strong> as a whole also<br />
benefits from the knowledge<br />
that pensioners on low<br />
incomes are housed in<br />
reasonable accommodation<br />
and are housed locally -<br />
the need to travel out of<br />
the <strong>District</strong> to visit elderly<br />
friends and relations will be<br />
lessened.<br />
There are capital costs<br />
associated with the<br />
construction of the housing.<br />
The benefits accrue over<br />
the life of the buildings. This<br />
implies that the structures<br />
should be funded by way<br />
of a loan pursuant to the<br />
<strong>Council</strong>’s Internal Financing<br />
Policy. Operational costs<br />
are maintenance and<br />
benefits accrue at the time<br />
the expenditure takes place.<br />
Operational and Capital Costs:<br />
• Rents a r e set at an affordable level, ideally<br />
so as to recover 100% o f costs, with any<br />
shortfall to be made up from the <strong>District</strong><br />
Rate on Capital Value.<br />
Sustainability:<br />
• There will be a positive effect on the current<br />
and future economic wellbeing of the<br />
persons housed. Any slight negative effect on<br />
the current and future economic wellbeing of<br />
ratepayers in general will be offset by gains in<br />
social wellbeing.<br />
234
<strong>Hurunui</strong> <strong>Community</strong> <strong>Long</strong> <strong>Term</strong> <strong>Plan</strong> <strong>2012</strong> - <strong>2022</strong><br />
Service<br />
Relevant<br />
<strong>Community</strong><br />
Outcomes<br />
Relevant Issues &<br />
Constraints<br />
Who benefits, and over<br />
what period<br />
Future Funding & Sustainability<br />
<strong>Community</strong><br />
Services and<br />
Facilities –<br />
Residential Housing<br />
The <strong>Council</strong>’s funding<br />
of Residential Housing<br />
contributes to the<br />
<strong>Hurunui</strong> district being:<br />
A desirable and safe place<br />
to live:<br />
• We have attractive well<br />
designed townships<br />
• Communities have<br />
access to adequate<br />
health and emergency<br />
services and systems<br />
and resources are<br />
available to meet civil<br />
defence emergencies<br />
• Risks to public health<br />
are identified and<br />
appropriately managed<br />
A place where our<br />
traditional rural values<br />
and heritage make<br />
<strong>Hurunui</strong> unique:<br />
• People have a range<br />
of opportunities to<br />
participate in leisure<br />
and culture activities<br />
• Our historic and<br />
cultural heritage is<br />
protected for future<br />
generations<br />
Those living in areas with<br />
housing and/or who qualify for<br />
housing benefit most from<br />
it; hence there is justification<br />
in terms of transparency and<br />
accountability for funding<br />
this service distinctly from<br />
other activities. There are no<br />
significant costs associated with<br />
this distinction.<br />
The predominant benefit is to<br />
those provided with housing,<br />
but there is a component<br />
of benefit to the <strong>District</strong><br />
as a whole, as medical<br />
practitioners and <strong>Council</strong><br />
staff who might otherwise<br />
not live in the <strong>District</strong> are<br />
provided with housing.<br />
There are capital costs<br />
associated with the<br />
construction of the housing.<br />
The benefits accrue for the<br />
life of the buildings. This<br />
implies that the structures<br />
should be funded by way of a<br />
loan pursuant to the <strong>Council</strong>’s<br />
Internal Financing Policy.<br />
Operational costs are<br />
maintenance and benefits<br />
accrue at the time the<br />
expenditure takes place.<br />
Operational and Capital Costs:<br />
• Market rents for <strong>Council</strong> staff with any<br />
shortfall to be made up from the <strong>District</strong><br />
Rate on Capital Value.<br />
Sustainability:<br />
• There will be a positive effect on the<br />
current and future economic wellbeing of<br />
the persons housed. Any slight negative<br />
effect on the current and future economic<br />
wellbeing of ratepayers in general will be<br />
offset by gains in social wellbeing.<br />
235
www.hurunui.govt.nz<br />
Service<br />
Relevant <strong>Community</strong><br />
Outcomes<br />
Relevant Issues &<br />
Constraints<br />
Who benefits, and over<br />
what period<br />
Future Funding & Sustainability<br />
<strong>Community</strong><br />
Services and<br />
Facilities –<br />
Cemeteries<br />
The <strong>Council</strong>’s funding of<br />
Cemeteries contributes to<br />
the <strong>Hurunui</strong> district being:<br />
A desirable and safe place<br />
to live:<br />
• We have attractive well<br />
designed townships<br />
• Communities have access<br />
to adequate health and<br />
emergency services and<br />
systems and resources<br />
are available to meet civil<br />
defence emergencies<br />
• Risks to public health<br />
are identified and<br />
appropriately managed<br />
A place where our<br />
traditional rural values and<br />
heritage make <strong>Hurunui</strong><br />
unique:<br />
• People have a range<br />
of opportunities to<br />
participate in leisure and<br />
culture activities<br />
• Our historic and cultural<br />
heritage is protected for<br />
future generations<br />
The Burial and Cremation Act<br />
1964 requires Territorial Local<br />
Authorities to provide and<br />
maintain cemeteries and set<br />
and charge fees for the use of<br />
cemeteries. Residents, and their<br />
families, who opt for cremation<br />
should not have to pay all the<br />
Cemetery related general<br />
costs as their benefit is much<br />
less. Non-residents can also<br />
use the cemeteries but make<br />
no contribution to the general<br />
costs.<br />
There is currently no time limit<br />
on the use made of a burial plot.<br />
The fees charged cover the cost<br />
of maintenance for 60 years after<br />
that the plot becomes a charge<br />
on the <strong>Council</strong>. The <strong>Council</strong> also<br />
has to carry the areas that have<br />
been set aside for graves but<br />
have yet to be used.<br />
Because of the infinite life of a<br />
cemetery it is not possible to<br />
recoup the capital costs over<br />
its life. Accordingly, the capital<br />
cost of the plot should be the<br />
economic marginal cost of the<br />
plot that can be estimated by the<br />
current capital valuation from<br />
the <strong>Council</strong>’s Valuation Service<br />
Providers.<br />
The predominant benefit is to<br />
the those who will be buried<br />
(knowing that their wishes<br />
will be carried out), and their<br />
family and friends, but there is<br />
a benefit to the heritage and<br />
general atmosphere of <strong>District</strong><br />
as a whole through the provision<br />
of peaceful, tranquil and<br />
aesthetically pleasing cemeteries.<br />
Benefits from capital expenditure<br />
accrue when burial takes place<br />
and continue for the life of<br />
the cemetery. Benefits from<br />
operational expenditure accrue<br />
when the costs are incurred.<br />
Operational and Capital Costs:<br />
• Interment costs and purchase of<br />
plots are charged as user charges. Any<br />
shortfall in operational costs will be<br />
charged as a <strong>District</strong> Rate.<br />
• If the <strong>Council</strong> decides to apply some of<br />
the surplus from the Hanmer Springs<br />
Thermal Reserve, the amount of the<br />
contribution is subtracted from the<br />
<strong>District</strong> Rate<br />
Sustainability:<br />
• There will be a slight negative effect<br />
on the current economic wellbeing<br />
of those from whom user charges are<br />
educated, and a slight ongoing negative<br />
effect on the economic wellbeing of<br />
ratepayers in general, but this will be<br />
offset by gains in social and cultural<br />
wellbeing.<br />
236
<strong>Hurunui</strong> <strong>Community</strong> <strong>Long</strong> <strong>Term</strong> <strong>Plan</strong> <strong>2012</strong> - <strong>2022</strong><br />
Service<br />
Relevant <strong>Community</strong><br />
Outcomes<br />
Relevant Issues &<br />
Constraints<br />
Who benefits, and over<br />
what period<br />
Future Funding & Sustainability<br />
<strong>Community</strong><br />
Services and<br />
Facilities – Public<br />
Toilets<br />
The <strong>Council</strong>’s funding of<br />
Public Toilets contributes<br />
to the <strong>Hurunui</strong> district<br />
being:<br />
A desirable and safe place<br />
to live:<br />
• We have attractive well<br />
designed townships<br />
• Communities have<br />
access to adequate<br />
health and emergency<br />
services and systems<br />
and resources are<br />
available to meet civil<br />
defence emergencies<br />
• Risks to public health<br />
are identified and<br />
appropriately managed<br />
A place where our<br />
traditional rural values and<br />
heritage make <strong>Hurunui</strong><br />
unique:<br />
• People have a range<br />
of opportunities to<br />
participate in leisure<br />
and culture activities<br />
• Our historic and<br />
cultural heritage is<br />
protected for future<br />
generations<br />
Those who use the public<br />
toilets benefit more than<br />
those who do not, so<br />
there is justification in<br />
terms of account- ability<br />
and transparency for<br />
funding these separately<br />
from other facilities and<br />
services. Funding this<br />
service separately adds no<br />
extra cost.<br />
<strong>Council</strong> policy is that there<br />
should be at least one<br />
public toilet in each town<br />
on tourist routes (more<br />
toilets if the ex- tent of the<br />
usage by visitors demands<br />
this). It is impractical to<br />
charge individual users.<br />
Toilets on tourist routes<br />
- visitors and locals<br />
benefit from being able<br />
to use the toilets, but<br />
the predominant benefit<br />
is to the <strong>District</strong> as a<br />
whole, as the provision<br />
of good quality and well<br />
maintained toilets for<br />
visitors should improve<br />
their experience of<br />
the <strong>District</strong> and thus<br />
encourage them to visit<br />
again or to tell others<br />
to do so, leading to<br />
economic benefits for the<br />
<strong>District</strong>.<br />
Other toilets - The<br />
predominant benefit is<br />
to residents of the local<br />
community in which the<br />
toilets are situated.<br />
Benefits from capital<br />
expenditure are received<br />
over the life of the<br />
facility and benefits from<br />
operational expenditure<br />
are accrued at the time<br />
the expenditure is made.<br />
Operational and Capital Costs:<br />
• Toilets provided on tourist routes:<br />
• 100% <strong>District</strong> Rate or use of surpluses from the<br />
Hanmer Springs Thermal Reserve.<br />
• Ward or <strong>Community</strong> Rating Area toilets: Included in<br />
Township Maintenance – 100% local amenity rate on<br />
the local ward or community rating area.<br />
• If the <strong>Council</strong> decides to apply some of the surplus<br />
from the Hanmer Springs Thermal Reserve, the<br />
amount of the contribution is subtracted from the<br />
<strong>District</strong> Rate.<br />
• If any of the Capital Expenditure caters for future<br />
growth, then that portion of the expenditure that<br />
relates to growth may be funded from future lots via<br />
Development Contributions and loans.<br />
Sustainability:<br />
• There will be a slight negative effect on the current<br />
and future economic wellbeing of those who pay for<br />
this service, but this will be offset by gains in social<br />
and/or economic wellbeing.<br />
237
www.hurunui.govt.nz<br />
Service<br />
Relevant <strong>Community</strong><br />
Outcomes<br />
Relevant Issues & Constraints<br />
Who benefits, and<br />
over what period<br />
Future Funding & Sustainability<br />
<strong>Community</strong><br />
Services and<br />
Facilities –<br />
Libraries<br />
The <strong>Council</strong>’s funding of<br />
Cemeteries contributes to<br />
the <strong>Hurunui</strong> district being:<br />
A desirable and safe place<br />
to live:<br />
• We have attractive well<br />
designed townships<br />
• Communities have<br />
access to adequate<br />
health and emergency<br />
services and systems and<br />
resources are available<br />
to meet civil defence<br />
emergencies<br />
• Risks to public health<br />
are identified and<br />
appropriately managed<br />
A place where our<br />
traditional rural values and<br />
heritage make <strong>Hurunui</strong><br />
unique:<br />
• People have a range<br />
of opportunities to<br />
participate in leisure and<br />
culture activities<br />
• Our historic and cultural<br />
heritage is protected for<br />
future generations<br />
Libraries receive a significant<br />
amount of funding; hence there is<br />
justification in terms of transparency<br />
and account- ability for funding<br />
this service distinctly from other<br />
services. Funding this service<br />
separately adds no extra cost.<br />
It is <strong>Council</strong> policy to provide<br />
a public library network for the<br />
district and the high number of<br />
volunteers and the high membership<br />
rate demonstrate a strong level of<br />
community support.<br />
The Local Government Act 2002<br />
stipulates free membership of<br />
libraries - the aim being to provide<br />
an accessible library service<br />
that supports an educated and<br />
culturally enriched community. The<br />
library provides resources for the<br />
community regardless of income,<br />
isolation, ability and technical<br />
expertise.<br />
Funding discussions centre around<br />
the ‘who pays’ argument and the<br />
impact that charges will have on<br />
the community. Library collections<br />
today are made up of many formats<br />
including books, video, DVD, CD,<br />
magazines, newspapers and a variety<br />
of online databases including the<br />
internet. The library retrieves 3% of<br />
its operational costs. Charges apply<br />
to overdue items and to services that<br />
are considered value added. Rentals<br />
are applied to most audiovisual loans<br />
– copyright legislation stipulates that<br />
libraries are not to make a profit on<br />
these items – and to some internet<br />
usage.<br />
Having different charges for different<br />
groups of people (low income<br />
earners, children, superannuatants,<br />
etc) is more costly to administer<br />
than the cost of free access to<br />
library services.<br />
The target group (adults with low<br />
income and children) could not<br />
afford to pay user charges for books.<br />
Bringing in differentiated charges<br />
would be an enormous administrative<br />
load that would cost more than free<br />
access. The closest to a user charge<br />
would be a Uniform Annual General<br />
Charge.<br />
The predominant benefit<br />
from libraries is to the<br />
<strong>District</strong> as a whole<br />
in encouraging the<br />
development of an informed<br />
and educated <strong>Community</strong>.<br />
Additional benefits from<br />
enhanced library services<br />
may be derived from<br />
residents of the local ward<br />
or community rating area in<br />
which the library is located.<br />
Operational Costs:<br />
• Library user charges (overdue fines,<br />
book reserves etc).<br />
• The libraries in Amberley and<br />
Hanmer Springs are located<br />
on reserves, therefore, the net<br />
operational costs are funded through<br />
the surplus from the Hanmer Springs<br />
Thermal Reserve.<br />
• The libraries in Culverden, Hawarden<br />
and Cheviot are not located on<br />
reserves and as such, the funding<br />
of the operational costs for these<br />
is made from an allocation from<br />
the <strong>Council</strong>’s treasury surplus.<br />
Therefore, there is no rating input to<br />
operate the libraries.<br />
Capital Costs:<br />
• Significant Capital Expenditure on<br />
land and building will be funded from<br />
<strong>Council</strong> reserves or loans pursuant<br />
the <strong>Council</strong>’s Internal Financing<br />
Policy, and if any of this Capital<br />
Expenditure caters for future growth,<br />
then that portion of the expenditure<br />
that relates to growth may be funded<br />
from future units of demand via<br />
Development Contributions.<br />
• The construction of the <strong>Hurunui</strong><br />
Memorial Library has been funded<br />
from two loans pursuant to the<br />
<strong>Council</strong>’s Internal Financing Policy.<br />
• The first loan represented the<br />
majority of the cost. The repayments<br />
of principal and interest for the<br />
majority of the loan are funded by<br />
way of development contributions.<br />
• The second loan was the marginal<br />
cost of an enhanced building which<br />
was assigned to the Amberley Ward.<br />
The marginal cost was assessed at<br />
$260,000. Since 2004, the Amberley<br />
Ward Ratepayers have been<br />
contributing $16.00 per rating unit,<br />
which has been used to fund the<br />
interest and principal repayments.<br />
This loan is expected to be repaid<br />
in 2016.<br />
Sustainability:<br />
• There will be a positive effect on<br />
the current and future social and<br />
cultural wellbeing of library users.<br />
238
<strong>Hurunui</strong> <strong>Community</strong> <strong>Long</strong> <strong>Term</strong> <strong>Plan</strong> <strong>2012</strong> - <strong>2022</strong><br />
Service<br />
Relevant <strong>Community</strong><br />
Outcomes<br />
Relevant Issues &<br />
Constraints<br />
Who benefits, and over<br />
what period<br />
Future Funding & Sustainability<br />
Environment and<br />
Safety – Civil<br />
Defence<br />
The <strong>Council</strong>’s funding<br />
of Civil Defence service<br />
contributes to the <strong>Hurunui</strong><br />
district being:<br />
A desirable and safe place<br />
to live:<br />
• We have attractive well<br />
designed townships<br />
• Communities have access<br />
to adequate health and<br />
emergency services and<br />
systems and resources<br />
are available to meet civil<br />
defence emergencies<br />
• Risks to public health<br />
are identified and<br />
appropriately managed<br />
A place that demonstrates<br />
environmental responsibility:<br />
• We protect our<br />
environment while<br />
preserving people’s<br />
property rights<br />
• We minimise solid waste<br />
to the fullest extent, and<br />
manage the rest in a<br />
sustainable way<br />
There are (or can be)<br />
significant costs associated<br />
with Civil Defence, and<br />
funding includes government<br />
contributions, hence, in the<br />
interests of transparency<br />
and accountability, there<br />
is justification for funding<br />
this service distinctly from<br />
other services. There<br />
is no significant cost in<br />
maintaining this distinction.<br />
Who Benefits, and over what<br />
Period?<br />
It is not practical to quantify<br />
benefits to individual<br />
ratepayers or groups of<br />
ratepayers, so the <strong>District</strong> as<br />
a whole is assumed to benefit.<br />
There is a small component of<br />
benefit to visitors, who might<br />
otherwise be more adversely<br />
affected by an emergency, and<br />
to the national community,<br />
who would have to contribute<br />
more resources for emergency<br />
relief if local measures were<br />
not in place.<br />
No significant capital<br />
investment in this area.<br />
Benefits of operational<br />
expenditure accrue at the time<br />
of expenditure.<br />
Operational Costs:<br />
• 100% <strong>District</strong> Rate after taking into<br />
account the small central government<br />
contribution via an annual grant.<br />
Sustainability:<br />
• The negative impact of the cost of<br />
this service is offset by the social<br />
wellbeing through having a safe and<br />
healthy communities.<br />
239
www.hurunui.govt.nz<br />
Service<br />
Relevant <strong>Community</strong><br />
Outcomes<br />
Relevant Issues &<br />
Constraints<br />
Who benefits, and over<br />
what period<br />
Future Funding & Sustainability<br />
Environment and<br />
Safety – Rural Fire<br />
The <strong>Council</strong>’s funding<br />
of Rural Fire service<br />
contributes to the<br />
<strong>Hurunui</strong> district being:<br />
A desirable and safe place<br />
to live:<br />
- We have attractive well<br />
designed townships<br />
- Communities have<br />
access to adequate<br />
health and emergency<br />
services and systems<br />
and resources are<br />
available to meet civil<br />
defence emergencies<br />
- Risks to public health<br />
are identified and<br />
appropriately managed<br />
A place that demonstrates<br />
environmental<br />
responsibility:<br />
- We protect our<br />
environment while<br />
preserving people’s<br />
property rights<br />
- We minimise solid<br />
waste to the fullest<br />
extent, and manage the<br />
rest in a sustainable<br />
way<br />
Rural communities benefit<br />
more than others from this<br />
service, hence there are<br />
benefits to transparency and<br />
accountability from funding<br />
this service distinctly from<br />
other services, and not<br />
significant costs involved.<br />
It is questionable whether or<br />
not urban ratepayers within<br />
the <strong>District</strong> should contribute<br />
to the provision of a rural<br />
fire service. The assistance<br />
that the rural brigades make<br />
to the urban areas is offset<br />
by reciprocal arrangement of<br />
urban brigades to turn out to<br />
rural fires.<br />
The New Zealand Fire Service<br />
may attend rural fires with the<br />
first hour being at no charge.<br />
There is a subsidy applied by<br />
government.<br />
The predominant benefit is<br />
to properties in the defined<br />
rural fire areas, but there is<br />
a benefit to the <strong>District</strong> as<br />
a whole, and to the nation<br />
as a whole in mitigating the<br />
environmental and economic<br />
effects of vegetation fires.<br />
Benefits from operational<br />
expenditure are spread over<br />
the financial year to which<br />
they apply.<br />
Fighting fires:<br />
• Property owner pays. In some instances<br />
there may be a portion of the fire<br />
fighting costs that may not be able to<br />
be recovered. Such cost will need to be<br />
recovered in line with other costs.<br />
Other costs:<br />
• After taking Government grants into<br />
account, 80% from ratepayers in the<br />
Rural Fire Authority area and 20%<br />
from ratepayers outside the Rural Fire<br />
Authority area. Both will be collected<br />
by way of a Targeted Rate known as the<br />
Rural Fire Rate.<br />
Sustainability:<br />
• The negative impact of the cost of this<br />
service is offset by the social wellbeing<br />
through having a safe and healthy<br />
communities.<br />
240
<strong>Hurunui</strong> <strong>Community</strong> <strong>Long</strong> <strong>Term</strong> <strong>Plan</strong> <strong>2012</strong> - <strong>2022</strong><br />
Service<br />
Relevant<br />
<strong>Community</strong><br />
Outcomes<br />
Relevant Issues &<br />
Constraints<br />
Who benefits, and over<br />
what period<br />
Future Funding & Sustainability<br />
Environment and<br />
Safety – Resource<br />
Management<br />
The <strong>Council</strong>’s funding of<br />
Resource Management<br />
services contributes<br />
to the <strong>Hurunui</strong> district<br />
being:<br />
A desirable and safe<br />
place to live:<br />
- We have attractive<br />
well designed<br />
townships<br />
- Communities have<br />
access to adequate<br />
health and emergency<br />
services and systems<br />
and resources are<br />
available to meet civil<br />
defence emergencies<br />
- Risks to public<br />
health are identified<br />
and appropriately<br />
managed<br />
A place that<br />
demonstrates<br />
environmental<br />
responsibility:<br />
- We protect our<br />
environment while<br />
preserving people’s<br />
property rights<br />
- We minimise<br />
solid waste to the<br />
fullest extent, and<br />
manage the rest in a<br />
sustainable way<br />
This is a significant and<br />
reasonably discrete area<br />
of expenditure; hence<br />
there are benefits in<br />
terms of transparency and<br />
accountability from funding it<br />
distinctly from other services.<br />
There are no significant costs<br />
involved in this distinction.<br />
Statutory constraints<br />
apply. Recovery of<br />
“reasonable costs” relating<br />
to administration is allowed<br />
under the terms of section 36<br />
of the Resource Management<br />
Act.<br />
Resource Management Act<br />
– resource consents, 100%<br />
user charges. The <strong>Council</strong><br />
may waive consent fees as<br />
provided for in the RMA.<br />
In general applicants for<br />
resource consents should pay<br />
all processing costs.<br />
100% benefit from policy<br />
services to the <strong>District</strong> as a<br />
whole through promotion of<br />
the sustainable management<br />
of the <strong>District</strong>’s natural and<br />
physical resources for future<br />
generations.<br />
The predominant benefit from<br />
consents is to the individuals<br />
who require them, but<br />
there is some benefit to the<br />
<strong>District</strong> as a whole in that all<br />
ratepayers can be assured that<br />
the environment they work,<br />
eat, drink and live in is safe<br />
and managed in accordance<br />
with the principles of sustainable<br />
management under the<br />
provisions of the Resource<br />
Management Act.<br />
Capital costs are minimal in<br />
this function and the benefits<br />
from operational expenditure<br />
are spread over the year<br />
it is incurred. Any costs of<br />
mediation to make the <strong>District</strong><br />
<strong>Plan</strong> operative to be spread<br />
over the life of the plan (10<br />
years).<br />
Resource Consents:<br />
• 100% user charges. <strong>Council</strong> may waive<br />
consent fees as provided for in the Resource<br />
Management Act.<br />
Private <strong>District</strong> <strong>Plan</strong> Changes:<br />
• All costs met by the applicant.<br />
<strong>Council</strong> Initiated <strong>Plan</strong> Changesded by the l Rate.<br />
• Extraordinary <strong>Plan</strong>ning Issues will be<br />
assessed on a case-by-case basis to<br />
determine the appropriate method for<br />
funding.<br />
• Some of the benefits from RMA related<br />
services will be linked to the value of land<br />
owned; others will be independent of this.<br />
The balance of the costs will be met by a<br />
<strong>District</strong> Rate (known as the planning rate).<br />
Sustainability:<br />
• The slight ongoing negative effects on the<br />
economic wellbeing of ratepayers from the<br />
cost of the service will be offset by future<br />
gains in environmental and social wellbeing.<br />
241
www.hurunui.govt.nz<br />
Service<br />
Relevant <strong>Community</strong><br />
Outcomes<br />
Relevant Issues &<br />
Constraints<br />
Who benefits, and over what<br />
period<br />
Future Funding &<br />
Sustainability<br />
•<br />
Environment and The <strong>Council</strong>’s funding of<br />
Safety - Amberley coastal flood-protection<br />
Beach Foreshore works helps to make the<br />
Protection <strong>Hurunui</strong> district being:<br />
A desirable and safe place<br />
to live:<br />
• We have attractive well<br />
designed townships<br />
• Communities have<br />
access to adequate<br />
health and emergency<br />
services and systems and<br />
resources are available<br />
to meet civil defence<br />
emergencies<br />
• Risks to public health<br />
are identified and<br />
appropriately managed<br />
A place that demonstrates<br />
environmental<br />
responsibility:<br />
• We protect our<br />
environment while<br />
preserving people’s<br />
property rights<br />
• We minimise solid waste<br />
to the fullest extent, and<br />
manage the rest in a<br />
sustainable way<br />
Those living in affected<br />
areas benefit more than<br />
others, hence there is<br />
justification, in terms of<br />
increased transparency and<br />
accountability, for funding this<br />
service distinctly from other<br />
services.<br />
Amberley Beach is a<br />
community that is threatened<br />
by coastal erosion. Unless<br />
the coastal protection is<br />
replenished by adding more<br />
suitable material, property will,<br />
eventually, be lost.<br />
The community wishes<br />
the <strong>Council</strong> to re-nourish<br />
the coastal protection by<br />
adding more material as<br />
necessary. The frequency of<br />
re-nourishment is expected to<br />
be between two to five years.<br />
The <strong>Council</strong> has the power<br />
to ensure that all who benefit<br />
from the scheme pay and<br />
that there are no free rider<br />
problems.<br />
Since the works are to<br />
preserve property values then<br />
the expenditure should be<br />
funded by a rate on property<br />
value. If any <strong>Council</strong> property<br />
is located in the community,<br />
or any other organisation’s<br />
property is located in<br />
the community, then that<br />
organisation should contribute<br />
in proportion to the property<br />
value in the same measure<br />
as other properties in the<br />
community.<br />
100% benefit to the owners of<br />
properties protected by the works, and<br />
this is in proportion to the value of the<br />
property.<br />
The benefits from capital expenditure<br />
accrue over the life of the asset and the<br />
benefits from operational expenditure<br />
accrue at the time that the work is<br />
completed.<br />
Capital Costs:<br />
• Flooding protection works will<br />
be funded 100% Targeted Rate<br />
on each rating unit that <strong>Council</strong><br />
considers receives direct benefit<br />
from such protection.<br />
Sustainability:<br />
• The slight ongoing negative effects<br />
on the economic well- being of<br />
those who pay for this service<br />
will be offset by future gains in<br />
economic and environmental<br />
wellbeing.<br />
242
<strong>Hurunui</strong> <strong>Community</strong> <strong>Long</strong> <strong>Term</strong> <strong>Plan</strong> <strong>2012</strong> - <strong>2022</strong><br />
Service<br />
Relevant <strong>Community</strong><br />
Outcomes<br />
Relevant Issues &<br />
Constraints<br />
Who benefits, and over<br />
what period<br />
Future Funding & Sustainability<br />
Environment<br />
and Safety –<br />
Swimming Pool<br />
Inspections<br />
The <strong>Council</strong>’s funding<br />
Swimming Pool Inspections<br />
services contributes to the<br />
<strong>Hurunui</strong> district being:<br />
A desirable and safe place<br />
to live:<br />
- We have attractive well<br />
designed townships<br />
- Communities have<br />
access to adequate<br />
health and emergency<br />
services and systems<br />
and resources are<br />
available to meet civil<br />
defence emergencies<br />
- Risks to public health<br />
are identified and<br />
appropriately managed<br />
A place that demonstrates<br />
e n v i r o n m e n t a l<br />
responsibility:<br />
- We protect our<br />
environment while<br />
preserving people’s<br />
property rights<br />
- We minimise solid<br />
waste to the fullest<br />
extent, and manage the<br />
rest in a sustainable way<br />
Those with swimming pools<br />
benefit more from this service<br />
than others; hence there are<br />
benefits to accountability and<br />
transparency from funding<br />
this service distinctly from<br />
other services. There are no<br />
significant costs involved in<br />
this distinction.<br />
The <strong>Council</strong> is required to<br />
take all reasonable steps to<br />
en- sure private swimming<br />
pools meet the requirements<br />
of the Fencing of Swimming<br />
Act 1987. The <strong>Council</strong> is<br />
concerned at the level of noncompliance<br />
relating to this<br />
Act. The <strong>Council</strong> is currently<br />
auditing 33% of swimming<br />
pools on its register annually<br />
and believes this will increase<br />
pool owners’ awareness of<br />
the importance of maintaining<br />
existing fence standards to<br />
those required by the Act.<br />
100% benefit to swimming pool<br />
owners, as they would be held<br />
liable if an accident were to<br />
occur due to their swimming<br />
pool not having adequate<br />
fencing. There is also a benefit<br />
to other persons who may use<br />
the swimming pool in question,<br />
in the form of a reduced risk of<br />
accidental drowning, but this is<br />
impractical to quantify.<br />
The benefits from capital<br />
expenditure accrue over the<br />
life of the asset and the benefits<br />
from operational expenditure<br />
accrue at the time that the work<br />
is completed.<br />
Operational Costs:<br />
- 100% of the costs will be recovered from<br />
a targeted rate on each rating unit on<br />
which is located a swimming pool.<br />
- Pools which remain non-compliant will<br />
incur an inspection fee for any inspection<br />
and subsequent inspections.<br />
Sustainability:<br />
- The negative impact of the cost of this<br />
service is offset by the social wellbeing<br />
through having a safe and healthy<br />
communities.<br />
243
www.hurunui.govt.nz<br />
Service<br />
Relevant<br />
<strong>Community</strong><br />
Outcomes<br />
Relevant Issues &<br />
Constraints<br />
Who benefits, and over<br />
what period<br />
Future Funding & Sustainability<br />
Environment and<br />
Safety – Building<br />
Controls<br />
The <strong>Council</strong>’s funding<br />
Building Services<br />
contributes to the<br />
<strong>Hurunui</strong> district being:<br />
A desirable and safe<br />
place to live:<br />
- We have attractive<br />
well designed<br />
townships<br />
- Communities have<br />
access to adequate<br />
health and emergency<br />
services and systems<br />
and resources are<br />
available to meet civil<br />
defence emergencies<br />
- Risks to public<br />
health are identified<br />
and appropriately<br />
managed<br />
A place that<br />
d e m o n s t r a t e s<br />
e n v i r o n m e n t a l<br />
responsibility:<br />
- We protect our<br />
environment while<br />
preserving people’s<br />
property rights<br />
- We minimise<br />
solid waste to the<br />
fullest extent, and<br />
manage the rest in a<br />
sustainable way<br />
Those who use the service<br />
benefit more than those<br />
who do not, hence, for<br />
reasons of transparency<br />
and account- ability, there<br />
is justification for funding<br />
it distinctly from other<br />
services. There are no<br />
significant costs involved in<br />
this distinction.<br />
The predominant benefit is<br />
to the owner of the premises,<br />
but there are benefits to the<br />
<strong>District</strong> as a whole in that<br />
the service is available on an<br />
ongoing basis to cater for<br />
future development and in<br />
that residents are assured<br />
that the environment they<br />
work and live in is safe.<br />
The benefits from capital<br />
expenditure accrue over<br />
the life of the asset and the<br />
benefits from operational<br />
expenditure accrue at<br />
the time that the work is<br />
completed.<br />
Building consents:<br />
- 100% user charges.<br />
Building Administration other than consents<br />
processing (including some advice):<br />
- Some of the benefit from this will be related to<br />
property value and some will not. The <strong>Council</strong><br />
has determined that this should be funded from<br />
the <strong>District</strong> The slight ongoing negative effects<br />
on the economic well- being of those who pay<br />
for these services will be offset by future gains in<br />
social and environmental wellbeing.<br />
BCA Costs:<br />
- The costs relating to the BCA Accreditation<br />
process will be funded by a separate levy charged<br />
on building consents.<br />
Sustainability:<br />
- The negative impact of the cost of this service is<br />
offset by the social wellbeing through having a safe<br />
and healthy communities.<br />
244
<strong>Hurunui</strong> <strong>Community</strong> <strong>Long</strong> <strong>Term</strong> <strong>Plan</strong> <strong>2012</strong> - <strong>2022</strong><br />
Service<br />
Relevant <strong>Community</strong><br />
Outcomes<br />
Relevant Issues &<br />
Constraints<br />
Who benefits, and<br />
over what period<br />
Future Funding & Sustainability<br />
Environment and<br />
Safety – Health<br />
and Liquor<br />
Licensing<br />
The <strong>Council</strong>’s funding<br />
Health and Liquor<br />
Licensing services<br />
contributes to the <strong>Hurunui</strong><br />
district being:<br />
A desirable and safe place<br />
to live:<br />
- We have attractive well<br />
designed townships<br />
- Communities have<br />
access to adequate<br />
health and emergency<br />
services and systems<br />
and resources are<br />
available to meet civil<br />
defence emergencies<br />
- Risks to public health<br />
are identified and<br />
appropriately managed<br />
A place that demonstrates<br />
e n v i r o n m e n t a l<br />
responsibility:<br />
- We protect our<br />
environment while<br />
preserving people’s<br />
property rights<br />
- We minimise solid<br />
waste to the fullest<br />
extent, and manage the<br />
rest in a sustainable way<br />
Those who use the services<br />
benefit more than those<br />
who do not, hence, for<br />
reasons of transparency<br />
and accountability, there<br />
is justification for funding<br />
them distinctly from other<br />
services. There are no<br />
significant costs involved in<br />
this distinction.<br />
For some health functions<br />
there are statutory<br />
constraints on the<br />
application of user charges,<br />
e.g. infectious disease<br />
follow-ups. The Sale of<br />
Liquor Act sets the fees that<br />
can be charged for liquor<br />
licensing<br />
The predominant benefit<br />
is to the occupier of the<br />
premises that are licensed,<br />
but there is a component<br />
of benefit to the <strong>District</strong><br />
as a whole in that people<br />
are assured that the<br />
environment they work,<br />
eat, drink and live in is safe.<br />
There is no relationship<br />
between this benefit and<br />
property value.<br />
The benefits from capital<br />
expenditure accrue over<br />
the life of the asset and the<br />
benefits from operational<br />
expenditure accrue at the<br />
time work is completed.<br />
Health:<br />
- User charges meet a portion of the cost with the<br />
shortfall to be met from the <strong>District</strong> Rate.<br />
Liquor:<br />
- Maximum fees as set out in the Sale of Liquor Act<br />
with any shortfall from the <strong>District</strong> Rate.<br />
Sustainability:<br />
- The negative impact of the cost of this service is<br />
offset by the social wellbeing through having a safe<br />
and healthy communities.<br />
245
www.hurunui.govt.nz<br />
Service<br />
Relevant<br />
<strong>Community</strong><br />
Outcomes<br />
Relevant Issues &<br />
Constraints<br />
Who benefits, and<br />
over what period<br />
Future Funding & Sustainability<br />
Environment and<br />
Safety – Animal<br />
Control<br />
The <strong>Council</strong>’s funding<br />
Animal Control services<br />
contributes to the<br />
<strong>Hurunui</strong> district being:<br />
A desirable and safe<br />
place to live:<br />
- We have attractive<br />
well designed<br />
townships<br />
- Communities have<br />
access to adequate<br />
health and emergency<br />
services and systems<br />
and resources are<br />
available to meet civil<br />
defence emergencies<br />
A place that<br />
d e m o n s t r a t e s<br />
e n v i r o n m e n t a l<br />
responsibility:<br />
- We protect our<br />
environment while<br />
preserving people’s<br />
property rights<br />
- We minimise<br />
solid waste to the<br />
fullest extent, and<br />
manage the rest in a<br />
sustainable way<br />
Those who use the<br />
service benefit more<br />
than those who do<br />
not, hence, for reasons<br />
of transparency and<br />
accountability, there is<br />
justification for funding<br />
it distinctly from<br />
other services. There<br />
are no significant<br />
costs involved in<br />
this distinction. Dog<br />
registration cost issues<br />
and recovery of costs<br />
associated with dog<br />
control are set out in<br />
the Dog Control Act.<br />
Dog owners question<br />
what benefit they<br />
derive from the<br />
- Risks to public<br />
health are identified<br />
and appropriately registration<br />
managed<br />
process.<br />
Do the majority<br />
of owners pay for<br />
the minority who<br />
are negligent in<br />
their ownership<br />
responsibilities? While<br />
this is a valid question,<br />
it is impractical to<br />
amend the system as<br />
to do so would cost<br />
more than any gain<br />
that would be derived.<br />
Dog and animal<br />
control legislation<br />
is clearly based on a<br />
mix of the principle<br />
that the owner should<br />
pay for animal control<br />
“incidents” with the<br />
establishment of the<br />
service being a public<br />
good.<br />
100% benefit to animal<br />
owners for incidents<br />
and 100% benefit to<br />
the <strong>District</strong> as a whole<br />
for service readiness.<br />
This latter benefit will<br />
relate to the area of<br />
land owned (the more<br />
land, the more scope<br />
for wandering stock),<br />
and thus for all practical<br />
purposes may be tied<br />
to its Capital Value.<br />
100% benefit to<br />
the dog owner for<br />
incidents; 100% dog<br />
registration fee for<br />
readiness.<br />
No significant capital<br />
expenditure is involved<br />
with this service.<br />
All operational<br />
expenditure is applied<br />
to the pro- vision of<br />
service in the year it is<br />
collected.<br />
Dog Registration:<br />
Process and standby (including record keeping) are funded by<br />
the dog registration fee.<br />
The owner pays with the shortfall (eg: complaint unfounded,<br />
dog gone, etc), funded by dog registration fees.<br />
Stock Control:<br />
Costs relating to animal or stock control are paid 100% from<br />
stock owners; the balance of remaining costs to be met from<br />
the <strong>District</strong> Rate.<br />
Sustainability:<br />
The negative impact of the cost of this service is offset by the<br />
social wellbeing through having a safe and healthy communities.<br />
246
<strong>Hurunui</strong> <strong>Community</strong> <strong>Long</strong> <strong>Term</strong> <strong>Plan</strong> <strong>2012</strong> - <strong>2022</strong><br />
Service<br />
Relevant <strong>Community</strong><br />
Outcomes<br />
Relevant Issues &<br />
Constraints<br />
Who benefits, and<br />
over what period<br />
Future Funding & Sustainability<br />
Environment and<br />
Safety – Waste<br />
Minimisation<br />
The <strong>Council</strong>’s funding<br />
of Solid Waste services<br />
contributes to the <strong>Hurunui</strong><br />
district being:<br />
A desirable and safe place<br />
to live:<br />
- We have attractive well<br />
designed townships<br />
- Communities have access<br />
to adequate health and<br />
emergency services and<br />
systems and resources<br />
are available to meet civil<br />
defence emergencies<br />
- Risks to public health<br />
are identified and<br />
appropriately managed<br />
A place that demonstrates<br />
environmental responsibility:<br />
- We protect our<br />
environment while<br />
preserving people’s<br />
property rights<br />
- We minimise solid waste<br />
to the fullest extent, and<br />
manage the rest in a<br />
sustainable way<br />
This is a significant<br />
service in terms<br />
of expenditure, so<br />
there are benefits for<br />
accountability and<br />
transparency from<br />
funding it separately<br />
from other services.<br />
Funding this service<br />
separately adds no<br />
significant extra cost.<br />
The predominant benefit<br />
is to those disposing of<br />
their waste but there is<br />
a general benefit to the<br />
<strong>District</strong> as a whole through<br />
having adequate waste<br />
disposal systems in place<br />
and discouraging illegal<br />
dumping or storing of<br />
rubbish.<br />
Benefits from capital<br />
expenditure accrue for<br />
the lifetime of facilities<br />
such as transfer stations.<br />
Benefits from operational<br />
expenditure occur at the<br />
time the expenditure is<br />
made.<br />
Operational Costs:<br />
- -Refuse collection costs are all met through<br />
targeted rates for each dwelling or business in each<br />
urban area based on the cost of collection in that<br />
urban area.<br />
- -Rural rate payers on the route can have their<br />
rubbish picked up for the above cost plus a marginal<br />
charge for the provision of the rural collection<br />
stickers.<br />
- -Transfer station costs are met through fees set at<br />
each transfer station. The fees are set to encourage<br />
use and discourage illegal dumping. Any shortfall in<br />
costs is met from a <strong>District</strong> Rate.<br />
- -Litter bin collection costs are all met through a<br />
<strong>District</strong> Rate.<br />
Capital Costs:<br />
- -Any capital expenditure on the transfer stations is<br />
funded over the life of the asset through a <strong>District</strong><br />
Rate.<br />
- -Income from the <strong>Council</strong>’s reimbursement from<br />
the landfill levy maybe used for capital purchases.<br />
Sustainability:<br />
The ongoing negative effects on the economic<br />
wellbeing of those who pay for solid waste collection<br />
will be offset by future gains in social and environmental<br />
wellbeing.<br />
247
www.hurunui.govt.nz<br />
Service<br />
Relevant<br />
<strong>Community</strong><br />
Outcomes<br />
Relevant Issues &<br />
Constraints<br />
Who benefits, and over what<br />
period<br />
Future Funding & Sustainability<br />
<strong>District</strong> Promotion The <strong>Council</strong>’s funding<br />
<strong>District</strong> Promotion and<br />
Development services<br />
contributes to the<br />
<strong>Hurunui</strong> district being:<br />
A place with a thriving<br />
local economy:<br />
- We are seen as a<br />
good place to do<br />
business, to live and<br />
to visit<br />
This is a distinct area of<br />
<strong>Council</strong> expenditure; hence,<br />
for reasons of transparency<br />
and accountability, there<br />
is justification for funding<br />
these services distinctly from<br />
other services. There are no<br />
significant costs involved in this<br />
distinction<br />
100% benefit to the <strong>District</strong> as a<br />
whole for general district promotion<br />
(in proportion to Capital Value), and<br />
the same for general economic<br />
development (partly in proportion<br />
to Capital Value, partly independent<br />
of this).<br />
There is no significant capital<br />
requirement and operation- al<br />
benefits are received at the time, or<br />
near to the time, of expenditure.<br />
Operational Costs:<br />
- 100% <strong>District</strong> Rate<br />
Sustainability:<br />
- The negative impact through paying for<br />
this service is offset by the economic<br />
wellbeing of the district.<br />
248
<strong>Hurunui</strong> <strong>Community</strong> <strong>Long</strong> <strong>Term</strong> <strong>Plan</strong> <strong>2012</strong> - <strong>2022</strong><br />
Service<br />
Relevant<br />
<strong>Community</strong><br />
Outcomes<br />
Relevant Issues &<br />
Constraints<br />
Who benefits, and over<br />
what period<br />
Future Funding & Sustainability<br />
Hanmer Springs<br />
Thermal Pools<br />
and Spa<br />
The <strong>Council</strong>’s funding<br />
the Hanmer Springs<br />
Thermal Pools and Spa<br />
(also known as the<br />
Hanmer Springs Thermal<br />
Reserve) function<br />
contributes to the<br />
<strong>Hurunui</strong> district being:<br />
A place with a thriving<br />
local economy:<br />
- We are seen as a<br />
good place to do<br />
business, to live and<br />
to visit<br />
A place where our<br />
traditional rural values<br />
and heritage make<br />
<strong>Hurunui</strong> unique:<br />
- People have a range<br />
of opportunities to<br />
participate in leisure<br />
and culture activities<br />
- Our historic and<br />
cultural heritage is<br />
protected for future<br />
generations<br />
The Thermal Pool complex<br />
is run as a department of<br />
the <strong>Council</strong> and as such, the<br />
use of the profits has certain<br />
restrictions placed on it and<br />
most of it must be in accord<br />
with the Reserves Act. The<br />
Pools is run as a business and<br />
deliberately aims for increased<br />
profits. The resulting profits<br />
can amount to more than<br />
needs to be spent on reserves.<br />
All ratepayers living in the<br />
<strong>Hurunui</strong> <strong>District</strong> benefit from<br />
the Thermal Pools operation<br />
in some way or other. Because<br />
of the profits earned from the<br />
Pools, these are used to offset<br />
the amount of rates charged<br />
to the ratepayer. All reserves<br />
and operations run on reserves,<br />
such as libraries, are funded<br />
from the pools surpluses rather<br />
than through direct rates.<br />
Residents in the <strong>Hurunui</strong><br />
benefit from having the thermal<br />
pools resource in the <strong>District</strong><br />
from a recreational point of<br />
view. Residents have special<br />
discounted rates to use the<br />
pools.<br />
The Thermal Pool complex<br />
brings visitors and tourists into<br />
the <strong>District</strong> which brings about<br />
economic benefits to other<br />
business operators.<br />
Operational Costs:<br />
-100% user charge as per the pools fee schedule.<br />
Capital Costs:<br />
- -Replacement of existing assets is funded<br />
from the Hanmer Springs Thermal Reserve<br />
surpluses.<br />
- -Expenditure on new assets are generally<br />
funded through an internal loan according to<br />
<strong>Council</strong>’s internal financing policy.<br />
- The Thermal Pools and Spa are funded 100%<br />
by user charges and generate an annual<br />
surplus for <strong>Council</strong>. Major capital works are<br />
funded through the Thermal Pools and Spa<br />
borrowing from the <strong>Council</strong> pursuant to<br />
the <strong>Council</strong>’s Internal Financing Policy. The<br />
interest rate set at:<br />
- -2.5% above the <strong>Council</strong>’s external borrowing<br />
rate<br />
- Minor capital works are funded through the<br />
Thermal Pools and Spa’s retained earnings.<br />
The additional interest derived from the<br />
internal financing to the Thermal Pools and<br />
Spa ($25,000 per $1 million of borrowings)<br />
provides a good return for the <strong>Council</strong> that<br />
contributes toward lower rates.<br />
Use of income derived from the Thermal Pools<br />
and Spa:<br />
- The Thermal Pools and Spa are situated<br />
on a Recreation Reserve which has been<br />
vested in the <strong>Council</strong> under the Reserves<br />
Act 1977. Pursuant to the Reserves Act, the<br />
<strong>Council</strong> is only able to apply any surpluses<br />
derived from the Thermal Reserve to other<br />
reserves administered by the <strong>Council</strong>. The<br />
<strong>Council</strong> actively uses these surpluses to fund<br />
the costs relating to other <strong>District</strong> Reserves,<br />
Cemeteries, Public Toilets, and as the <strong>District</strong><br />
Library has been built on a Reserve, the costs<br />
associated with the Library function is also<br />
subsidised by the surpluses from the Thermal<br />
Reserve.<br />
- The pools and spa were expanded and<br />
improved in a major upgrade in 2010. This<br />
was funded by way of internal loan finance,<br />
as per <strong>Council</strong>’s Internal Financing Policy.<br />
The interest costs incurred by the Hanmer<br />
Springs Thermal Pools and Spa creates<br />
a distinct flow of income that is derived<br />
from the use of the funds that the <strong>Council</strong><br />
is investing, rather than from the use of the<br />
Recreation Reserve.<br />
As a result, we now have two distinct streams<br />
of income generated from the Pools and Spa<br />
operation:<br />
- one from internal interest, which the <strong>Council</strong><br />
uses to offset General Rates (in accordance<br />
with the <strong>Council</strong>’s funding policies)<br />
- and the other being on-going surpluses which<br />
are used to fund costs relating the reserves<br />
(as per the provisions of the Reserve Act<br />
1977).<br />
249
www.hurunui.govt.nz<br />
Service<br />
Relevant<br />
<strong>Community</strong><br />
Outcomes<br />
Relevant Issues &<br />
Constraints<br />
Who benefits, and<br />
over what period<br />
Future Funding & Sustainability<br />
Governance<br />
The <strong>Council</strong>’s funding <strong>Council</strong> members The <strong>Council</strong> process Operational Costs:<br />
the Governance are elected by the and advocacy of<br />
function contributes ratepayers; hence ratepayers’ interests<br />
to the <strong>Hurunui</strong> district there is a benefit in benefits the <strong>District</strong> as<br />
being:<br />
terms of transparency a whole.<br />
A desirable and safe and account- ability No significant capital<br />
place to live:<br />
from funding them investment in this area.<br />
distinctly from other<br />
- We have attractive<br />
Benefits of operational<br />
services. There are<br />
well designed<br />
expenditure accrue at<br />
Sustainability:<br />
no significant costs<br />
townships<br />
the time of expenditure.<br />
associated with this<br />
distinction.<br />
- Communities have<br />
access to adequate<br />
health and emergency<br />
services and systems<br />
and resources are<br />
available to meet civil<br />
defence emergencies<br />
- Risks to public<br />
health are identified<br />
and appropriately<br />
managed<br />
The<br />
Local<br />
Government Act and<br />
many other statutes<br />
govern the <strong>Council</strong>’s<br />
democratic process.<br />
These define the<br />
<strong>Council</strong>’s role and<br />
set out the <strong>Council</strong>’s<br />
obligations<br />
Funded from the <strong>District</strong> Rate (known as the Governance<br />
Rate). Information supplied under the Official Information Act<br />
is charged as allowed for under that act.<br />
The elected members’ costs relating to the Hanmer Springs<br />
<strong>Community</strong> Board shall be funded by the Hanmer Springs Ward<br />
Amenities Rate.<br />
This activity benefits communities and contributes to their<br />
wellbeing across all of the four wellness areas.<br />
250
Significance Policy<br />
Introduction<br />
The purpose of this policy is to outline the general approach of<br />
the <strong>Hurunui</strong> <strong>District</strong> <strong>Council</strong> in determining the significance<br />
of proposals and decisions in relation to issues, assets or other<br />
matters. The policy includes determinants (any thresholds,<br />
criteria or procedures) used to assist in assessing the extent<br />
to which issues, proposals, decisions or other matters are<br />
significant. It also includes procedural guidelines designed to<br />
ensure that a proper process is followed and that all compliance<br />
requirements of the Local Government Act 2002 in relation to<br />
decision making will be met by <strong>Council</strong>.<br />
This policy is made up of the following parts:<br />
Legislative Framework<br />
• Legislative requirements<br />
• Definitions<br />
Application of the Policy on Significance<br />
• Determining significance<br />
• Criteria for determining significance<br />
• Significant issues, proposals, decisions and other matters<br />
• Consultation<br />
Strategic Assets<br />
• Introduction<br />
• Schedule of Strategic Assets<br />
Appendices<br />
• Relevant Extracts from the Local Government Act<br />
2002<br />
• Significance Consideration for Inclusion in <strong>Council</strong><br />
Agendas<br />
Legislative Framework<br />
Every local authority is required to have a policy on significance<br />
pursuant to section 90 of the Local Government Act 2002 (LGA).<br />
Adoption and the amendment of this policy must use the<br />
special consultative procedure. A summary of the policy must<br />
be included in the <strong>Long</strong> <strong>Term</strong> <strong>Plan</strong> (the <strong>Hurunui</strong> <strong>Community</strong><br />
<strong>Long</strong> <strong>Term</strong> <strong>Plan</strong>).<br />
Definitions<br />
Section 5 of the LGA defines significance, significant and<br />
strategic asset as follows:<br />
<strong>Hurunui</strong> <strong>Community</strong> <strong>Long</strong> <strong>Term</strong> <strong>Plan</strong> <strong>2012</strong> - <strong>2022</strong><br />
Significance, in relation to any issue, proposal, decision, or other<br />
matter that concerns or is before a local authority, means the<br />
degree of importance of the issue, proposal, decision, or matter,<br />
as assessed by the local authority, in terms of its likely impact<br />
on, and likely consequences for:<br />
(a) the current and future social, economic,<br />
environmental or cultural wellbeing of the <strong>District</strong> or<br />
region;<br />
(b) any persons who are likely to be particularly<br />
affected by, or interested in the issue, proposal, decision or<br />
matter;<br />
(c) the capacity of the local authority to perform its<br />
role, and the financial and other costs of doing so.<br />
Significant, in relation to any issue, proposal, decision, or any<br />
other matter means that the issue, proposal, decision, or other<br />
matter has a high degree of significance.<br />
Strategic Asset, in relation to the assets held by a local authority<br />
means an asset or group of assets that the local authority needs<br />
to retain if the local authority is to maintain the local authority’s<br />
capacity to achieve or promote any outcome that the local<br />
authority determines to be important to the current and future<br />
wellbeing of the community and includes:<br />
(a) any asset or group of assets listed in accordance with<br />
section 90(2) by the local authority; and<br />
(b) any land or building owned by the local authority<br />
and required to maintain the local authority’s capacity to<br />
provide affordable housing as part of its social policy; and<br />
(c) any equity securities held by the local authority in:<br />
(i) a port company within the meaning of the<br />
Port Companies Act 1988<br />
(ii) an airport company within the meaning of the<br />
Airport Authorities Act 1966.<br />
Application of the Policy on Significance<br />
Determining Significance<br />
Each issue, proposal, decision or other matter is considered<br />
by <strong>Council</strong> on a case by case basis to determine:<br />
• whether it is significant, and, if so,<br />
• the degree of significance. The higher the impact or<br />
consequences, costs or implications, the higher the<br />
degree of significance.<br />
251
www.hurunui.govt.nz<br />
The starting point for determining the degree of significance<br />
is to consider:<br />
• the likely impact on or consequences for the wellness of the<br />
community, taking account in relation to current and future<br />
needs (i.e. sustainability) the social, economic, environmental<br />
and cultural wellbeing of the <strong>District</strong>, along with the <strong>District</strong>’s<br />
landscape & outlook, individual and community lifestyle,<br />
education and skills development, heritage & tradition, and<br />
infrastructure.<br />
• the likely impact on or consequences for those<br />
affected or interested.<br />
• the capacity of the <strong>Council</strong> (including financial capacity)<br />
to implement the decision and carry out its normal role.<br />
It is <strong>Council</strong>’s decision as to what “a high degree of significance”<br />
means in each instance.<br />
Criteria for Determining Significance<br />
The significance of a decision will help determine the<br />
appropriate nature, extent and degree of compliance required<br />
with the decision-making process set out in Part 6 of the LGA.<br />
For significant decisions, the <strong>Council</strong> will ensure appropriate<br />
compliance.<br />
The questions set out below should be used by <strong>Council</strong> to<br />
assist in determining the degree of significance of any issue,<br />
proposal, decision or other matter. These questions will also<br />
help with the required level of compliance with sections 77, 78,<br />
80, 81 and 82 of the LGA. (Refer to the appendices.)<br />
Firstly: Does <strong>Council</strong> have sufficient information about the<br />
issue, proposal, decisions or other matter?<br />
If not, then no decision as to the significance of the issue can<br />
be made.<br />
Secondly: If the answer is yes to any of the following questions<br />
then the issue, proposal, decisions or other matter has<br />
significance. The greater the number of ‘yes’ answers, the<br />
greater the degree of significance.<br />
In the opinion of the <strong>Council</strong>, does the issue, proposal, decision<br />
or other matter:<br />
• affect all or a large portion of the community in a farreaching<br />
way?<br />
• have a potential impact or consequence on the affected<br />
persons (being a number of persons) that is substantial?<br />
• have financial implications on the <strong>Council</strong>’s resources<br />
that would be substantial?<br />
• generate (or would be expected to generate) a high<br />
degree of controversy?<br />
• fail to flow logically or consequentially from a decision<br />
in the <strong>Hurunui</strong> <strong>Long</strong> <strong>Term</strong> <strong>Community</strong> <strong>Plan</strong> (including<br />
the ideal of <strong>District</strong> and community wellness)?<br />
Significant Issues, Proposals, Decisions and Other<br />
Matters<br />
Significant issues, proposals, decisions or other matters will be<br />
included in the <strong>Hurunui</strong> <strong>Long</strong> <strong>Term</strong> <strong>Community</strong> <strong>Plan</strong> wherever<br />
possible. Where this is not practical they will be included<br />
wherever possible in the Annual <strong>Plan</strong> produced in the years<br />
between the <strong>Hurunui</strong> <strong>Long</strong> <strong>Term</strong> <strong>Community</strong> <strong>Plan</strong> or where<br />
required by the Act in an amendment to the <strong>Hurunui</strong> <strong>Long</strong> <strong>Term</strong><br />
<strong>Community</strong> <strong>Plan</strong>.<br />
Significant decisions will only be made outside of the above<br />
processes where there are compelling reasons for it not being<br />
practical for them to be included in the <strong>Hurunui</strong> <strong>Long</strong> <strong>Term</strong><br />
<strong>Community</strong> <strong>Plan</strong> or Annual <strong>Plan</strong>.<br />
The <strong>Council</strong> will not proceed with a decision that is deter- mined<br />
to be significant without consideration of a detailed statement<br />
evidencing compliance with sections 77, 78, 80,81 and 82 of the<br />
LGA.<br />
Other implications of significance under the LGA are:<br />
• The <strong>Council</strong> must use the special consultative<br />
procedure (SCP) when considering a proposal to alter<br />
the mode (as set out in LGA section 88(1-2)) by which<br />
a significant activity is undertaken.<br />
• If an option identified in the decision-making process<br />
involves a significant decision in relation to land or a<br />
body of water, the local authority must take into<br />
account the relationship of Mäori and their culture and<br />
traditions with their ancestral land, water, etc.<br />
• The <strong>Council</strong> must not lose control of, sell or dispose<br />
of ‘significant infrastructure’ necessary for providing<br />
water services.<br />
Consultation<br />
The significance of a matter will guide the <strong>Council</strong>’s decisions<br />
concerning the extent and nature of the consultation to be<br />
undertaken with the persons likely to be affected or interested<br />
in the decision or matter as set out in section 82 of the LGA.<br />
In determining what is appropriate, the <strong>Council</strong> must have<br />
regard to various matters including its likely impact from the<br />
perspective of the persons who will or may be affected by the<br />
decision. The degree of significance will help decide whether<br />
a special round of consultation is necessary, or whether it is<br />
sufficient to rely on information already gathered and held by<br />
the <strong>Council</strong>. The degree of compliance and associated cost<br />
252
<strong>Hurunui</strong> <strong>Community</strong> <strong>Long</strong> <strong>Term</strong> <strong>Plan</strong> <strong>2012</strong> - <strong>2022</strong><br />
involved when making a judgment about significance of a<br />
particular decision also needs to be considered.<br />
Procedures<br />
Every agenda will include a statement of “Significance<br />
Consideration” which will include the questions which<br />
determine the level of significance. (Refer to the appendices.)<br />
Every report to the <strong>Council</strong> must include a statement indicating<br />
that the issue of significance has been considered, and including a<br />
recommendation where necessary.<br />
When the <strong>Council</strong> is considering the significance of an issue,<br />
proposal, decision or other matter, in the event one or more<br />
elected members consider it to be significant, but are in the<br />
minority, the <strong>Council</strong> will:<br />
(a)<br />
(b)<br />
Reconsider the significance questions, and/or;<br />
Consider whether a view should be sought from<br />
the relevant Ward if appropriate to do so.<br />
If a decision to be made is considered to be significant, the<br />
report will also include a statement addressing what has been<br />
done to ensure compliance with sections 77, 78, 80, 81 and 82 of<br />
the LGA as applicable.<br />
Strategic Assets<br />
Introduction<br />
The <strong>Council</strong> is required pursuant to section 90(2) of the<br />
LGA, to list all strategic assets as defined in section 5 of the LGA<br />
and set out under the ‘Legislative Framework’ of this policy. The<br />
schedule of the strategic assets set out on the next page is not<br />
exhaustive but includes those which are considered significant in<br />
ensuring the <strong>Council</strong>’s capacity to achieve or promote important<br />
outcomes.<br />
It is important to note that the <strong>Council</strong> manages a number of<br />
strategic assets as a whole. This is because these asset classes<br />
as a whole, deliver the service. Strategic decisions in these<br />
areas, therefore only concern the whole asset class and not<br />
individual components, unless those components substantially<br />
affect the ability of the <strong>Council</strong> to deliver the service. It is the<br />
principle of the provision of the services that makes these asset<br />
groups strategic, not the individual roads, individual toilet blocks,<br />
individual halls, etc.<br />
253
www.hurunui.govt.nz<br />
Appendix 1: Schedule of Strategic Assets<br />
Activity or group of<br />
activities<br />
Investments<br />
Asset<br />
Equity in Transwaste Limited<br />
Economic<br />
(district<br />
growth)<br />
√<br />
Strategic issues<br />
Social<br />
(quality of life) Cultural Environment<br />
The <strong>Council</strong> Forestry estates as a whole<br />
√<br />
Water Supply<br />
Sewerage<br />
Storm Water and<br />
Drainage<br />
Roads and Footpaths<br />
<strong>Community</strong> Services<br />
and Facilities<br />
Environment and Safety<br />
Hanmer Springs Thermal<br />
Pools and Spa<br />
The water supply network as a whole including<br />
reservoirs, treatment plants, pump stations and<br />
reticulation<br />
√ √ √<br />
The wastewater collection, treatment and<br />
disposal system as a whole including the sewers, √ √ √ √<br />
pump stations and the treatment works<br />
The land drainage system as a whole including<br />
stormwater pipe network, the open river<br />
system, waterways, wetlands and retention<br />
√ √ √ √<br />
basins<br />
The <strong>Hurunui</strong> <strong>District</strong> roading network as a<br />
whole<br />
√ √ √<br />
The Library network as a whole including the<br />
<strong>District</strong> Library and the Communities Libraries<br />
√ √ √<br />
The reserves lands as a whole including land<br />
held under the Reserves Act and land used<br />
for parks, domains, village greens, cemeteries,<br />
√ √ √ √<br />
sports fields and recreational areas<br />
The lands and buildings as a whole used for the<br />
administration of the <strong>District</strong><br />
√<br />
The lands and buildings as a whole owned by<br />
the <strong>Council</strong> for its pensioner housing provision<br />
√ √<br />
The lands and buildings comprising community<br />
halls<br />
√ √<br />
The land and buildings as a whole owned by<br />
the <strong>Council</strong> to support primary health care √ √<br />
availability<br />
The <strong>Hurunui</strong> solid waste network as a whole<br />
including transfer stations<br />
√ √ √<br />
The lands, buildings and commercial operations<br />
as a whole on Hanmer Springs Thermal Reserve √ √ √<br />
254
<strong>Hurunui</strong> <strong>Community</strong> <strong>Long</strong> <strong>Term</strong> <strong>Plan</strong> <strong>2012</strong> - <strong>2022</strong><br />
Appendix 2: Relevant Extracts From the Local Government Act 2002<br />
S 77 Requirements in Relation to Decisions:<br />
(1) A local Authority must, in the course of the decisionmaking<br />
process:<br />
(a) seek to identify all reasonably practicable options for<br />
the achievement of the objective of a decision; and<br />
(b)<br />
assess those options by considering:<br />
(i) the benefits and costs of each option in<br />
terms of the present and future social, economic,<br />
environmental, and cultural wellbeing of the district<br />
or region; and<br />
(ii) the extent to which community out- comes<br />
would be promoted or achieved in an integrated and<br />
efficient manner by each option; and<br />
(iii) the impact of each option on the local<br />
authority’s capacity to meet present and future needs<br />
in relation to any statutory responsibility of the local<br />
authority; and<br />
(iv) any other matters that, in the opinion of<br />
the local authority, are relevant; and<br />
(c) if any of the options identified under paragraph (a)<br />
involves a significant decision in relation to land or a body<br />
of water, take into account the relationship of Mäori and<br />
their culture and traditions with their ancestral land,<br />
water, sites, waahi tapu, valued flora and fauna, and other<br />
taonga.<br />
(2) This section is subject to section 79.<br />
S 78 <strong>Community</strong> views in relation to decisions:<br />
(1) A local authority must, in the course of its decisionmaking<br />
process in relation to a matter, give consideration to the<br />
views and preferences of persons likely to be affected by, or to<br />
have an interest in, the matter.<br />
(2) That consideration must be given at:<br />
(a) the stage at which the problems and objectives related<br />
to the matter is defined;<br />
(b) the stage at which the options that may be reasonably<br />
practicable options of achieving an objective are identified;<br />
(c) the stage at which reasonably practicable options are<br />
assessed and proposals developed;<br />
(d) the stage at which proposals of the kind described in<br />
paragraph (c) are adopted;<br />
(3) A local authority is not required by this section alone<br />
to undertake any consultation process or procedure.<br />
(4) This section is subject to section 79.<br />
S 80 Identification of inconsistent decisions:<br />
(1) If a decision of a local authority is significantly<br />
inconsistent with, or is anticipated to have con- sequences that<br />
will be significantly inconsistent with, any policy adopted by the<br />
local authority or any plan required by this Act or any other<br />
enactment, the local authority must, when making the decision,<br />
clearly identify:<br />
(a) the inconsistency; and<br />
(b) the reasons for the inconsistency;<br />
and<br />
(c) any intention of the local authority to amend the<br />
policy or plan to accommodate the decision.<br />
(2) Subsection (1) does not derogate from any other<br />
provision of this Act or of any other enactment.<br />
S 81 Contributions to decision-making processes by<br />
Mäori:<br />
(1) A local authority must:<br />
(a) establish and maintain processes to provide<br />
opportunities for Mäori to contribute to the decisionmaking<br />
processes of the local authority; and<br />
(b) consider ways in which it may foster the development<br />
of Mäori capacity to contribute to the decision-making<br />
processes of the local authority; and<br />
(c) provide relevant information to Mäori for the purposes<br />
of paragraphs (a) and (b).<br />
(2) A local authority, in exercising its responsibility to<br />
make judgments about the manner in which subsection (1) is to<br />
be complied with, must have regard to:<br />
(a) the role of the local authority, as set out in section 11;<br />
and<br />
(b) such other matters as the local authority considers on<br />
reasonable grounds to be relevant to those judgments.<br />
255
www.hurunui.govt.nz<br />
S 82 Principles of consultation:<br />
(1) Consultation that a local authority undertakes in<br />
relation to any decision or other matter must be undertaken,<br />
subject to subsections (3) to (5), in accordance with the following<br />
principles:<br />
(a) that persons who will or may be affected by, or have<br />
an interest in, the decision or matter should be provided<br />
by the local authority with reasonable access to relevant<br />
information in a manner and format that is appropriate to<br />
the preferences and needs of those persons<br />
(b) that persons who will or may be affected by, or have an<br />
interest in, the decision or matter should be encouraged<br />
by the local authority to present their views to the local<br />
authority<br />
(c) that persons who are invited or encouraged to present<br />
their views to the local authority should be given clear<br />
information by the local authority concerning the purpose<br />
of the consultation and the scope of the decisions to be<br />
taken following the consideration of views presented<br />
(d) that persons who wish to have their views on the<br />
decision or matter considered by the local authority<br />
should be provided by the local authority with a reasonable<br />
opportunity to present those views to the local authority in<br />
a manner and format that is appropriate to the preferences<br />
and needs of those persons<br />
(e) that the views presented to the local authority should<br />
be received by the local authority with an open mind and<br />
should be given by the local authority, in making a decision,<br />
due consideration<br />
(f) that persons who present views to the local authority<br />
should be provided by the local authority with information<br />
concerning both the relevant decisions and the reasons for<br />
those decisions.<br />
(2) A local authority must ensure that it has in place<br />
processes for consulting with Mäori in accordance with<br />
subsection (1).<br />
(3) The principles set out in subsection (1) are, subject to<br />
subsections (4) and (5), to be observed by a local authority in<br />
such manner as the local authority considers, in its discretion, to<br />
be appropriate in any particular instance.<br />
(4) A local authority must, in exercising its discretion<br />
under subsection (3), have regard to:<br />
(a) the requirements of section 78; and<br />
(b) the extent to which the current views and preferences<br />
of persons who will or may be affected by, or have an<br />
interest in, the decision or matter are known to the local<br />
authority; and<br />
(c) the nature and significance of the decision or matter,<br />
including its likely impact from the perspective of the<br />
persons who will or may be affected by, or have an interest<br />
in, the decision or matter; and<br />
(d) the provisions of Part I of the Local Government<br />
Official Information and Meetings Act 1987 (which Part,<br />
among other things, sets out the circumstances in which<br />
there is good reason for withholding local authority<br />
information); and<br />
(e) the costs and benefits of any consultation process or<br />
procedure.<br />
(5) Where a local authority is authorised or required by<br />
this Act or any other enactment to undertake consultation in<br />
relation to any decision or matter and the procedure in respect<br />
of that consultation is prescribed by this Act or any other<br />
enactment, such of the provisions of the principles set out in<br />
subsection (1) as are inconsistent with specific requirements<br />
of the procedure so prescribed are not to be observed by the<br />
local authority in respect of that consultation.<br />
S 88 (1-2) Use of special consultative procedure in<br />
relation to change of mode of delivery of significant<br />
activity:<br />
(1) A local authority must use the special consultative<br />
procedure in relation to any proposal for an alteration (of<br />
the kind described in subsection (2)) in the mode by which a<br />
significant activity is undertaken by or on be- half of the local<br />
authority.<br />
(2) The kind of alteration to which subsection (1) refers<br />
is an alteration that involves:<br />
(a) a change from delivery of the activity by the local<br />
authority itself to delivery of the activity by a council<br />
controlled organisation in which the local authority is a<br />
shareholder; or<br />
(b) a change from delivery of the activity by the local<br />
authority itself to delivery of the activity by another<br />
organisation or person; or<br />
(c) a change from delivery of the activity by a council<br />
controlled organisation in which the local authority<br />
is a shareholder to delivery of the activity by another<br />
organisation or person.<br />
256
<strong>Hurunui</strong> <strong>Community</strong> <strong>Long</strong> <strong>Term</strong> <strong>Plan</strong> <strong>2012</strong> - <strong>2022</strong><br />
Appendix 3: Significance Consideration For Inclusion in all <strong>Council</strong> Agendas<br />
The [name of the council committee], in considering each matter,<br />
must be:<br />
a. Satisfied that it has sufficient information about the<br />
practicable options and their benefits, costs and impacts,<br />
bearing in mind the significance of the decisions<br />
b. Satisfied that it knows enough about and will give<br />
adequate consideration to the views and preferences<br />
of affected and interested parties bearing in mind the<br />
significance of the decisions to be made<br />
Questions<br />
a. Does the <strong>Council</strong> have sufficient information about<br />
the issue, proposal, decisions or other matter?<br />
b. Does the issue, proposal, decision or other matter:<br />
Evaluation<br />
• affect all or a large portion of the community<br />
in a far-reaching way?<br />
• have a potential impact or consequence on<br />
the affected persons (being a number of persons)<br />
that is substantial?<br />
• have financial implications on the <strong>Council</strong>’s<br />
resources that would be substantial?<br />
• generate (or would be expected to generate)<br />
a high degree of controversy?<br />
• fail to flow logically or consequentially from<br />
a decision in the <strong>Hurunui</strong> <strong>Long</strong> <strong>Term</strong> <strong>Community</strong><br />
<strong>Plan</strong> (including the ideal of <strong>District</strong> and community<br />
wellness)?<br />
<strong>Council</strong> officers preparing these reports will have regard to<br />
the <strong>Council</strong>’s policy on significance. <strong>Council</strong>, Committee and<br />
<strong>Community</strong> Board members will make the final assessment on<br />
whether the subject under consideration is to be regarded<br />
as being significant or not. Unless the <strong>Council</strong>, a Committee<br />
or the <strong>Community</strong> Board explicitly determines that the subject<br />
under consideration is to be deemed significant then the<br />
subject will be deemed as not being significant.<br />
257
www.hurunui.govt.nz<br />
Treasury Risk Management Policy<br />
The definition and recognition of interest rate, liquidity, funding,<br />
investment, counterparty credit, market, operational and<br />
legal risk of <strong>Council</strong> will be as detailed below and applies to<br />
both the Liability Management policy and Investment policy.<br />
Interest Rate Risk<br />
Risk Recognition<br />
Interest rate risk is the risk that funding costs (due to adverse<br />
movements in market interest rates) will materially exceed or<br />
fall short of projections included in the LTCCP and Annual <strong>Plan</strong><br />
so as to adversely impact revenue projections, cost control and<br />
capital investment decisions/returns/and feasibilities.<br />
The primary objective of interest rate risk management is to<br />
reduce uncertainty relating to interest rate movements through<br />
fixing/hedging of funding costs.<br />
Approved Financial Instruments<br />
Dealing in interest rate products must be limited to financial<br />
instruments approved by the <strong>Council</strong>.<br />
Category<br />
Cash management<br />
and<br />
borrowing<br />
Investments<br />
Interest rate risk<br />
management<br />
Instrument<br />
Bank overdraft<br />
Committed cash advance and bank accepted bill facilities<br />
(short term and long term loan facilities)<br />
Uncommitted money market facilities<br />
Retail and wholesale Bond and Floating Rate Note (FRN)<br />
issuance<br />
Commercial paper (CP)<br />
Short term bank deposits<br />
Bank certificates of deposit (RCDs)<br />
Treasury bills<br />
NZ Government, Local Authority bonds and FRNs<br />
(secured/senior)<br />
LGFA borrower notes / CP / bills / bonds/ FRNs (floating<br />
rate notes)<br />
Local Authority promissory notes, Commercial paper<br />
(secured/senior)<br />
Forward rate agreements (“FRAs”) on:<br />
Bank bills<br />
Government bonds<br />
Interest rate swaps including:<br />
Forward start swaps (start date
<strong>Hurunui</strong> <strong>Community</strong> <strong>Long</strong> <strong>Term</strong> <strong>Plan</strong> <strong>2012</strong> - <strong>2022</strong><br />
During the term of the option, only the sold side of the<br />
collar can be closed out (i.e. repurchased) otherwise,<br />
both sides must be closed simultaneously. The sold<br />
option leg of the collar structure must not have a strike<br />
rate “in-the-money”.<br />
• Purchased borrower swap options mature within<br />
12 months.<br />
• Interest rate options with a maturity date beyond 12<br />
months that have a strike rate (exercise rate) higher<br />
than 2.00% above the appropriate swap rate, cannot<br />
be counted as part of the fixed rate cover percentage<br />
calculation.<br />
• Forward start period on swaps and collar strategies to<br />
be no more than 24 months, and the underlying cap or<br />
swap starts within this period.<br />
Special and General Reserve Funds<br />
Given that <strong>Council</strong> may require funding for capital expenditure<br />
cash shortfalls over the remaining life of the existing special and<br />
general reserve funds, where such funds are deemed necessary<br />
they should be used for internal borrowing purposes when<br />
external borrowing is required. Accordingly <strong>Council</strong> maintains<br />
its funds in short term maturities emphasising counterparty<br />
credit worthiness and liquidity. The interest rate yield achieved<br />
on the funds therefore is a secondary objective.<br />
This will negate counterparty credit risk and any interest rate<br />
repricing risk that occurs when <strong>Council</strong> borrows at a higher<br />
rate compared to the investment rate achieved by Special /<br />
Reserve Funds.<br />
Liquid assets will not be required to be held against special<br />
funds or reserve funds unless such funds are held within a trust<br />
requiring such, instead, <strong>Council</strong> will manage these funds using<br />
internal borrowing facilities.<br />
Foreign Currency<br />
<strong>Hurunui</strong> has minor foreign exchange exposure through the<br />
occasional purchase of foreign exchange denominated services,<br />
plant and equipment. Generally, all significant commitments for<br />
foreign exchange are hedged using foreign exchange contracts,<br />
once expenditure is approved. Both spot and forward foreign<br />
exchange contracts can be used by <strong>Hurunui</strong>. <strong>Council</strong> shall not<br />
borrow or enter into incidental arrangements, within or outside<br />
New Zealand, in currency other than New Zealand currency.<br />
Liquidity Risk/Funding Risk<br />
Risk Recognition<br />
Cash flow deficits in various future periods based on long<br />
term financial forecasts are reliant on the maturity structure<br />
of cash, financial investments, loans and bank facilities. Liquidity<br />
risk management focuses on the ability to access committed<br />
funding at that future time to fund the gaps. Funding risk<br />
management centres on the ability to re-finance or raise new<br />
debt at a future time at the same or more favourable pricing<br />
(fees and borrowing margins) and maturity terms of existing<br />
loans and facilities.<br />
The management of <strong>Council</strong>’s funding risks is important as<br />
several risk factors can arise to cause an adverse movement<br />
in borrowing margins, term availability and general flexibility<br />
including:<br />
• Local Government risk is priced to a higher fee and<br />
margin level;<br />
• <strong>Council</strong>’s own credit standing or financial<br />
strength as a borrower deteriorates due to financial,<br />
regulatory or other reasons;<br />
• A large individual lender to <strong>Council</strong> experiences their<br />
own financial/exposure difficulties resulting in <strong>Council</strong><br />
not being able to manage their debt portfolio as<br />
optimally as desired;<br />
• New Zealand investment community experiences a<br />
substantial “over supply” of <strong>Council</strong> investment assets;<br />
A key factor of funding risk management is to spread and<br />
control the risk to reduce the concentration of risk at one<br />
point in time so that if any of the above events occur, the overall<br />
borrowing cost is not unnecessarily increased and desired<br />
maturity profile compromised due to market conditions.<br />
Liquidity/Funding Risk Control Limits<br />
Alternative funding mechanisms such as leasing should be<br />
evaluated with financial analysis in conjunction with traditional<br />
on-balance sheet funding. The evaluation should take into<br />
consideration, ownership, redemption value and effective cost<br />
of funds.<br />
External, term loans and committed debt facilities together with<br />
liquid investments/cash equivalents must be maintained at an<br />
amount of 110% over existing external debt.<br />
The CEO has the discretionary authority to re-finance existing<br />
debt on more favourable terms. Such action is to be reported<br />
and ratified by the <strong>Council</strong> at the earliest opportunity.<br />
<strong>Council</strong> has the ability to pre-fund up to 12 months of forecast<br />
debt requirements including re-financings.<br />
The maturity profile of the total committed funding in respect<br />
to all external debt/loans and committed debt facilities, is to<br />
be controlled by the following system and apply when external<br />
259
www.hurunui.govt.nz<br />
debt exceeds $25 million:<br />
Period Minimum Maximum<br />
0 to 3 years<br />
15%<br />
60%<br />
3 to 5 years<br />
15%<br />
60%<br />
5 years plus<br />
10%<br />
40%<br />
A maturity schedule outside these limits will require specific<br />
<strong>Council</strong> approval.<br />
Counterparty Credit Risk<br />
Counterparty credit risk is the risk of losses (realised<br />
or unrealised) arising from a counterparty defaulting on<br />
a financial instrument where the <strong>Council</strong> is a party. The<br />
credit risk to the <strong>Council</strong> in a default event will be weighted<br />
differently depending on the type of instrument entered into.<br />
Credit risk will be regularly reviewed by the <strong>Council</strong>. Treasury<br />
related transactions would only be entered into with<br />
organisations specifically approved by the <strong>Council</strong>.<br />
Counterparties and limits can only be approved on the basis of<br />
long-term credit ratings (Standard & Poor’s, Fitch or Moody’s)<br />
being A+ and above or short term rating of A-1 or above.<br />
Limits should be spread amongst a number of counterparties to<br />
avoid concentrations of credit exposure. See Matrix Guide.<br />
In determining the usage of the previous gross limits, the<br />
following product weightings will be used:<br />
• Investments (e.g. Bank Deposits) – Transaction Notional<br />
x Weighting 100%.(unless a legal right of set-off over<br />
corresponding borrowings exit whereupon a 0%<br />
weighting may apply)<br />
• Interest Rate Risk Management (e.g. swaps, FRAs) –<br />
Transaction Notional x Maturity (years) x 3%.<br />
• Foreign Exchange – Transactional principal amount x<br />
the square root of the Maturity (years) x 15%<br />
Each transaction should be entered into a treasury spreadsheet<br />
and a quarterly report prepared to show assessed counterparty<br />
actual exposure versus limits. Individual counterparty limits are<br />
kept in a spreadsheet by management and updated on a day to<br />
day basis. Credit ratings should be reviewed by the MFS on an<br />
ongoing basis and in the event of material credit downgrades;<br />
this should be immediately reported to the CEO and assessed<br />
against exposure limits. Counterparties exceeding limits should<br />
be reported to the <strong>Council</strong>.<br />
Investments are normally held to maturity date. Where<br />
investments are liquidated before legal maturity date, approval<br />
is obtained from the CEO.<br />
Matrix Guide<br />
Counterparty/Issuer<br />
Minimum long term / short<br />
term credit rating – stated<br />
and possible<br />
Investments maximum per<br />
counterparty<br />
($m)<br />
Interest rate risk management<br />
instrument maximum per<br />
counterparty ($m)<br />
Total maximum per<br />
counterparty<br />
($m)<br />
NZ Government N/A unlimited none Unlimited<br />
Local Government Funding<br />
Agency GFA<br />
N/A Unlimited N/A Unlimited<br />
NZD Registered<br />
Supranationals<br />
AAA 10.0 none 10.0<br />
NZ Registered Bank [name] A+/ A-1 10.0 10.0 20.0<br />
Local Government Stock/<br />
Bonds/ FRN/ CP<br />
A+/ A-1 (if rated)<br />
2.0<br />
none 5.0<br />
* Subject to a maximum exposure no greater than 10% of the portfolio being invested in Local Government debt at any one point in time. The maximum<br />
portfolio exposure limit does not apply to the LGFA.<br />
This summary list will be expanded on a counterparty named basis which will be authorised by the CEO<br />
260
<strong>Hurunui</strong> <strong>Community</strong> <strong>Long</strong> <strong>Term</strong> <strong>Plan</strong> <strong>2012</strong> - <strong>2022</strong><br />
Risk Management<br />
To avoid undue concentration of exposures, financial instruments<br />
should be used with as wide a range of approved counterparties<br />
as possible. Maturities should be well spread. The approval<br />
process must take into account the liquidity of the market the<br />
instrument is traded in and repriced from.<br />
Operational Risk<br />
• Operational risk is the risk of loss as a result of human<br />
error (or fraud), system failures and inadequate<br />
procedures and controls.<br />
• Operational risk is very relevant when dealing with<br />
financial instruments given that:<br />
• Financial instruments may not be fully understood<br />
• Too much reliance is often placed on the specialised<br />
skills of one or two people<br />
Agreements<br />
Financial instruments can only be entered into with banks<br />
that have in place an executed ISDA Master Agreement<br />
with <strong>Council</strong>.<br />
<strong>Council</strong>’s internal/appointed legal counsel must sign off on<br />
all documentation for new loan borrowings, re-financings<br />
and investment structures.<br />
Financial Covenants and Other Obligations<br />
<strong>Council</strong> must not enter into any transactions where it would<br />
cause a breach of financial covenants under existing contractual<br />
arrangements.<br />
<strong>Council</strong> must comply with all obligations and reporting<br />
requirements under existing funding facilities and legislative<br />
requirements.<br />
• Most treasury instruments are executed over the<br />
phone<br />
• Operational risk is minimised through the adoption<br />
of all requirements outlined in the full Treasury Risk<br />
Management Policy, which include:<br />
Legal Risk<br />
• Dealing Authorities and Limits<br />
• Segregation of Duties<br />
• Reporting procedures, including records,<br />
confirmations and reconciliations<br />
• Organisational Controls<br />
Legal and regulatory risks relate to the unenforceability of a<br />
transaction due to an organisation not having the legal capacity<br />
or power to enter into the transaction usually because of<br />
prohibitions contained in legislation. While legal risks are more<br />
relevant for banks, <strong>Hurunui</strong> may be exposed to such risks.<br />
<strong>Hurunui</strong> will seek to minimise this risk by adopting policy<br />
regarding:<br />
• The use of standing dealing and settlement instructions<br />
(including bank accounts, authorised persons, standard<br />
deal confirmations, contacts for disputed transactions)<br />
to be sent to counterparties.<br />
• The matching of third party confirmations and<br />
the immediate follow-up of anomalies.<br />
• The use of expert advice.<br />
261
www.hurunui.govt.nz<br />
Internal Financing Policy<br />
Introduction<br />
<strong>Council</strong> has developed a system of internal financing for various<br />
activities within the organisation. The system is designed to<br />
provide funding for communities to meet the cost of capital<br />
expenditure rather than setting its rates at a level to cover the<br />
entire cost in the year that it is incurred. The system allows<br />
communities to spread the cost of such capital expenditure<br />
over a longer period than just one year.<br />
The system is used instead of the <strong>Council</strong> specifically setting its<br />
rates to cover the cost of depreciation on some of its assets<br />
(notably Water, Sewer, Stormwater and <strong>Community</strong> Facilities),<br />
which is generally required under the Local Government Act<br />
2002.<br />
The internal financing system is applicable those activities that<br />
are funded by a Targeted Rate, which requires the <strong>Council</strong> to<br />
ensure that the funds generated from rates are only applied to<br />
that activity, or there is reasons to separately account for an<br />
activity. As a result, the internal financing system is applied to<br />
the following:<br />
• Ward Amenities<br />
• Rural Fire Control<br />
• Animal Control<br />
• Household Refuse Collection<br />
• Water Supplies<br />
• Sewerage Schemes<br />
• Stormwater and Drainage Schemes<br />
• Medical Centres<br />
• Foreshore Protection Schemes<br />
• Special Funds including Development Contribution<br />
Funds<br />
• Hanmer Springs Thermal Reserve (with regards to the<br />
debt resulting from expansion work)<br />
Mechanics of the System<br />
Each activity has a capital balance, which in essence is an individual<br />
bank account for that activity. Receipts from that activity –<br />
Rates, Fees & Charges, and Development Contributions etc.<br />
– are deposited into that account. Payments for that activity<br />
– Employment Costs, Direct Operating Expenditure, <strong>Council</strong><br />
Overheads etc. and Capital Expenditure – are withdrawn from<br />
that account. The result is that at any stage, that bank account<br />
may be in funds or it could be overdrawn.<br />
Like most bank accounts, if there are funds in the account from<br />
that activity, then the <strong>Council</strong> will pay interest to that activity.<br />
Conversely, if the bank account is overdrawn, then that activity<br />
will be charged interest.<br />
Debt Repayment<br />
There is also a need for those activities whose bank accounts<br />
are overdrawn to make provision to get out of overdraft. This<br />
is most likely done by setting rates at a level to not only pay<br />
the annual operating costs and interest charge, but to also fund<br />
additional amounts that will offset the overdraft. The <strong>Council</strong>’s<br />
policy is that debt should be repaid over 20 years (or such term<br />
<strong>Council</strong> deems appropriate in particular circumstances) and as<br />
a result, communities are required to fund at least 5% of the<br />
opening balance of their loan as repayments and set the rates<br />
accordingly.<br />
Increasing the Account<br />
As a way of increasing the account so communities are in<br />
a position to cover some or all of the cost of major capital<br />
projects in the future, the communities are encouraged to<br />
continue setting its rates at a level to cover the annual operating<br />
cost but also additional amounts (as a deemed affordable) which<br />
will increase the balance of the account. As a result, there will be<br />
a number of activities whose bank accounts will increase over<br />
time, with the knowledge that those funds will be utilised on<br />
capital expenditure.<br />
Interest Component<br />
To ensure consistency throughout the entire organisation, with<br />
the exception of the Hanmer Springs Thermal Reserve, the<br />
interest rates have been set as follows:<br />
• Interest rate on Overdrawn Activity Accounts is charged<br />
interest at 100 basis points (1%) above the interest rate<br />
that <strong>Council</strong> is charged for any external debt.<br />
• Interest rate on Activity Accounts in funds received<br />
interest at the interest rate that the <strong>Council</strong> receives<br />
on its call accounts.<br />
262
<strong>Hurunui</strong> <strong>Community</strong> <strong>Long</strong> <strong>Term</strong> <strong>Plan</strong> <strong>2012</strong> - <strong>2022</strong><br />
Hanmer Springs Thermal Reserve<br />
The Hanmer Springs Thermal Reserve is an exception to the<br />
Internal Financing Policy.<br />
As any development that the Hanmer Springs Thermal Reserve<br />
undertakes is of a commercial nature, there is an increased level<br />
of risk involved and as such, the interest rate charged for any<br />
debt drawn down by the Thermal Reserve attracts an interest<br />
rate of 250 basis points (2.5%) above the interest rate that<br />
<strong>Council</strong> is charged for any external debt.<br />
It is intended that any debt funding provided to the<br />
Hanmer Springs Thermal Reserve crystallises with the Thermal<br />
Reserve not required to actively repay debt unless required<br />
to by <strong>Council</strong>. This will result in the <strong>Council</strong> holding both a<br />
debt investment as well as an equity investment in the Thermal<br />
Reserve.<br />
Use of Interest<br />
All interest derived from internal financing is accumulated by<br />
the <strong>Council</strong>’s treasury function. Costs associated with treasury,<br />
such as any external interest, external advice, and <strong>Council</strong><br />
overheads, are paid from the interest derived with the overall<br />
surplus from the treasury function used actively to offset the<br />
<strong>District</strong> Rate requirement.<br />
263
www.hurunui.govt.nz<br />
Appendices<br />
265 Representatives of our <strong>District</strong><br />
266 Waste Management and<br />
Minimisation <strong>Plan</strong> Summary<br />
268 <strong>Hurunui</strong> Waiau Zone Implimentation<br />
Programme<br />
270 Water and Sanitary Services<br />
Assessment Summary<br />
272 Levels of Service Water and Sewer<br />
275 Rates: Sample Properties<br />
281 Independent Auditor’s Report<br />
264
Representatives of our <strong>District</strong><br />
<strong>Hurunui</strong> <strong>Community</strong> <strong>Long</strong> <strong>Term</strong> <strong>Plan</strong> <strong>2012</strong> - <strong>2022</strong><br />
Mayor Winton Dalley<br />
Mayor<br />
Ph 03 314 8816<br />
mayor@hurunui.govt.nz<br />
PO Box 13<br />
Amberley<br />
Cr Marie Black<br />
<strong>Council</strong>lor Amuri-<strong>Hurunui</strong> Ward<br />
Ph 03 314 4142<br />
marie.black@hurunui.govt.nz<br />
Cr Michael Malthus<br />
Deputy Mayor<br />
<strong>Council</strong>lor Hanmer Springs Ward<br />
Ph 03 315 7757<br />
michael.malthus@hurunui.govt.nz<br />
Cr Jim Harré<br />
<strong>Council</strong>lor Amuri-<strong>Hurunui</strong> Ward<br />
Ph 03 315 6162<br />
jim.harre@hurunui.govt.nz<br />
Cr Ross Little<br />
<strong>Council</strong>lor Amberley Ward<br />
Ph 03 314 5841<br />
ross.little@hurunui.govt.nz<br />
Cr Dick Davison<br />
<strong>Council</strong>lor Amuri-<strong>Hurunui</strong> Ward<br />
Ph 03 315 8015<br />
dick.davison@hurunui.govt.nz<br />
Cr Gary Cooper<br />
<strong>Council</strong>lor Amberley Ward<br />
Ph 03 314 9229<br />
gary,cooper@hurunui.govt.nz<br />
Cr Russell Black<br />
<strong>Council</strong>lor Glenmark Ward<br />
Ph 03 314 5888<br />
russell.black@hurunui.govt.nz<br />
Cr Judith McKendry<br />
<strong>Council</strong>lor Amberley Ward<br />
Ph 03 314 8308<br />
judith.mckendry@hurunui.govt.nz<br />
Cr Vincent Daly<br />
<strong>Council</strong>lor Cheviot Ward<br />
Ph 03 319 8773<br />
vincent.daly@hurunui.govt.nz<br />
265
www.hurunui.govt.nz<br />
Waste Management and Minimisation <strong>Plan</strong> - Summary<br />
Introduction<br />
Our Waste Management and Minimisation <strong>Plan</strong> describes our<br />
vision for this activity including our objectives, policies and<br />
targets to enable residents, businesses and ratepayers to have<br />
access to an efficient, reliable, safe and cost effective service.<br />
We are committed to working to reduce the levels of waste<br />
disposed of into landfill. We continually review our waste<br />
and recycling services and facilities to ensure effectiveness,<br />
efficiencies and affordability.<br />
The Waste Management and Minimisation <strong>Plan</strong> outlines<br />
objectives that we will focus on over the next six years.<br />
Sometimes changes will be necessary (including potential<br />
contractor changes as these expire during the life of the <strong>Plan</strong>),<br />
but we will ensure that any such changes are consistent with<br />
the <strong>Plan</strong>’s objectives. Please refer to the full <strong>Plan</strong> on our website<br />
for further information.<br />
Under the Waste Minimisation<br />
Act (2008), all <strong>Council</strong>s<br />
are required to<br />
have a Waste<br />
Management<br />
and<br />
Minimisation <strong>Plan</strong> and meet a number of specific requirements<br />
including:<br />
• Having due regard for the waste hierarchy – reduce, reuse,<br />
recycle, recover, treatment and disposal.<br />
• Considering the findings and recommendations of our<br />
most recent waste assessment.<br />
We compiled our Waste Management and Minimisation <strong>Plan</strong><br />
at a time when the management of waste and recycling in the<br />
district has undergone significant change, with the introduction<br />
of the combined model in early 2009 and subsequent contractual<br />
changes the following year. We are working towards the future<br />
with the planned construction of a new transfer station in<br />
Amberley, the reviewing of existing contractual arrangements<br />
and the need to improve efficiencies to ensure effective and<br />
affordable waste management and recycling services are<br />
provided at all times.<br />
Funding<br />
Dual<br />
Refuse and<br />
Recycling<br />
Collection<br />
Transfer<br />
Stations<br />
Some<br />
of the<br />
<strong>Hurunui</strong> <strong>District</strong><br />
<strong>Council</strong>’s<br />
waste management and<br />
minimisation<br />
Glass Recycling<br />
Commercial<br />
Recycling and dry<br />
waste<br />
Recycling<br />
Bins<br />
266
<strong>Hurunui</strong> <strong>Community</strong> <strong>Long</strong> <strong>Term</strong> <strong>Plan</strong> <strong>2012</strong> - <strong>2022</strong><br />
The funding of our waste management and recycling services is<br />
achieved through:<br />
Activities<br />
• Targeted rates<br />
• Uniform Annual Charge<br />
• User charges<br />
• Waste levy reimbursement<br />
The Waste Management and Minimisation <strong>Plan</strong> outlines actions<br />
and activities that will be undertaken during the life of the plan<br />
to provide efficient, effective and affordable waste management<br />
and minimisation services. Many of the activities are business-asusual<br />
and some are new. Some of these are outlined here, but<br />
please refer to the full <strong>Plan</strong> on our website for more information.<br />
Key Issues and Challenges<br />
We face a number of ongoing waste management and<br />
minimisation issues and challenges, such as those listed below:<br />
• A low rating base which covers a wide<br />
geographical area<br />
• An increase in illegal dumping as landfill costs rise<br />
• Market uncertainty for recyclable materials<br />
• The impact of waste related legislation and policy<br />
Increased public awareness programmes including:<br />
• piloting a schools education programme<br />
• supporting the Paper 4 Trees school scheme<br />
• providing recycling public workshops<br />
• developing guidance material for the agriculture<br />
sector<br />
Working with Target Sustainability to undertake waste audits<br />
with local businesses<br />
• Evaluating the introduction of domestic kerbside<br />
glass collection in urban areas<br />
• Evaluating the possibility of introducing dual<br />
refuse/recycling collection in all urban areas<br />
• Considering the use of wheelie bins, plastic<br />
crates and plastic sacks<br />
• Considering the acceptance of commercial waste<br />
in the design of the new Amberley Transfer<br />
Station<br />
• Reviewing transfer station operating hours<br />
• Promoting home composting including<br />
investigating the possibility of providing subsidised<br />
compost bins<br />
• Considering trialling putrescible (food scraps etc)<br />
waste collection in Amberley or Hanmer Springs<br />
• Considering the advantages and disadvantages of<br />
using pre-paid bags for refuse<br />
• Licensing operators collecting or disposing of<br />
waste in the <strong>Hurunui</strong> district and advocating for<br />
regional/nationwide licensing requirements<br />
267
www.hurunui.govt.nz<br />
<strong>Hurunui</strong> Waiau Zone Implementation Programme<br />
Summary<br />
Since July 2010, the <strong>Hurunui</strong> Waiau Zone Committee, a joint<br />
committee of the <strong>Hurunui</strong> <strong>District</strong> <strong>Council</strong> and Environment<br />
Canterbury, has worked collaboratively and undertaken<br />
extensive consultation with, and received submissions from,<br />
Runanga, local communities, interested parties, industry groups,<br />
government and non-government organisations, scientists<br />
and advisory groups to develop the recommendations on<br />
water management presented in this Zone Implementation<br />
Programme (ZIP).<br />
The Zone Committee and this ZIP are part of implementing<br />
the Canterbury Water Management Strategy (CWMS) in<br />
the <strong>Hurunui</strong> Waiau Zone. The CWMS sets as its first order<br />
priorities: environment, customary use, community supplies<br />
and stock water; with second order priorities as irrigation,<br />
renewable electricity generation, recreation and amenity. The<br />
Zone Committee recognizes that clean drinking water, land use,<br />
water quality and quantity, environmental flows and allocation<br />
for the rivers, biodiversity protection and enhancement,<br />
irrigation, hydropower development and water storage options,<br />
and the principles of kaitiakitanga are all (intimately) interrelated<br />
and must be considered as a whole rather than in isolation. This<br />
ZIP recommends actions and approaches for collaborative<br />
and integrated water management solutions to achieve the<br />
CWMS vision “To enable present and future generations<br />
to gain the greatest economic, recreational and cultural<br />
benefits from our water resources within an environmentally<br />
sustainable framework”. In accordance with the CWMS the<br />
Zone Committee has arrived at its recommendations through<br />
consensus.<br />
The ZIP is a suite of water-management recommendations to<br />
Environment Canterbury, <strong>Hurunui</strong> <strong>District</strong> <strong>Council</strong>, developers<br />
and other parties. It is not a statutory plan under the Resource<br />
Management Act (RMA). However, the Zone Committee<br />
expects the <strong>Hurunui</strong> Waiau Environmental Flow and Allocation<br />
Regional <strong>Plan</strong> (<strong>Hurunui</strong> Waiau Regional <strong>Plan</strong>) to give effect to the<br />
recommendations of the ZIP through an integrated approach to<br />
the development and management of the district’s freshwater<br />
resources. This ZIP represents a ‘snapshot’ of the position the<br />
Committee has reached with regard to recommendations after<br />
receiving and considering over 125 submissions to the Draft<br />
ZIP, together with feedback from meetings and communities of<br />
interest, including public meetings at Amberley, Omihi, Cheviot,<br />
Culverden, Hawarden, Hanmer Springs and Christchurch in<br />
total involving more than 300 people.<br />
The Zone Committee recognizes that the future social<br />
and economic prosperity of the zone is largely dependent<br />
on utilization of its water resources, for agricultural and<br />
horticultural development through the expansion of irrigation,<br />
and tourism activities. The Committee’s vision is that this<br />
can be achieved while maintaining, but striving to enhance,<br />
environmental outcomes in order to achieve a ‘net gain’ for the<br />
water resources and associated ecosystems as well as preserving<br />
cultural and recreational values. This will require effective and<br />
responsible economic and natural resource management of the<br />
land and rivers including the implementation of appropriate<br />
environmental flow regimes in the major rivers and their 4<br />
tributaries, the setting of nutrient load limits in catchments<br />
and the adoption of sustainable best practice audited self<br />
management programmes led by community/user-based land<br />
care groups and industry backed up by a regulatory framework.<br />
The key recommendations in the ZIP are:<br />
• Flow and allocation regimes must be set for the rivers<br />
and their tributaries to ensure the life supporting<br />
character of the rivers are maintained:<br />
• For Waiau River minimum flows can remain<br />
unchanged provided current water use remains<br />
unchanged and in-river values do not deteriorate;<br />
• For <strong>Hurunui</strong> River the Variation 8 minimum flows<br />
and A Block allocation are appropriate with minor<br />
changes.<br />
• Nutrient load limits must be set for the major rivers<br />
and their tributaries:<br />
• The water quality for <strong>Hurunui</strong> River at State<br />
Highway One should be at or about the same or<br />
better standard as present;<br />
• Current land users will need to improve nutrient<br />
management to allow new irrigation development to<br />
occur;<br />
• New irrigation development must have good nutrient<br />
management;<br />
• Implementing load limits should take a tributary- and<br />
land/water user-based approach.<br />
• More widespread monitoring of the major rivers and<br />
their tributaries and hapua needs to be established to<br />
ensure water quality standards are being achieved.<br />
• Implementation of sustainable best practice audited self<br />
management programmes, particularly for water quality,<br />
led by community/land user based land care groups<br />
and industry is essential (and has commenced) and be<br />
backed up by a regulatory framework.<br />
• Provision of ‘more water’ for irrigation and<br />
268
<strong>Hurunui</strong> <strong>Community</strong> <strong>Long</strong> <strong>Term</strong> <strong>Plan</strong> <strong>2012</strong> - <strong>2022</strong><br />
augmentation of river flows (in Waipara River),<br />
preferably with associated hydropower development,<br />
but not for hydropower development on its own, will<br />
come from an integrated use of run-of-river takes and<br />
off-mainstem storage:<br />
• The Waitohi River catchment is the preferred location<br />
for major water storage in <strong>Hurunui</strong> catchment;<br />
• Water storage options in Lake Sumner or the <strong>Hurunui</strong><br />
South Branch should be deferred until a Waitohi storage<br />
option has been determined to not be viable or for two<br />
years, whichever is shorter;<br />
• Isolated Hill appears to be one of the few viable options<br />
for off-river major water storage in Waiau River and is<br />
supported by the Zone Committee.<br />
• Immediate Steps Biodiversity funding over the next<br />
four years will be used in a more strategic manner<br />
for projects that optimize freshwater biodiversity<br />
outcomes and community involvement. Five priority<br />
areas are being considered:<br />
• North Pegasus Bay coastal wetlands;<br />
• Lower Waitohi wetlands;<br />
• Conway Flat to Waiau River mouth;<br />
• Braided River ecosystems;<br />
• Sumner lakes complex.<br />
Included in the appendices of this ZIP is an assessment of its<br />
coverage of the CWMS Targets and Goals and a list of the<br />
reports and presentations that have been provided to the Zone<br />
Committee. The full <strong>Hurunui</strong> Waiau Zone Implementation<br />
Programme is on our website.<br />
269
www.hurunui.govt.nz<br />
Water and Sanitary Services Assessment Summary<br />
Introduction<br />
We have a statutory responsibility to carry out Water and<br />
Sanitary Assessments under Sections 124-129 of the Local<br />
Government Act [2002]. The first assessments were completed<br />
in November 2004. This set of Assessments updates the 5<br />
year period from December 2004 – May 2010. Some original<br />
<strong>Council</strong> managed water and wastewater networks assessments<br />
remain current in that no changes of material significance have<br />
occurred.<br />
Scope of the Assessment<br />
Given our resources available, updated assessments have only<br />
been prepared for water supply networks that fit in with the<br />
following criteria. Networks are then grouped into three<br />
categories, with regard to how they are affected by the criteria.<br />
All wastewater network assessments have been completed. The<br />
criteria includes water supply networks that have:<br />
• Undergone considerable growth or change of use<br />
• Incorporated upgrades to supply, treatment disposal or<br />
have new works<br />
• Recently been topical in the public arena or are<br />
politically sensitive<br />
• Transgressed significantly in public health or<br />
environmental impact<br />
• New and not covered by the original assessment<br />
• Become subject to new legislation or notably different<br />
consent conditions<br />
Group 1<br />
Water networks having significant capital work/alteration<br />
completed or pending that markedly improve network<br />
capacity, performance, service levels or resource consent<br />
compliance and are shown as full updates.<br />
Presented as full updates covering all matters not detailed<br />
in the original assessments<br />
1. Ashley Main Intake<br />
• new intake bores, relocation of treatment<br />
2. Ashley North Area<br />
• new deep bores and water allocation<br />
3. Amberley Urban Water<br />
• new water sources<br />
4. Hanmer Springs Water<br />
• new water treatment & reservoirs<br />
5. Cheviot Main Intake<br />
• new water treatment<br />
6. Cheviot Urban Area<br />
• new wastewater consent<br />
7. Culverden Water<br />
• new bore & reservoir considerations<br />
Group 2<br />
Water networks affected by current/anticipated<br />
issues or may warrant some improvement/require<br />
works and are shown as brief summaries.<br />
1. Leithfield Beach Water<br />
• bore corrosion and water quality deterioration<br />
2. Waiau Urban Water<br />
• treatment deficiencies & asbestos reservoir roof<br />
3. Upper Waitohi Water<br />
• supply reliability and consumer expectations<br />
Group 3<br />
Water networks that have experienced nil or little change<br />
in demand or operational aspects over the past 5 years or<br />
where consumers are not demanding treatment/disposal<br />
or water source improvements, so are therefore not<br />
included in the June 2010 assessment update.<br />
Water:<br />
1. <strong>Hurunui</strong> Main (<strong>Hurunui</strong>)<br />
2. Lower Waitohi (<strong>Hurunui</strong>)<br />
3. Peaks (<strong>Hurunui</strong>)<br />
4. Kaiwara (Cheviot)<br />
5. Parnassus (Cheviot)<br />
6. Blythe (Cheviot)<br />
7. Balmoral (treated with chlorine)<br />
8. Amuri Plains (treated with uV)<br />
9. Waiau Rural<br />
10. Hawarden-Waikari (treated with uV chlorine back-up)<br />
This approach is considered appropriate with how the LG Act<br />
[2002] is interpreted. It is also considered that the required<br />
Public Health Risk Management <strong>Plan</strong>s [PHRMP] being very<br />
similar in purpose and content, would be better integrated<br />
with future assessments to minimize duplication of effort and<br />
reporting.<br />
As the Assessments and PHRMP documents are key reports on<br />
activities, they sit well with our obligations to maintain Activity<br />
270
<strong>Hurunui</strong> <strong>Community</strong> <strong>Long</strong> <strong>Term</strong> <strong>Plan</strong> <strong>2012</strong> - <strong>2022</strong><br />
Management <strong>Plan</strong>s (AMP), and so the Utilities section will be<br />
incorporating these as part of our network AMP codicils. This<br />
approach is consistent with what other territorial authorities<br />
are doing and is consistent with Audit NZ and Ministry of<br />
Health’s expectations.<br />
Few of our water networks comply with the source or<br />
treatment criteria under the Drinking Water Standards New<br />
Zealand [2005]. Of the 25 intakes, 4 have basic uV treatment<br />
(but are not considered by DWSNZ [2005] as fully effective),<br />
One has advanced uV and six utilize chlorine. Five intakes treat<br />
to correct aesthetic faults. One intake provides for filtration of<br />
suspended solids.<br />
Some communities have further sought and/or secured<br />
improvements in the quality and quantity of their water (Cheviot<br />
Urban area, Ashley Main Intake, North Ashley area, Amberley,<br />
Culverden and Hanmer Springs).<br />
There are seven public wastewater facilities in the district, all are<br />
currently consented and perform reasonably well. Hanmer and<br />
Amberley have undergone significant upgrading for discharge<br />
quality and consent compliance.<br />
We are committed to managing and maintaining public water<br />
and wastewater services. Asset Management <strong>Plan</strong>s for water<br />
and wastewater have been updated (2009/10) with an emphasis<br />
on meeting “core” levels of management.<br />
Future growth and renewal considerations will continue to be<br />
identified by the utilities section and in response to consumer<br />
demand and will be presented in each <strong>Long</strong> <strong>Term</strong> <strong>Plan</strong> process<br />
and updated or highlighted in intervening Annual <strong>Plan</strong>s.<br />
Information on funding, consumer information and assets can<br />
be found in the Asset Management <strong>Plan</strong>/Codicils and is not<br />
repeated in these updates.<br />
The full Water and Sanitary Services Assessment is available on<br />
our website.<br />
271
www.hurunui.govt.nz<br />
Levels of Service Water and Sewer<br />
Network<br />
Water Source and<br />
Treatment<br />
Amberley Deep bore in daily use<br />
all year.<br />
No treatment but<br />
looking to prove secure<br />
groundwater status.<br />
Low supply outage risk<br />
Leithfield Beach Deep bore only. No<br />
water treatment<br />
Moderate risk for<br />
outage<br />
Culverden Deep bore with<br />
shallow bore back-up<br />
and chlorine (if needed<br />
for shallow bore). Low<br />
risk of supply outage<br />
Waiau Shallow river bore with<br />
two pumps. uV with<br />
chlorine introduced<br />
when turbidity climbs<br />
Moderate risk<br />
Waipara Two moderate depth<br />
bores with the older<br />
as back-up. No water<br />
treatment. Moderate<br />
risk of supply outage<br />
Hanmer Springs River intake. Low risk<br />
due to open reservoir<br />
storage. Settling pond,<br />
dose aided filtration, uV<br />
& chlorine back-up<br />
Hawarden<br />
Waikari<br />
Moderate depth river<br />
bore with shallow<br />
gallery back-up. Low<br />
risk<br />
LEVELS OF SERVICE – ON-DEMAND (URBAN) WATER NETWORKS – February 2011<br />
Management Documents and Service<br />
Storage Based on<br />
Demand<br />
Hydraulic<br />
Performance<br />
DWSNZ Grading<br />
Warnings and<br />
Compliance<br />
Fire Fightiing Continuity of Supply<br />
Asset Management <strong>Plan</strong> in place<br />
Approved PHRMP.<br />
Water Assessments done<br />
<strong>Term</strong>s & Conditions Contract<br />
Dedicated operator for network with full back-up<br />
resources<br />
All hours phone access for faults<br />
Volume - 816m3<br />
% average - 26hrs<br />
% peak - 10hrs<br />
Min flow - 15l/min<br />
Min press . 200kpa<br />
Max press - 650kpa<br />
Sources - U<br />
Reticulation - u<br />
Warnings by phone,<br />
mail out and local<br />
advertising<br />
Compliance - No<br />
U/G hydrants<br />
Meets minimum stds of<br />
12.5l/s @250kpa - Yes<br />
Back up generator<br />
Max planned outage 4 hrs. Supply<br />
active for 98.5% of year, excl<br />
disasters and CD emergencies.<br />
Asset Management <strong>Plan</strong> in place<br />
No PHRMP.<br />
Water Assessments done<br />
<strong>Term</strong>s & Conditions Contract<br />
Dedicated operator for network with full back-up<br />
resources<br />
All hours phone access for faults<br />
Volume - 120m3<br />
% average - 13hrs<br />
% peak - 4.5hrs<br />
Min flow - 12l/min<br />
Min press . 100kpa<br />
Max press - 580kpa<br />
Source - U<br />
Reticulation - u<br />
Warnings by phone,<br />
mail out and local<br />
advertising<br />
Compliance - Yes<br />
U/G hydrants<br />
Meets minimum stds of<br />
12.5l/s @250kpa - needs<br />
testing<br />
Back up generator<br />
Max planned outage 4 hrs. Supply<br />
active for 98.5% of year, excl<br />
disasters and CD emergencies.<br />
Asset Management <strong>Plan</strong> in place<br />
No PHRMP.<br />
Water Assessments done<br />
<strong>Term</strong>s & Conditions Contract<br />
Dedicated operator for network with full back-up<br />
resources<br />
All hours phone access for faults<br />
Asset Management <strong>Plan</strong> in place<br />
Approved PHRMP.<br />
Water Assessments done<br />
<strong>Term</strong>s & Conditions Contract<br />
Dedicated operator for network with full back-up<br />
resources<br />
All hours phone access for faults<br />
Asset Management <strong>Plan</strong> in place<br />
PHRMP requires update.<br />
Water Assessments done<br />
<strong>Term</strong>s & Conditions Contract<br />
Dedicated operator for network with full back-up<br />
resources<br />
All hours phone access for faults<br />
Asset Management <strong>Plan</strong> in place<br />
PHRMP requires update.<br />
Water Assessments done<br />
<strong>Term</strong>s & Conditions Contract<br />
Dedicated operator for network with full back-up<br />
resources<br />
All hours phone access for faults<br />
Asset Management <strong>Plan</strong> in place<br />
PHRMP drafted.<br />
Water Assessments done<br />
<strong>Term</strong>s & Conditions Contract<br />
Dedicated operator for network with full back-up<br />
resources<br />
All hours phone access for faults<br />
Volume - 90m3<br />
% average - 6.5hrs<br />
% peak - 3hrs<br />
Volume - 180m3<br />
% average - 17hrs<br />
% peak - 6.5hrs<br />
Volume - 92m3<br />
% average - 19hrs<br />
% peak - 8hrs<br />
Volume - 92m3<br />
% average - 19hrs<br />
% peak - 8hrs<br />
Volume - 35m3<br />
% average - 16hrs<br />
% peak - 3.5hrs<br />
Min flow - 15l/min<br />
Min press . 200kpa<br />
Max press - 500kpa<br />
Min flow - 12l/min<br />
Min press . 300kpa<br />
Max press - 600kpa<br />
Min flow - 12l/min<br />
Min press . 300kpa<br />
Max press - 600kpa<br />
Min flow - 15l/min<br />
Min press . 300kpa<br />
Max press - 600kpa<br />
Min flow - 12l/min<br />
Min press . 200kpa<br />
Max press - 650kpa<br />
Source - U<br />
Reticulation - u<br />
Warnings by phone,<br />
mail out and local<br />
advertising<br />
Compliance - Yes<br />
(Ecoli)<br />
Source - U<br />
Reticulation - u<br />
Warnings by phone,<br />
mail out and local<br />
advertising<br />
Compliance - No<br />
Source - E<br />
Reticulation - e<br />
Warnings by phone,<br />
mail out and local<br />
advertising<br />
Compliance - No<br />
Source - U<br />
Reticulation - u<br />
Warnings by phone,<br />
mail out and local<br />
advertising<br />
Compliance - No<br />
Source - U<br />
Reticulation - u<br />
Warnings by phone,<br />
mail out and local<br />
advertising<br />
Compliance - Yes<br />
(Ecoli)<br />
U/G hydrants<br />
Meets minimum stds of<br />
12.5l/s @250kpa - Yes<br />
U/G hydrants<br />
Meets minimum stds of<br />
12.5l/s @250kpa - needs<br />
testing<br />
U/G hydrants<br />
Meets minimum stds of<br />
12.5l/s @250kpa - needs<br />
testing<br />
U/G hydrants<br />
Meets minimum stds of<br />
12.5l/s @250kpa - Yes<br />
U/G hydrants<br />
Meets minimum stds<br />
of 12.5l/s @250kpa -<br />
needs testing<br />
Back up generator<br />
Max planned outage 4 hrs. Supply<br />
active for 98.5% of year, excl<br />
disasters and CD emergencies.<br />
Max planned outage 4 hrs. Supply<br />
active for 98.5% of year, excl<br />
disasters and CD emergencies.<br />
Max planned outage 4 hrs. Supply<br />
active for 98.5% of year, excl<br />
disasters and CD emergencies.<br />
Gravity plus back-up diesel pump.<br />
Max planned outage 4 hrs. Supply<br />
active for 98.5% of year, excl<br />
disasters and CD emergencies.<br />
Connection for portable<br />
generator. Max planned outage<br />
4 hrs. Supply active for 98.5%<br />
of year, excl disasters and CD<br />
emergencies.<br />
272
<strong>Hurunui</strong> <strong>Community</strong> <strong>Long</strong> <strong>Term</strong> <strong>Plan</strong> <strong>2012</strong> - <strong>2022</strong><br />
Network<br />
Water Source and<br />
Treatment<br />
Ashley Shallow bore field Main<br />
Intake.<br />
Deep bore Racecourse<br />
Rd. Deep bores Kowai<br />
& Smiths Road (both<br />
mothballed).<br />
uV at Main Intake. Ion<br />
exchange Kowai &<br />
Smiths. Sand filtration<br />
Kowai<br />
Waiau Shallow river bore. No<br />
water treatment<br />
Amuri Plains Shallow river plain bore<br />
with uV disinfection<br />
Balmoral Stream weir and river<br />
gallery back-up with<br />
chlorine on both<br />
sources<br />
Cheviot Shallow river plain<br />
bores (3). No water<br />
treatment<br />
<strong>Hurunui</strong> Gallery on #1 & Upper<br />
Waitohi. Shallow bores<br />
on Lower Waitohi &<br />
Peaks. Chlorine on<br />
Upper Waitohi. None<br />
elsewhere<br />
LEVELS OF SERVICE – RESTRICTED (RURAL) WATER NETWORKS – February 2011<br />
Management Documents and Service<br />
Storage Based on<br />
Demand<br />
Hydraulic<br />
Performance<br />
DWSNZ Grading<br />
Warnings and<br />
Compliance<br />
Fire Fightiing Continuity of Supply<br />
Asset Management <strong>Plan</strong> in place<br />
PHRMP requires update.<br />
Water Assessments done<br />
<strong>Term</strong>s & Conditions Contract<br />
Dedicated operator for network with full back-up<br />
resources<br />
All hours phone access for faults<br />
3 days min at<br />
contracted rate of<br />
supply<br />
1800l/day units with<br />
minimum supply<br />
pressure of 200kpa<br />
Source - U<br />
Zone - u<br />
Warnings by phone,<br />
mail out and local<br />
advertising<br />
Compliance - No<br />
U/G hydrants in some<br />
urban areas. Remainder o/<br />
head fillers<br />
4 hours planned and up to 12<br />
unplanned repairs. Emergencies<br />
not included<br />
Asset Management <strong>Plan</strong> in place<br />
No PHRMP.<br />
Water Assessments done<br />
<strong>Term</strong>s & Conditions Contract<br />
Dedicated operator for network with full back-up<br />
resources<br />
All hours phone access for faults<br />
3 days min at<br />
contracted rate of<br />
supply<br />
1800l/day units with<br />
minimum supply<br />
pressure of 200kpa<br />
Source - U<br />
Zone - u<br />
Warnings by phone,<br />
mail out and local<br />
advertising<br />
Compliance - No<br />
O/head fillers 6 hours planned and up to 12<br />
unplanned repairs. Emergencies<br />
not included<br />
Asset Management <strong>Plan</strong> in place<br />
No PHRMP.<br />
Water Assessments done<br />
<strong>Term</strong>s & Conditions Contract<br />
Dedicated operator for network with full back-up<br />
resources<br />
All hours phone access for faults<br />
3 days min at<br />
contracted rate of<br />
supply<br />
1800l/day units with<br />
minimum supply<br />
pressure of 200kpa<br />
Source - U<br />
Zone - u<br />
Warnings by phone,<br />
mail out and local<br />
advertising<br />
Compliance - No<br />
O/head fillers 4 hours planned and up to 12<br />
unplanned repairs. Emergencies<br />
not included<br />
Asset Management <strong>Plan</strong> in place<br />
Draft PHRMP.<br />
Water Assessments done<br />
<strong>Term</strong>s & Conditions Contract<br />
Dedicated operator for network with full back-up<br />
resources<br />
All hours phone access for faults<br />
3 days min at<br />
contracted rate of<br />
supply<br />
1800l/day units with<br />
minimum supply<br />
pressure of 200kpa<br />
Source - E<br />
Zone - e<br />
Warnings by phone,<br />
mail out and local<br />
advertising<br />
Compliance - Yes<br />
(Ecoli)<br />
Hydrants in Cheviot town<br />
otherwise o/head fillers<br />
6 hours planned and up to 12<br />
unplanned repairs. Emergencies<br />
not included<br />
Asset Management <strong>Plan</strong> in place<br />
No PHRMP.<br />
Water Assessments done<br />
<strong>Term</strong>s & Conditions Contract<br />
Dedicated operator for network with full back-up<br />
resources<br />
All hours phone access for faults<br />
3 days min at<br />
contracted rate of<br />
supply<br />
1800l/day units with<br />
minimum supply<br />
pressure of 200kpa<br />
Source - U<br />
Zone - u<br />
Warnings by phone,<br />
mail out and local<br />
advertising<br />
Compliance - No<br />
O/head fillers 6 hours planned and up to 12<br />
unplanned repairs. Emergencies<br />
not included<br />
273
www.hurunui.govt.nz<br />
LEVELS OF SERVICE – WASTE WATER NETWORKS – February 2011<br />
Network Collection Management Documents and Service <strong>Council</strong> Responsibility<br />
Limits on Domestic<br />
or Trade Discharges<br />
Amberley Gravity reticulation in<br />
Amberley and gravity<br />
collection then pumped<br />
from all other areas<br />
Asset Management <strong>Plan</strong> in place<br />
Water Assessments done<br />
<strong>Term</strong>s & Conditions Contract<br />
Dedicated operator for network with full back-up<br />
resources<br />
All hours phone access for faults<br />
Cheviot Gravity to main Asset Management <strong>Plan</strong> in place<br />
lift pump prior to Water Assessments done<br />
treatment pond<br />
<strong>Term</strong>s & Conditions Contract<br />
Dedicated operator for network with full back-up<br />
resources<br />
All hours phone access for faults<br />
Greta Valley Gravity Asset Management <strong>Plan</strong> in place<br />
Motunau Beach Gravity to pump<br />
stations<br />
Hanmer Springs Gravity with some<br />
private pumped lines<br />
feeding in<br />
Hawarden Gravity to main pump<br />
station<br />
Waikari Gravity to main pump<br />
station<br />
Water Assessments done<br />
<strong>Term</strong>s & Conditions Contract<br />
Dedicated operator for network with full back-up<br />
resources<br />
All hours phone access for faults<br />
Asset Management <strong>Plan</strong> in place<br />
Water Assessments done<br />
<strong>Term</strong>s & Conditions Contract<br />
Dedicated operator for network with full back-up<br />
resources<br />
All hours phone access for faults<br />
Asset Management <strong>Plan</strong> in place<br />
Water Assessments done<br />
<strong>Term</strong>s & Conditions Contract<br />
Dedicated operator for network with full back-up<br />
resources<br />
All hours phone access for faults<br />
Asset Management <strong>Plan</strong> in place<br />
Water Assessments done<br />
<strong>Term</strong>s & Conditions Contract<br />
Dedicated operator for network with full back-up<br />
resources<br />
All hours phone access for faults<br />
Asset Management <strong>Plan</strong> in place<br />
Water Assessments done<br />
<strong>Term</strong>s & Conditions Contract<br />
Dedicated operator for network with full back-up<br />
resources<br />
All hours phone access for faults<br />
To consumers<br />
property boundary.<br />
Consumer responsible<br />
for line up-flow of<br />
property boundary<br />
To consumers<br />
property boundary.<br />
Consumer responsible<br />
for line up-flow of<br />
property boundary<br />
To consumers<br />
property boundary.<br />
Consumer responsible<br />
for line up-flow of<br />
property boundary<br />
To consumers<br />
property boundary.<br />
Consumer responsible<br />
for line up-flow of<br />
property boundary<br />
To consumers<br />
property boundary.<br />
Consumer responsible<br />
for line up-flow of<br />
property boundary<br />
To consumers<br />
property boundary.<br />
Consumer responsible<br />
for line up-flow of<br />
property boundary<br />
To consumers<br />
property boundary.<br />
Consumer responsible<br />
for line up-flow of<br />
property boundary<br />
Domestic - 2000l/<br />
day at a maximum<br />
rate of 2 l/sec<br />
Commercial - as<br />
agreed Trade/<br />
Industry - as<br />
agreed<br />
Domestic - 2000l/<br />
day at a maximum<br />
rate of 2 l/sec<br />
Commercial - as<br />
agreed Trade/<br />
Industry - as<br />
agreed<br />
Domestic - 2000l/<br />
day at a maximum<br />
rate of 2 l/sec<br />
Commercial - as<br />
agreed Trade/<br />
Industry - as<br />
agreed<br />
Domestic - 2000l/<br />
day at a maximum<br />
rate of 2 l/sec<br />
Commercial - as<br />
agreed Trade/<br />
Industry - as<br />
agreed<br />
Domestic - 2000l/<br />
day at a maximum<br />
rate of 2 l/sec<br />
Commercial - as<br />
agreed Trade/<br />
Industry - as<br />
agreed<br />
Domestic - 2000l/<br />
day at a maximum<br />
rate of 2 l/sec<br />
Commercial - as<br />
agreed Trade/<br />
Industry - as<br />
agreed<br />
Domestic - 2000l/<br />
day at a maximum<br />
rate of 2 l/sec<br />
Commercial - as<br />
agreed Trade/<br />
Industry - as<br />
agreed<br />
Continuity of<br />
Collection<br />
4 hours planned<br />
notice given<br />
ahead of time.<br />
Emergencies<br />
excluded<br />
4 hours planned<br />
notice given<br />
ahead of time.<br />
Emergencies<br />
excluded<br />
4 hours planned<br />
notice given<br />
ahead of time.<br />
Emergencies<br />
excluded<br />
4 hours planned<br />
notice given<br />
ahead of time.<br />
Emergencies<br />
excluded<br />
4 hours planned<br />
notice given<br />
ahead of time.<br />
Emergencies<br />
excluded<br />
4 hours planned<br />
notice given<br />
ahead of time.<br />
Emergencies<br />
excluded<br />
4 hours planned<br />
notice given<br />
ahead of time.<br />
Emergencies<br />
excluded<br />
274
<strong>Hurunui</strong> <strong>Community</strong> <strong>Long</strong> <strong>Term</strong> <strong>Plan</strong> <strong>2012</strong> - <strong>2022</strong><br />
Rates: Sample Properties<br />
Amberley Township<br />
Amberley Township<br />
Amberley Water (x 209 units)<br />
Amberley Water (x 238 units)<br />
1 x Fixed Charges 1 x Fixed Charges<br />
Capital Value: $255,000 Capital Value: $520,000<br />
Actual Rates for Proposed Rates for Indicative Rates for Indicative Rates for Actual Rates for Proposed Rates for Indicative Rates for Indicative Rates for<br />
2011/<strong>2012</strong> <strong>2012</strong>/2013 2013/2014 2014/2015 2011/<strong>2012</strong> <strong>2012</strong>/2013 2013/2014 2014/2015<br />
General Rates<br />
General Rates & UAGC 44.39 58.94 74.96 76.69 53.03 73.42 93.15 97.27<br />
Roading 159.55 158.00 164.36 173.84 325.36 322.19 335.16 354.50<br />
Governance 86.61 96.88 102.53 113.06 113.12 126.51 133.88 147.63<br />
<strong>Plan</strong>ning 45.29 51.26 53.30 54.53 92.35 104.53 108.69 111.20<br />
Waste Management 120.55 120.52 123.08 125.87 120.55 120.52 123.08 125.87<br />
Canterbury Museum 8.13 8.49 9.24 10.53 8.13 8.49 9.24 10.53<br />
464.53 494.09 527.47 554.52 712.54 755.65 803.20 847.00<br />
Amenities Rates<br />
Capital Value 63.52 66.70 70.03 73.53 129.53 136.01 142.81 149.95<br />
Uniform Annual Charges 145.56 152.84 160.48 168.50 145.56 152.84 160.48 168.50<br />
209.08 219.53 230.51 242.04 275.09 288.85 303.29 318.45<br />
Utilities Rates<br />
Water 249.97 268.97 289.41 311.40 267.89 288.25 310.16 333.73<br />
Water Compliance - Miox Treatment - - - - - - - -<br />
Sewer 144.95 170.32 200.12 235.14 144.95 170.32 200.12 235.14<br />
Drainage/Protection 108.77 108.77 108.77 108.77 108.77 108.77 108.77 108.77<br />
503.69 548.05 598.30 655.32 521.61 567.34 619.05 677.65<br />
Other Rates<br />
Refuse Collection 260.00 260.00 260.00 260.00 260.00 260.00 260.00 260.00<br />
Swimming Pool Inspection - - - - - - - -<br />
Rural Fire 9.03 9.39 9.76 10.15 18.41 19.14 19.91 20.71<br />
Medical Centres - - - - - - - -<br />
Tourism - - - - - - - -<br />
Amberley Library Rate 18.14 18.14 18.14 4.88 18.14 18.14 18.14 4.88<br />
287.17 287.53 287.90 275.03 296.55 297.28 298.05 285.58<br />
TOTAL $ 1,464.46 $ 1,549.20 $ 1,644.19 $ 1,726.91 $ 1,805.80 $ 1,909.12 $ 2,023.60 $ 2,128.68<br />
Increase ($) 84.74 94.98 82.72 Increase ($) 103.33 114.47 105.09<br />
Increase (%) 5.79% 6.13% 5.03% Increase (%) 5.72% 6.00% 5.19%<br />
H:\<strong>Long</strong> <strong>Term</strong> <strong>Plan</strong> Workings\Rates - for Final LTP\Funding Impact Statement for <strong>2012</strong>-2013 - Post Submissions.xls 20/06/<strong>2012</strong> 10:09 a.m.<br />
Amberley Beach Township<br />
Amberley Rural<br />
Ashley Water (x 0.5 points)<br />
Ashley Water (x 1 point)<br />
1 x Fixed Charges 0 x Fixed Charges<br />
Capital Value: $175,000 Capital Value: $2,400,000<br />
General Rates<br />
General Rates & UAGC<br />
Roading<br />
Governance<br />
<strong>Plan</strong>ning<br />
Waste Management<br />
Canterbury Museum<br />
Actual Rates for Proposed Rates for Indicative Rates for Indicative Rates for Actual Rates for Proposed Rates for Indicative Rates for Indicative Rates for<br />
2011/<strong>2012</strong> <strong>2012</strong>/2013 2013/2014 2014/2015 2011/<strong>2012</strong> <strong>2012</strong>/2013 2013/2014 2014/2015<br />
41.79 54.57 69.47 70.48 78.24 131.13 164.75 186.36<br />
109.50 108.43 112.79 119.30 1,501.68 1,487.03 1,546.90 1,636.15<br />
78.61 87.94 93.06 102.63 240.02 268.29 283.93 313.10<br />
31.08 35.18 36.58 37.42 426.24 482.43 501.64 513.24<br />
120.55 120.52 123.08 125.87 - - - -<br />
8.13 8.49 9.24 10.53 - - - -<br />
389.65 415.12 444.23 466.23 2,246.18 2,368.89 2,497.23 2,648.86<br />
Amenities Rates<br />
Capital Value<br />
Uniform Annual Charges<br />
43.59 45.77 48.06 50.46 132.00 138.60 145.53 152.81<br />
145.56 152.84 160.48 168.50 - - - -<br />
189.15 198.61 208.54 218.97 132.00 138.60 145.53 152.81<br />
Utilities Rates<br />
Water<br />
Water Compliance - Miox Treatment<br />
Sewer<br />
Drainage/Protection<br />
283.50 294.84 306.63 318.90 567.00 589.68 613.27 637.80<br />
- - - - - - - -<br />
144.95 170.32 200.12 235.14 - - - -<br />
283.77 283.77 283.77 283.77 - - - -<br />
712.22 748.93 790.53 837.81 567.00 589.68 613.27 637.80<br />
Other Rates<br />
Refuse Collection<br />
Swimming Pool Inspection<br />
Rural Fire<br />
Medical Centres<br />
Tourism<br />
Amberley Library Rate<br />
TOTAL<br />
260.00 260.00 260.00 260.00 - - - -<br />
- - - - - - - -<br />
6.20 6.44 6.70 6.97 201.12 209.16 217.53 226.23<br />
- - - - - - - -<br />
- - - - - - - -<br />
18.14 18.14 18.14 4.88 - - - -<br />
284.34 284.58 284.84 271.84 201.12 209.16 217.53 226.23<br />
$ 1,575.36 $ 1,647.24 $ 1,728.13 $ 1,794.85 $ 3,146.30 $ 3,306.33 $ 3,473.56 $ 3,665.69<br />
Increase ($) 71.88 80.89 66.72 Increase ($) 160.03 167.22 192.14<br />
Increase (%) 4.56% 4.91% 3.86% Increase (%) 5.09% 5.06% 5.53%<br />
H:\<strong>Long</strong> <strong>Term</strong> <strong>Plan</strong> Workings\Rates - for Final LTP\Funding Impact Statement for <strong>2012</strong>-2013 - Post Submissions.xls 20/06/<strong>2012</strong> 10:09 a.m.<br />
275
www.hurunui.govt.nz<br />
Leithfield Township<br />
Leithfield Beach<br />
Ashley Water (x 0.5 point)<br />
Leithfield Beach Water (x 1 unit)<br />
1 x Fixed Charges 1 x Fixed Charges<br />
Capital Value: $205,000 Capital Value: $180,000<br />
General Rates<br />
General Rates & UAGC<br />
Roading<br />
Governance<br />
<strong>Plan</strong>ning<br />
Waste Management<br />
Canterbury Museum<br />
Actual Rates for Proposed Rates for Indicative Rates for Indicative Rates for Actual Rates for Proposed Rates for Indicative Rates for Indicative Rates for<br />
2011/<strong>2012</strong> <strong>2012</strong>/2013 2013/2014 2014/2015 2011/<strong>2012</strong> <strong>2012</strong>/2013 2013/2014 2014/2015<br />
42.76 56.21 71.53 72.81 41.95 54.84 69.81 70.87<br />
128.27 127.02 132.13 139.75 112.63 111.53 116.02 122.71<br />
81.61 91.29 96.61 106.54 79.11 88.50 93.66 103.28<br />
36.41 41.21 42.85 43.84 31.97 36.18 37.62 38.49<br />
120.55 120.52 123.08 125.87 120.55 120.52 123.08 125.87<br />
8.13 8.49 9.24 10.53 8.13 8.49 9.24 10.53<br />
417.73 444.73 475.44 499.34 394.33 420.06 449.43 471.75<br />
Amenities Rates<br />
Capital Value<br />
Uniform Annual Charges<br />
51.07 53.62 56.30 59.11 44.84 47.08 49.43 51.91<br />
145.56 152.84 160.48 168.50 145.56 152.84 160.48 168.50<br />
196.63 206.46 216.78 227.62 190.40 199.92 209.91 220.41<br />
Utilities Rates<br />
Water<br />
Water Compliance - Miox Treatment<br />
Sewer<br />
Drainage/Protection<br />
283.50 294.84 306.63 318.90 205.30 222.24 240.57 260.42<br />
- - - - - - - -<br />
144.95 170.32 200.12 235.14 144.95 170.32 200.12 235.14<br />
- - - - - - - -<br />
428.45 465.16 506.76 554.04 350.25 392.55 440.69 495.56<br />
Other Rates<br />
Refuse Collection<br />
Swimming Pool Inspection<br />
Rural Fire<br />
Medical Centres<br />
Tourism<br />
Amberley Library Rate<br />
TOTAL<br />
260.00 260.00 260.00 260.00 260.00 260.00 260.00 260.00<br />
- - - - - - - -<br />
17.18 17.87 18.58 19.32 6.37 6.63 6.89 7.17<br />
- - - - - - - -<br />
- - - - - - - -<br />
18.14 18.14 18.14 4.88 18.14 18.14 18.14 4.88<br />
295.32 296.01 296.72 284.20 284.51 284.77 285.03 272.04<br />
$ 1,338.13 $ 1,412.35 $ 1,495.70 $ 1,565.20 $ 1,219.49 $ 1,297.30 $ 1,385.07 $ 1,459.76<br />
Increase ($) 74.23 83.34 69.50 Increase ($) 77.80 87.77 74.69<br />
Increase (%) 5.55% 5.90% 4.65% Increase (%) 6.38% 6.77% 5.39%<br />
H:\<strong>Long</strong> <strong>Term</strong> <strong>Plan</strong> Workings\Rates - for Final LTP\Funding Impact Statement for <strong>2012</strong>-2013 - Post Submissions.xls 20/06/<strong>2012</strong> 10:09 a.m.<br />
Waiau Township<br />
Rotherham Township<br />
Waiau Township Water (x 147 units)<br />
No Water<br />
1 x Fixed Charges 1 x Fixed Charges<br />
Capital Value: $200,000 Capital Value: $270,000<br />
General Rates<br />
General Rates & UAGC<br />
Roading<br />
Governance<br />
<strong>Plan</strong>ning<br />
Waste Management<br />
Canterbury Museum<br />
Actual Rates for Proposed Rates for Indicative Rates for Indicative Rates for Actual Rates for Proposed Rates for Indicative Rates for Indicative Rates for<br />
2011/<strong>2012</strong> <strong>2012</strong>/2013 2013/2014 2014/2015 2011/<strong>2012</strong> <strong>2012</strong>/2013 2013/2014 2014/2015<br />
42.60 55.93 71.19 72.42 44.88 59.76 75.99 77.85<br />
125.14 123.92 128.91 136.35 168.94 167.29 174.03 184.07<br />
81.11 90.73 96.02 105.89 88.11 98.56 104.30 115.02<br />
35.52 40.20 41.80 42.77 47.95 54.27 56.43 57.74<br />
120.55 120.52 123.08 125.87 120.55 120.52 123.08 125.87<br />
8.13 8.49 9.24 10.53 8.13 8.49 9.24 10.53<br />
413.05 439.80 470.24 493.82 478.57 508.89 543.08 571.08<br />
Amenities Rates<br />
Capital Value<br />
Uniform Annual Charges<br />
110.72 110.72 114.04 117.46 149.47 149.47 153.96 158.57<br />
136.03 136.03 140.11 144.31 136.03 136.03 140.11 144.31<br />
246.75 246.75 254.15 261.78 285.50 285.50 294.07 302.89<br />
Utilities Rates<br />
Water<br />
Water Compliance - Miox Treatment<br />
Sewer<br />
Drainage/Protection<br />
247.21 257.10 267.39 278.08 - - - -<br />
- - - - - - - -<br />
- - - - - - - -<br />
- - - - - - - -<br />
247.21 257.10 267.39 278.08 - - - -<br />
Other Rates<br />
Refuse Collection<br />
Swimming Pool Inspection<br />
Rural Fire<br />
Medical Centres<br />
Tourism<br />
Amberley Library Rate<br />
TOTAL<br />
260.00 260.00 260.00 260.00 260.00 260.00 260.00 260.00<br />
- - - - - - - -<br />
7.08 7.36 7.66 7.96 - - - -<br />
101.30 101.30 101.30 101.30 101.30 101.30 101.30 101.30<br />
- - - - - - - -<br />
- - - - - - - -<br />
368.38 368.66 368.96 369.26 361.30 361.30 361.30 361.30<br />
$ 1,275.40 $ 1,312.31 $ 1,360.74 $ 1,402.94 $ 1,125.37 $ 1,155.69 $ 1,198.44 $ 1,235.27<br />
Increase ($) 36.92 48.42 42.21 Increase ($) 30.33 42.75 36.82<br />
Increase (%) 2.89% 3.69% 3.10% Increase (%) 2.69% 3.70% 3.07%<br />
H:\<strong>Long</strong> <strong>Term</strong> <strong>Plan</strong> Workings\Rates - for Final LTP\Funding Impact Statement for <strong>2012</strong>-2013 - Post Submissions.xls 20/06/<strong>2012</strong> 10:09 a.m.<br />
276
<strong>Hurunui</strong> <strong>Community</strong> <strong>Long</strong> <strong>Term</strong> <strong>Plan</strong> <strong>2012</strong> - <strong>2022</strong><br />
Culverden Township<br />
Amuri Rural<br />
Culverden Township Water (x 322 units)<br />
Waiau Rural Water (x 8 points)<br />
1 x Fixed Charges 1 x Fixed Charges<br />
Capital Value: $215,000 Capital Value: $2,215,000<br />
General Rates<br />
General Rates & UAGC<br />
Roading<br />
Governance<br />
<strong>Plan</strong>ning<br />
Waste Management<br />
Canterbury Museum<br />
Actual Rates for Proposed Rates for Indicative Rates for Indicative Rates for Actual Rates for Proposed Rates for Indicative Rates for Indicative Rates for<br />
2011/<strong>2012</strong> <strong>2012</strong>/2013 2013/2014 2014/2015 2011/<strong>2012</strong> <strong>2012</strong>/2013 2013/2014 2014/2015<br />
43.09 56.75 72.22 73.58 108.29 166.03 209.51 228.89<br />
134.53 133.21 138.58 146.57 1,385.93 1,372.41 1,427.66 1,510.03<br />
82.61 92.41 97.80 107.84 282.63 315.99 334.40 368.76<br />
38.18 43.22 44.94 45.98 393.38 445.24 462.98 473.68<br />
120.55 120.52 123.08 125.87 120.55 120.52 123.08 125.87<br />
8.13 8.49 9.24 10.53 8.13 8.49 9.24 10.53<br />
427.09 454.61 485.85 510.38 2,298.91 2,428.68 2,566.87 2,717.76<br />
Amenities Rates<br />
Capital Value<br />
Uniform Annual Charges<br />
119.02 119.02 122.59 126.27 33.45 33.45 34.45 35.48<br />
136.03 136.03 140.11 144.31 136.03 136.03 140.11 144.31<br />
255.05 255.05 262.71 270.59 169.48 169.48 174.56 179.80<br />
Utilities Rates<br />
Water<br />
Water Compliance - Miox Treatment<br />
Sewer<br />
Drainage/Protection<br />
364.89 380.40 396.56 413.42 5,328.00 5,541.12 5,762.76 5,993.28<br />
- - - - - - - -<br />
- - - - - - - -<br />
- - - - - - - -<br />
364.89 380.40 396.56 413.42 5,328.00 5,541.12 5,762.76 5,993.28<br />
Other Rates<br />
Refuse Collection<br />
Swimming Pool Inspection<br />
Rural Fire<br />
Medical Centres<br />
Tourism<br />
Amberley Library Rate<br />
TOTAL<br />
260.00 260.00 260.00 260.00 - - - -<br />
- - - - - - - -<br />
7.61 7.92 8.23 8.56 185.62 193.04 200.76 208.79<br />
101.30 101.30 101.30 101.30 101.30 101.30 101.30 101.30<br />
- - - - - - - -<br />
- - - - - - - -<br />
368.91 369.22 369.53 369.86 286.92 294.34 302.06 310.09<br />
$ 1,415.94 $ 1,459.27 $ 1,514.65 $ 1,564.24 $ 8,083.30 $ 8,433.62 $ 8,806.26 $ 9,200.92<br />
Increase ($) 43.33 55.38 49.59 Increase ($) 350.31 372.64 394.66<br />
Increase (%) 3.06% 3.79% 3.27% Increase (%) 4.33% 4.42% 4.48%<br />
H:\<strong>Long</strong> <strong>Term</strong> <strong>Plan</strong> Workings\Rates - for Final LTP\Funding Impact Statement for <strong>2012</strong>-2013 - Post Submissions.xls 20/06/<strong>2012</strong> 10:09 a.m.<br />
Amuri Rural<br />
Cheviot Township<br />
Amuri Plains Water (x 7 points)<br />
Cheviot Water (x 0.5 point)<br />
4 x Fixed Charges 1 x Fixed Charges<br />
Capital Value: $7,725,000 Capital Value: $170,000<br />
General Rates<br />
General Rates & UAGC<br />
Roading<br />
Governance<br />
<strong>Plan</strong>ning<br />
Waste Management<br />
Canterbury Museum<br />
Actual Rates for Proposed Rates for Indicative Rates for Indicative Rates for Actual Rates for Proposed Rates for Indicative Rates for Indicative Rates for<br />
2011/<strong>2012</strong> <strong>2012</strong>/2013 2013/2014 2014/2015 2011/<strong>2012</strong> <strong>2012</strong>/2013 2013/2014 2014/2015<br />
396.16 602.10 760.13 827.41 41.62 54.29 69.13 70.09<br />
4,833.53 4,786.39 4,979.09 5,266.37 106.37 105.33 109.57 115.89<br />
1,017.02 1,137.08 1,203.34 1,326.98 78.11 87.38 92.47 101.97<br />
1,371.96 1,552.82 1,614.66 1,651.98 30.19 34.17 35.53 36.35<br />
482.20 482.08 492.30 503.49 120.55 120.52 123.08 125.87<br />
32.52 33.95 36.98 42.10 8.13 8.49 9.24 10.53<br />
8,133.38 8,594.43 9,086.50 9,618.34 384.97 410.19 439.03 460.71<br />
Amenities Rates<br />
Capital Value<br />
Uniform Annual Charges<br />
116.65 116.65 120.15 123.75 68.78 68.78 70.85 72.97<br />
544.12 544.12 560.44 577.26 81.06 81.06 83.49 86.00<br />
660.77 660.77 680.59 701.01 149.84 149.84 154.34 158.97<br />
Utilities Rates<br />
Water<br />
Water Compliance - Miox Treatment<br />
Sewer<br />
Drainage/Protection<br />
1,298.50 1,350.44 1,404.46 1,460.64 360.65 411.14 431.70 453.28<br />
- - - - - 37.95 75.90 115.00<br />
- - - - 324.07 340.27 357.29 375.15<br />
- - - - 2.34 2.34 2.34 2.34<br />
1,298.50 1,350.44 1,404.46 1,460.64 687.06 791.70 867.23 945.77<br />
Other Rates<br />
Refuse Collection<br />
Swimming Pool Inspection<br />
Rural Fire<br />
Medical Centres<br />
Tourism<br />
Amberley Library Rate<br />
TOTAL<br />
- - - - 260.00 260.00 260.00 260.00<br />
77.09 98.76 101.85 104.95 - - - -<br />
647.36 673.25 700.18 728.19 6.02 6.26 6.51 6.77<br />
405.20 405.20 405.20 405.20 24.93 45.00 45.00 45.00<br />
- - - - - - - -<br />
- - - - - - - -<br />
1,129.65 1,177.21 1,207.23 1,238.34 290.95 311.26 311.51 311.77<br />
$ 11,222.30 $ 11,782.84 $ 12,378.78 $ 13,018.32 $ 1,512.82 $ 1,662.99 $ 1,772.10 $ 1,877.22<br />
Increase ($) 560.55 595.94 639.54 Increase ($) 150.17 109.10 105.12<br />
Increase (%) 4.99% 5.06% 5.17% Increase (%) 9.93% 6.56% 5.93%<br />
H:\<strong>Long</strong> <strong>Term</strong> <strong>Plan</strong> Workings\Rates - for Final LTP\Funding Impact Statement for <strong>2012</strong>-2013 - Post Submissions.xls 20/06/<strong>2012</strong> 10:09 a.m.<br />
277
www.hurunui.govt.nz<br />
Cheviot Rural<br />
Motunau Beach<br />
Cheviot Water (x 2.5 points)<br />
<strong>Hurunui</strong> Rural Water (x 0.5 point)<br />
2 x Fixed Charges 1 x Fixed Charges<br />
Capital Value: $2,025,000 Capital Value: $390,000<br />
General Rates<br />
General Rates & UAGC<br />
Roading<br />
Governance<br />
<strong>Plan</strong>ning<br />
Waste Management<br />
Canterbury Museum<br />
Actual Rates for Proposed Rates for Indicative Rates for Indicative Rates for Actual Rates for Proposed Rates for Indicative Rates for Indicative Rates for<br />
2011/<strong>2012</strong> <strong>2012</strong>/2013 2013/2014 2014/2015 2011/<strong>2012</strong> <strong>2012</strong>/2013 2013/2014 2014/2015<br />
138.18 200.65 253.92 271.02 48.79 66.32 84.23 87.17<br />
1,267.04 1,254.69 1,305.20 1,380.51 244.02 241.64 251.37 265.88<br />
324.74 363.13 384.29 423.77 100.11 111.97 118.50 130.67<br />
359.64 407.05 423.26 433.04 69.26 78.39 81.52 83.40<br />
241.10 241.04 246.15 251.74 120.55 120.52 123.08 125.87<br />
16.26 16.98 18.49 21.05 8.13 8.49 9.24 10.53<br />
2,346.96 2,483.53 2,631.31 2,781.14 590.87 627.34 667.94 703.52<br />
Amenities Rates<br />
Capital Value<br />
Uniform Annual Charges<br />
56.50 56.50 58.19 59.94 - - - -<br />
162.12 162.12 166.98 171.99 97.73 97.73 97.73 97.73<br />
218.62 218.62 225.18 231.93 97.73 97.73 97.73 97.73<br />
Utilities Rates<br />
Water<br />
Water Compliance - Miox Treatment<br />
Sewer<br />
Drainage/Protection<br />
1,440.13 1,641.74 1,723.83 1,810.02 312.50 353.13 369.53 386.76<br />
- 75.90 151.80 230.00 - 37.95 75.90 115.00<br />
- - - - 192.43 201.57 211.15 221.17<br />
- - - - - - - -<br />
1,440.13 1,717.64 1,875.63 2,040.02 504.93 592.65 656.58 722.93<br />
Other Rates<br />
Refuse Collection<br />
Swimming Pool Inspection<br />
Rural Fire<br />
Medical Centres<br />
Tourism<br />
Amberley Library Rate<br />
TOTAL<br />
- - - - 260.00 260.00 260.00 260.00<br />
- - - - - - - -<br />
169.70 176.48 183.54 190.88 13.81 14.36 14.93 15.53<br />
49.86 90.00 90.00 90.00 - - - -<br />
- - - - - - - -<br />
- - - - - - - -<br />
219.56 266.48 273.54 280.88 273.81 274.36 274.93 275.53<br />
$ 4,225.26 $ 4,686.27 $ 5,005.66 $ 5,333.97 $ 1,467.34 $ 1,592.07 $ 1,697.18 $ 1,799.71<br />
Increase ($) 461.02 319.38 328.31 Increase ($) 124.73 105.11 102.54<br />
Increase (%) 10.91% 6.82% 6.56% Increase (%) 8.50% 6.60% 6.04%<br />
H:\<strong>Long</strong> <strong>Term</strong> <strong>Plan</strong> Workings\Rates - for Final LTP\Funding Impact Statement for <strong>2012</strong>-2013 - Post Submissions.xls 20/06/<strong>2012</strong> 10:09 a.m.<br />
Waipara Township<br />
Glenmark Rural<br />
Waipara Water (x 66 units)<br />
<strong>Hurunui</strong> Rural Water (x 7 points)<br />
1 x Fixed Charges 2 x Fixed Charges<br />
Capital Value: $220,000 Capital Value: $1,900,000<br />
General Rates<br />
General Rates & UAGC<br />
Roading<br />
Governance<br />
<strong>Plan</strong>ning<br />
Waste Management<br />
Canterbury Museum<br />
Actual Rates for Proposed Rates for Indicative Rates for Indicative Rates for Actual Rates for Proposed Rates for Indicative Rates for Indicative Rates for<br />
2011/<strong>2012</strong> <strong>2012</strong>/2013 2013/2014 2014/2015 2011/<strong>2012</strong> <strong>2012</strong>/2013 2013/2014 2014/2015<br />
43.25 57.03 72.56 73.97 134.10 193.82 245.34 261.32<br />
137.65 136.31 141.80 149.98 1,188.83 1,177.24 1,224.63 1,295.29<br />
83.11 92.97 98.39 108.50 312.24 349.15 369.50 407.46<br />
39.07 44.22 45.98 47.05 337.44 381.92 397.13 406.31<br />
120.55 120.52 123.08 125.87 241.10 241.04 246.15 251.74<br />
8.13 8.49 9.24 10.53 16.26 16.98 18.49 21.05<br />
431.77 459.54 491.05 515.89 2,229.97 2,360.16 2,501.25 2,643.18<br />
Amenities Rates<br />
Capital Value<br />
Uniform Annual Charges<br />
- - - - - - - -<br />
97.73 97.73 97.73 97.73 195.46 195.46 195.46 195.46<br />
97.73 97.73 97.73 97.73 195.46 195.46 195.46 195.46<br />
Utilities Rates<br />
Water<br />
Water Compliance - Miox Treatment<br />
Sewer<br />
Drainage/Protection<br />
111.19 111.19 111.19 111.19 4,375.00 4,943.75 5,173.44 5,414.61<br />
- 37.95 75.90 115.00 - 75.90 151.80 230.00<br />
- - - - - - - -<br />
- - - - - - - -<br />
111.19 149.14 187.09 226.19 4,375.00 5,019.65 5,325.24 5,644.61<br />
Other Rates<br />
Refuse Collection<br />
Swimming Pool Inspection<br />
Rural Fire<br />
Medical Centres<br />
Tourism<br />
Amberley Library Rate<br />
TOTAL<br />
260.00 260.00 260.00 260.00 - - - -<br />
- - - - - - - -<br />
7.79 8.10 8.42 8.76 159.22 165.59 172.21 179.10<br />
- - - - - - - -<br />
- - - - - - - -<br />
- - - - - - - -<br />
267.79 268.10 268.42 268.76 159.22 165.59 172.21 179.10<br />
$ 908.48 $ 974.51 $ 1,044.29 $ 1,108.57 $ 6,959.65 $ 7,740.85 $ 8,194.16 $ 8,662.35<br />
Increase ($) 66.03 69.78 64.28 Increase ($) 781.20 453.30 468.19<br />
Increase (%) 7.27% 7.16% 6.16% Increase (%) 11.22% 5.86% 5.71%<br />
H:\<strong>Long</strong> <strong>Term</strong> <strong>Plan</strong> Workings\Rates - for Final LTP\Funding Impact Statement for <strong>2012</strong>-2013 - Post Submissions.xls 20/06/<strong>2012</strong> 10:09 a.m.<br />
278
<strong>Hurunui</strong> <strong>Community</strong> <strong>Long</strong> <strong>Term</strong> <strong>Plan</strong> <strong>2012</strong> - <strong>2022</strong><br />
Hanmer Springs Township<br />
Hanmer Springs Township<br />
Hanmer Springs Water (x 216 units)<br />
Hanmer Springs Water (x 27 units)<br />
1 x Fixed Charges & Tourism 1 x Fixed Charges<br />
Capital Value: $405,000 Capital Value: $430,000<br />
General Rates<br />
General Rates & UAGC<br />
Roading<br />
Governance<br />
<strong>Plan</strong>ning<br />
Waste Management<br />
Canterbury Museum<br />
Actual Rates for Proposed Rates for Indicative Rates for Indicative Rates for Actual Rates for Proposed Rates for Indicative Rates for Indicative Rates for<br />
2011/<strong>2012</strong> <strong>2012</strong>/2013 2013/2014 2014/2015 2011/<strong>2012</strong> <strong>2012</strong>/2013 2013/2014 2014/2015<br />
49.28 67.13 85.26 88.34 50.10 68.50 86.98 90.28<br />
253.41 250.94 261.04 276.10 269.05 266.43 277.15 293.14<br />
101.61 113.65 120.27 132.63 104.11 116.45 123.23 135.89<br />
71.93 81.41 84.65 86.61 76.37 86.44 89.88 91.95<br />
120.55 120.52 123.08 125.87 120.55 120.52 123.08 125.87<br />
8.13 8.49 9.24 10.53 8.13 8.49 9.24 10.53<br />
604.91 642.14 683.55 720.08 628.31 666.82 709.56 747.67<br />
Amenities Rates<br />
Capital Value<br />
Uniform Annual Charges<br />
142.48 142.48 146.75 151.16 151.27 151.27 155.81 160.49<br />
206.11 206.11 212.29 218.66 206.11 206.11 212.29 218.66<br />
348.59 348.59 359.05 369.82 357.38 357.38 368.11 379.15<br />
Utilities Rates<br />
Water<br />
Water Compliance - Miox Treatment<br />
Sewer<br />
Drainage/Protection<br />
307.39 319.69 332.47 345.77 193.87 201.62 209.69 218.07<br />
- - - - - - - -<br />
151.48 168.14 186.64 207.17 151.48 168.14 186.64 207.17<br />
- - - - - - - -<br />
458.87 487.83 519.11 552.94 345.35 369.77 396.33 425.24<br />
Other Rates<br />
Refuse Collection<br />
Swimming Pool Inspection<br />
Rural Fire<br />
Medical Centres<br />
Tourism<br />
Amberley Library Rate<br />
TOTAL<br />
260.00 260.00 260.00 260.00 260.00 260.00 260.00 260.00<br />
- - - - - - - -<br />
14.34 14.91 15.51 16.13 15.22 15.83 16.46 17.12<br />
19.91 19.91 19.91 19.91 19.91 19.91 19.91 19.91<br />
355.00 369.20 383.97 399.33 - - - -<br />
- - - - - - - -<br />
649.25 664.02 679.38 695.36 295.13 295.74 296.37 297.03<br />
$ 2,061.62 $ 2,142.58 $ 2,241.09 $ 2,338.20 $ 1,626.17 $ 1,689.71 $ 1,770.36 $ 1,849.09<br />
Increase ($) 80.96 98.51 97.11 Increase ($) 63.53 80.66 78.73<br />
Increase (%) 3.93% 4.60% 4.33% Increase (%) 3.91% 4.77% 4.45%<br />
9 a.m.<br />
H:\<strong>Long</strong> <strong>Term</strong> <strong>Plan</strong> Workings\Rates - for Final LTP\Funding Impact Statement for <strong>2012</strong>-2013 - Post Submissions.xls 20/06/<strong>2012</strong> 10:09 a.m.<br />
Hanmer Springs Rural<br />
Hawarden Township<br />
No Water<br />
Hawarden-Waikari Water (x 292 units)<br />
1 x Fixed Charges 1 x Fixed Charges<br />
Capital Value: $3,325,000 Capital Value: $138,000<br />
General Rates<br />
General Rates & UAGC<br />
Roading<br />
Governance<br />
<strong>Plan</strong>ning<br />
Waste Management<br />
Canterbury Museum<br />
Actual Rates for Proposed Rates for Indicative Rates for Indicative Rates for Actual Rates for Proposed Rates for Indicative Rates for Indicative Rates for<br />
2011/<strong>2012</strong> <strong>2012</strong>/2013 2013/2014 2014/2015 2011/<strong>2012</strong> <strong>2012</strong>/2013 2013/2014 2014/2015<br />
144.48 226.68 285.71 315.08 40.58 52.55 66.93 67.60<br />
2,080.45 2,060.16 2,143.10 2,266.76 86.35 85.50 88.95 94.08<br />
393.64 440.08 465.72 513.57 74.91 83.80 88.69 97.80<br />
590.52 668.37 694.99 711.05 24.51 27.74 28.84 29.51<br />
120.55 120.52 123.08 125.87 120.55 120.52 123.08 125.87<br />
8.13 8.49 9.24 10.53 8.13 8.49 9.24 10.53<br />
3,337.77 3,524.29 3,721.84 3,942.85 355.03 378.60 405.73 425.39<br />
Amenities Rates<br />
Capital Value<br />
Uniform Annual Charges<br />
424.60 424.60 437.34 450.46 72.44 72.44 75.33 78.35<br />
206.11 206.11 212.29 218.66 68.51 68.51 71.25 74.10<br />
630.71 630.71 649.63 669.12 140.95 140.95 146.58 152.45<br />
Utilities Rates<br />
Water<br />
Water Compliance - Miox Treatment<br />
Sewer<br />
Drainage/Protection<br />
- - - - 234.40 243.77 253.52 263.66<br />
- - - - - - - -<br />
- - - - 348.97 358.57 368.43 378.56<br />
- - - - - - - -<br />
- - - - 583.37 602.34 621.95 642.22<br />
Other Rates<br />
Refuse Collection<br />
Swimming Pool Inspection<br />
Rural Fire<br />
Medical Centres<br />
Tourism<br />
Amberley Library Rate<br />
TOTAL<br />
- - - - 260.00 260.00 260.00 260.00<br />
- - - - - - - -<br />
278.64 289.78 301.37 313.43 4.89 5.08 5.28 5.50<br />
19.91 19.91 19.91 19.91 18.68 18.68 18.68 18.68<br />
- - - - - - - -<br />
- - - - - - - -<br />
298.55 309.69 321.28 333.34 283.57 283.76 283.96 284.18<br />
$ 4,267.03 $ 4,464.69 $ 4,692.75 $ 4,945.31 $ 1,362.90 $ 1,405.65 $ 1,458.23 $ 1,504.24<br />
Increase ($) 197.67 228.06 252.56 Increase ($) 42.75 52.58 46.01<br />
Increase (%) 4.63% 5.11% 5.38% Increase (%) 3.14% 3.74% 3.16%<br />
9 a.m.<br />
H:\<strong>Long</strong> <strong>Term</strong> <strong>Plan</strong> Workings\Rates - for Final LTP\Funding Impact Statement for <strong>2012</strong>-2013 - Post Submissions.xls 20/06/<strong>2012</strong> 10:09 a.m.<br />
279
www.hurunui.govt.nz<br />
Waikari Township<br />
<strong>Hurunui</strong> Rural<br />
Hawarden-Waikari Water (x 694 units)<br />
<strong>Hurunui</strong> Water (x 2 points)<br />
1 x Fixed Charges 1 x Fixed Charges<br />
Capital Value: $175,000 Capital Value: $3,435,000<br />
General Rates<br />
General Rates & UAGC<br />
Roading<br />
Governance<br />
<strong>Plan</strong>ning<br />
Waste Management<br />
Canterbury Museum<br />
Actual Rates for Proposed Rates for Indicative Rates for Indicative Rates for Actual Rates for Proposed Rates for Indicative Rates for Indicative Rates for<br />
2011/<strong>2012</strong> <strong>2012</strong>/2013 2013/2014 2014/2015 2011/<strong>2012</strong> <strong>2012</strong>/2013 2013/2014 2014/2015<br />
41.79 54.57 69.47 70.48 148.06 232.69 293.26 323.62<br />
109.50 108.43 112.79 119.30 2,149.28 2,128.32 2,214.00 2,341.75<br />
78.61 87.94 93.06 102.63 404.64 452.37 478.74 527.92<br />
31.08 35.18 36.58 37.42 610.06 690.48 717.98 734.57<br />
120.55 120.52 123.08 125.87 120.55 120.52 123.08 125.87<br />
8.13 8.49 9.24 10.53 8.13 8.49 9.24 10.53<br />
389.65 415.12 444.23 466.23 3,440.72 3,632.86 3,836.30 4,064.26<br />
Amenities Rates<br />
Capital Value<br />
Uniform Annual Charges<br />
91.86 91.86 95.53 99.35 439.68 439.68 457.27 475.56<br />
68.51 68.51 71.25 74.10 68.51 68.51 71.25 74.10<br />
160.37 160.37 166.78 173.45 508.19 508.19 528.52 549.66<br />
Utilities Rates<br />
Water<br />
Water Compliance - Miox Treatment<br />
Sewer<br />
Drainage/Protection<br />
381.72 396.98 412.86 429.38 1,250.00 1,412.50 1,478.13 1,547.03<br />
- - - - - 75.90 151.80 230.00<br />
502.28 522.37 543.27 565.00 - - - -<br />
- - - - - - - -<br />
884.00 919.36 956.13 994.38 1,250.00 1,488.40 1,629.93 1,777.03<br />
Other Rates<br />
Refuse Collection<br />
Swimming Pool Inspection<br />
Rural Fire<br />
Medical Centres<br />
Tourism<br />
Amberley Library Rate<br />
TOTAL<br />
260.00 260.00 260.00 260.00 - - - -<br />
- - - - - - - -<br />
6.20 6.44 6.70 6.97 121.60 126.46 131.52 136.78<br />
18.68 18.68 18.68 18.68 18.68 18.68 18.68 18.68<br />
- - - - - - - -<br />
- - - - - - - -<br />
284.88 285.12 285.38 285.65 140.28 145.14 150.20 155.46<br />
$ 1,718.89 $ 1,779.97 $ 1,852.52 $ 1,919.71 $ 5,339.19 $ 5,774.60 $ 6,144.94 $ 6,546.41<br />
Increase ($) 61.08 72.55 67.18 Increase ($) 435.41 370.34 401.47<br />
Increase (%) 3.55% 4.08% 3.63% Increase (%) 8.15% 6.41% 6.53%<br />
H:\<strong>Long</strong> <strong>Term</strong> <strong>Plan</strong> Workings\Rates - for Final LTP\Funding Impact Statement for <strong>2012</strong>-2013 - Post Submissions.xls 20/06/<strong>2012</strong> 10:09 a.m.<br />
280
Independent Auditor’s Report<br />
<strong>Hurunui</strong> <strong>Community</strong> <strong>Long</strong> <strong>Term</strong> <strong>Plan</strong> <strong>2012</strong> - <strong>2022</strong><br />
Independent Auditor’s Report<br />
To the readers of<br />
<strong>Hurunui</strong> <strong>District</strong> <strong>Council</strong>’s<br />
<strong>Long</strong>-<strong>Term</strong> <strong>Plan</strong><br />
for the ten years commencing 1 July <strong>2012</strong><br />
The Auditor-General is the auditor of <strong>Hurunui</strong> <strong>District</strong> <strong>Council</strong> (the <strong>District</strong> <strong>Council</strong>). The<br />
Auditor-General has appointed me, Andy Burns, using the staff and resources of Audit<br />
New Zealand, to report on the <strong>Long</strong> <strong>Term</strong> <strong>Plan</strong> (LTP), on her behalf. We have audited the<br />
<strong>District</strong> <strong>Council</strong>’s LTP dated 28 June <strong>2012</strong> for the ten years commencing 1 July <strong>2012</strong>.<br />
The Auditor-General is required by section 94(1) of the Local Government Act 2002 (the Act)<br />
to report on:<br />
<br />
<br />
the extent to which the LTP complies with the requirements of the Act; and<br />
the quality of information and assumptions underlying the forecast information<br />
provided in the LTP.<br />
Opinion<br />
Overall Opinion<br />
In our opinion the <strong>District</strong> <strong>Council</strong>’s LTP dated 28 June <strong>2012</strong> provides a reasonable basis<br />
for long term integrated decision-making by the <strong>District</strong> <strong>Council</strong> and for participation in<br />
decision-making by the public and subsequent accountability to the community about the<br />
activities of the <strong>District</strong> <strong>Council</strong>.<br />
In forming our overall opinion, we considered the specific matters outlined in section 94(1) of<br />
the Act which we report on as follows.<br />
Opinion on Specific Matters Required by the Act<br />
In our view:<br />
<br />
<br />
the <strong>District</strong> <strong>Council</strong> has complied with the requirements of the Act in all material<br />
respects demonstrating good practice for a council of its size and scale within the<br />
context of its environment; and<br />
the underlying information and assumptions used to prepare the LTP provide a<br />
reasonable and supportable basis for the preparation of the forecast information.<br />
Actual results are likely to be different from the forecast information since anticipated events<br />
frequently do not occur as expected and the variation may be material. Accordingly, we<br />
express no opinion as to whether the forecasts will be achieved.<br />
Our report was completed on 28 June <strong>2012</strong>. This is the date at which our opinion is expressed.<br />
281
www.hurunui.govt.nz<br />
282
283<br />
<strong>Hurunui</strong> <strong>Community</strong> <strong>Long</strong> <strong>Term</strong> <strong>Plan</strong> <strong>2012</strong> - <strong>2022</strong>
www.hurunui.govt.nz<br />
Phone: 03 314 8816<br />
Fax: 03 314 9181<br />
email: info@hurunui.govt.nz<br />
web: hurunui.govt.nz<br />
284
Phone: 03 314 8816<br />
Fax: 03 314 9181<br />
Email: info@hurunui.govt.nz<br />
Web: www.hurunui.govt.nz