Download PDF p1-48 - Splash Magazine
Download PDF p1-48 - Splash Magazine
Download PDF p1-48 - Splash Magazine

Create successful ePaper yourself
Turn your PDF publications into a flip-book with our unique Google optimized e-Paper software.
industry news<br />
Healthy winter proves promising<br />
DA figures for the winter months of June<br />
and July show a marked jump.<br />
Pool DA numbers for the Year-to-July showed a one percent<br />
increase over the same period last year. However, comparing<br />
June and July with the same period last year showed a dramatic<br />
increase in DA numbers.<br />
Three states showed improvement over the Year-to-July<br />
figures: New South Wales (18 per cent), Victoria (14 per cent)<br />
and South Australia (11 per cent), while Queensland (-15 per<br />
cent) and Western Australia (-10 per cent) showed declines.<br />
Taking the two months only into consideration, there was a<br />
27 per cent increase over the same period last year. The biggest<br />
increase was for New South Wales (175 percent), while<br />
Queensland had a 27 per cent increase and South Australia a<br />
nine per cent increase. Other States held steady.<br />
It should be taken into consideration that comparisons of<br />
DA numbers against insurance scheme numbers indicate that<br />
some figures could be considerably higher.<br />
Additionally, these figures would exclude most renovations,<br />
pool projects that are included as part of a new home, or<br />
smaller projects under the cost threshold –these projects are<br />
estimated to be an additional 30 per cent, meaning total pools<br />
actually built could be considerably higher than the quoted<br />
DA figures.<br />
However, while these quoted figures may miss some swimming<br />
pools, spas and renovations, they do give an indication of<br />
how the market is trending.<br />
For further information and more complete reports, contact<br />
Magdalene Miller from Cordell Information on 1800 80 60 60.<br />
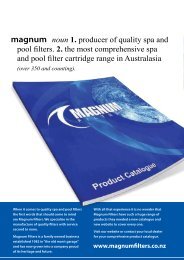
Comparison of Australian pool approvals Year-to-July 2010 with Year-to-July 2009<br />
1500<br />
1200<br />
900<br />
600<br />
300<br />
0<br />
Aug Sept Oct Nov Dec Jan Feb<br />
Year to July 2010<br />
Year to July 2009<br />
Mar April May June July<br />
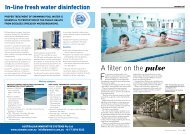
Pool Approvals by State Year-to- July 2010 and Year-to- July 2009<br />
3500<br />
Year to July 10<br />
3000<br />
Year to July 09<br />
2500<br />
2000<br />
1500<br />
1000<br />
Western Melbourne new growth king<br />
The western edge of Melbourne has become the fastest<br />
growing region in Australia, according to new research.<br />
KPMG demographer Bernard Salt said the municipalities<br />
of Wyndham and Melton added 18,000 new residents over<br />
the past 12 months to June 2009. The area has overtaken<br />
the Gold Coast by 1000 residents to become Australia’s<br />
fastest growing region.<br />
Mr Salt said the finding had come as a surprise to KPMG<br />
researchers.<br />
“This extraordinary growth in Melbourne’s West has<br />
come out of the blue,” he said.<br />
“Just ten years earlier this region was attracting approximately<br />
4000 new residents per year, but is now attracting<br />
more people than the Gold Coast.”<br />
Mr Salt said Melbourne was “rebalancing to the West”<br />
due to housing affordability.<br />
“There are new house and land packages on the market<br />
in Werribee for less than $280,000, compared to Melton<br />
South where packages start at around $260,000.”<br />
The research also found that over the next decade the<br />
Western edge was projected to add 175,000 residents and<br />
82,000 dwellings.<br />
500<br />
0<br />
NSW<br />
VIC<br />
QLD<br />
WA<br />
SA<br />
TAS<br />
National dwelling approvals rise in July<br />
ABS Building Approvals show that the total number of<br />
dwellings approved rose in July 2010 following falls in the<br />
previous three months in seasonally adjusted terms.<br />
According to the ABS, New South Wales (9.7%), Victoria<br />
(12.1%), South Australia (8.3%) and Tasmania (4.4%)<br />
recorded more dwelling approvals this month, while Queensland<br />
(-18.3%) and Western Australia (-4.9%) recorded less<br />
dwelling approvals in seasonally adjusted terms.<br />
Private sector houses approved fell 0.1% due to falls in<br />
New South Wales (-5.3%) and Western Australia (-14.4%).<br />
Victoria (6.9%), Queensland (3.2%) and South Australia<br />
(4.8%) all rose.<br />
The value of total building approved fell -1.3% in July in seasonally<br />
adjusted terms. The value of total residential building<br />
rose by 6.6% while non-residential building fell by 15.8%.<br />
Further information is available in Building Approvals,<br />
Australia (cat no. 8731.0) on the ABS website.<br />
16 | SPLASH! www.splashmagazine.com.au