Patterns and regulation of dissolved organic carbon
Patterns and regulation of dissolved organic carbon
Patterns and regulation of dissolved organic carbon

Create successful ePaper yourself
Turn your PDF publications into a flip-book with our unique Google optimized e-Paper software.
DOC in lakes 1215<br />
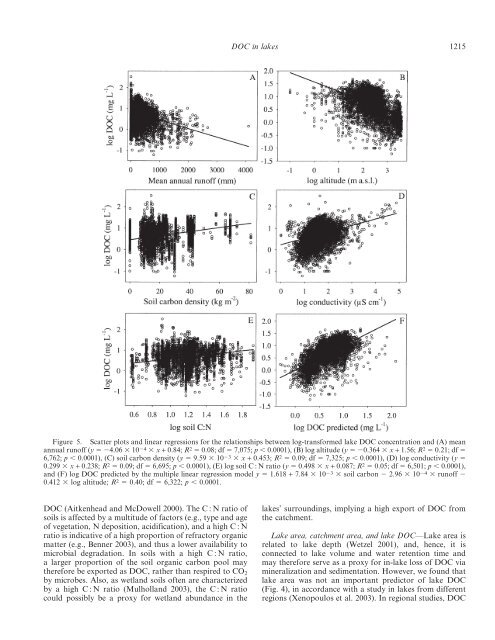
Figure 5. Scatter plots <strong>and</strong> linear regressions for the relationships between log-transformed lake DOC concentration <strong>and</strong> (A) mean<br />
annual run<strong>of</strong>f (y 524.06 3 10 24 3 x + 0.84; R 2 5 0.08; df 5 7,075; p , 0.0001), (B) log altitude (y 520.364 3 x + 1.56; R 2 5 0.21; df 5<br />
6,762; p , 0.0001), (C) soil <strong>carbon</strong> density (y 5 9.59 3 10 23 3 x + 0.453; R 2 5 0.09; df 5 7,325; p , 0.0001), (D) log conductivity (y 5<br />
0.299 3 x + 0.238; R 2 5 0.09; df 5 6,695; p , 0.0001), (E) log soil C : N ratio (y 5 0.498 3 x + 0.087; R 2 5 0.05; df 5 6,501; p , 0.0001),<br />
<strong>and</strong> (F) log DOC predicted by the multiple linear regression model y 5 1.618 + 7.84 3 10 23 3 soil <strong>carbon</strong> 2 2.96 3 10 24 3 run<strong>of</strong>f 2<br />
0.412 3 log altitude; R 2 5 0.40; df 5 6,322; p , 0.0001.<br />
DOC (Aitkenhead <strong>and</strong> McDowell 2000). The C : N ratio <strong>of</strong><br />
soils is affected by a multitude <strong>of</strong> factors (e.g., type <strong>and</strong> age<br />
<strong>of</strong> vegetation, N deposition, acidification), <strong>and</strong> a high C : N<br />
ratio is indicative <strong>of</strong> a high proportion <strong>of</strong> refractory <strong>organic</strong><br />
matter (e.g., Benner 2003), <strong>and</strong> thus a lower availability to<br />
microbial degradation. In soils with a high C : N ratio,<br />
a larger proportion <strong>of</strong> the soil <strong>organic</strong> <strong>carbon</strong> pool may<br />
therefore be exported as DOC, rather than respired to CO 2<br />
by microbes. Also, as wetl<strong>and</strong> soils <strong>of</strong>ten are characterized<br />
by a high C : N ratio (Mulholl<strong>and</strong> 2003), the C : N ratio<br />
could possibly be a proxy for wetl<strong>and</strong> abundance in the<br />
lakes’ surroundings, implying a high export <strong>of</strong> DOC from<br />
the catchment.<br />
Lake area, catchment area, <strong>and</strong> lake DOC—Lake area is<br />
related to lake depth (Wetzel 2001), <strong>and</strong>, hence, it is<br />
connected to lake volume <strong>and</strong> water retention time <strong>and</strong><br />
may therefore serve as a proxy for in-lake loss <strong>of</strong> DOC via<br />
mineralization <strong>and</strong> sedimentation. However, we found that<br />
lake area was not an important predictor <strong>of</strong> lake DOC<br />
(Fig. 4), in accordance with a study in lakes from different<br />
regions (Xenopoulos et al. 2003). In regional studies, DOC