Patterns and regulation of dissolved organic carbon
Patterns and regulation of dissolved organic carbon
Patterns and regulation of dissolved organic carbon

You also want an ePaper? Increase the reach of your titles
YUMPU automatically turns print PDFs into web optimized ePapers that Google loves.
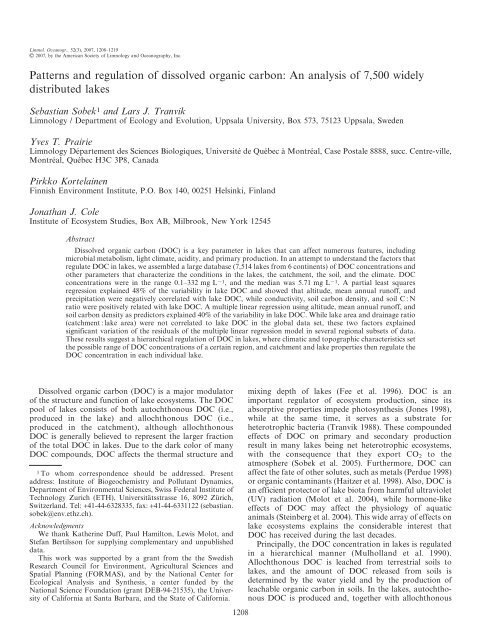
Limnol. Oceanogr., 52(3), 2007, 1208–1219<br />
E 2007, by the American Society <strong>of</strong> Limnology <strong>and</strong> Oceanography, Inc. 1208<br />
<strong>Patterns</strong> <strong>and</strong> <strong>regulation</strong> <strong>of</strong> <strong>dissolved</strong> <strong>organic</strong> <strong>carbon</strong>: An analysis <strong>of</strong> 7,500 widely<br />
distributed lakes<br />
Sebastian Sobek 1 <strong>and</strong> Lars J. Tranvik<br />
Limnology / Department <strong>of</strong> Ecology <strong>and</strong> Evolution, Uppsala University, Box 573, 75123 Uppsala, Sweden<br />
Yves T. Prairie<br />
Limnology Département des Sciences Biologiques, Université de Québec à Montréal, Case Postale 8888, succ. Centre-ville,<br />
Montréal, Québec H3C 3P8, Canada<br />
Pirkko Kortelainen<br />
Finnish Environment Institute, P.O. Box 140, 00251 Helsinki, Finl<strong>and</strong><br />
Jonathan J. Cole<br />
Institute <strong>of</strong> Ecosystem Studies, Box AB, Milbrook, New York 12545<br />
Abstract<br />
Dissolved <strong>organic</strong> <strong>carbon</strong> (DOC) is a key parameter in lakes that can affect numerous features, including<br />
microbial metabolism, light climate, acidity, <strong>and</strong> primary production. In an attempt to underst<strong>and</strong> the factors that<br />
regulate DOC in lakes, we assembled a large database (7,514 lakes from 6 continents) <strong>of</strong> DOC concentrations <strong>and</strong><br />
other parameters that characterize the conditions in the lakes, the catchment, the soil, <strong>and</strong> the climate. DOC<br />
concentrations were in the range 0.1–332 mg L 21 , <strong>and</strong> the median was 5.71 mg L 21 . A partial least squares<br />
regression explained 48% <strong>of</strong> the variability in lake DOC <strong>and</strong> showed that altitude, mean annual run<strong>of</strong>f, <strong>and</strong><br />
precipitation were negatively correlated with lake DOC, while conductivity, soil <strong>carbon</strong> density, <strong>and</strong> soil C : N<br />
ratio were positively related with lake DOC. A multiple linear regression using altitude, mean annual run<strong>of</strong>f, <strong>and</strong><br />
soil <strong>carbon</strong> density as predictors explained 40% <strong>of</strong> the variability in lake DOC. While lake area <strong>and</strong> drainage ratio<br />
(catchment : lake area) were not correlated to lake DOC in the global data set, these two factors explained<br />
significant variation <strong>of</strong> the residuals <strong>of</strong> the multiple linear regression model in several regional subsets <strong>of</strong> data.<br />
These results suggest a hierarchical <strong>regulation</strong> <strong>of</strong> DOC in lakes, where climatic <strong>and</strong> topographic characteristics set<br />
the possible range <strong>of</strong> DOC concentrations <strong>of</strong> a certain region, <strong>and</strong> catchment <strong>and</strong> lake properties then regulate the<br />
DOC concentration in each individual lake.<br />
Dissolved <strong>organic</strong> <strong>carbon</strong> (DOC) is a major modulator<br />
<strong>of</strong> the structure <strong>and</strong> function <strong>of</strong> lake ecosystems. The DOC<br />
pool <strong>of</strong> lakes consists <strong>of</strong> both autochthonous DOC (i.e.,<br />
produced in the lake) <strong>and</strong> allochthonous DOC (i.e.,<br />
produced in the catchment), although allochthonous<br />
DOC is generally believed to represent the larger fraction<br />
<strong>of</strong> the total DOC in lakes. Due to the dark color <strong>of</strong> many<br />
DOC compounds, DOC affects the thermal structure <strong>and</strong><br />
1 To whom correspondence should be addressed. Present<br />
address: Institute <strong>of</strong> Biogeochemistry <strong>and</strong> Pollutant Dynamics,<br />
Department <strong>of</strong> Environmental Sciences, Swiss Federal Institute <strong>of</strong><br />
Technology Zurich (ETH), Universitätsstrasse 16, 8092 Zürich,<br />
Switzerl<strong>and</strong>. Tel: +41-44-6328335, fax: +41-44-6331122 (sebastian.<br />
sobek@env.ethz.ch).<br />
Acknowledgments<br />
We thank Katherine Duff, Paul Hamilton, Lewis Molot, <strong>and</strong><br />
Stefan Bertilsson for supplying complementary <strong>and</strong> unpublished<br />
data.<br />
This work was supported by a grant from the the Swedish<br />
Research Council for Environment, Agricultural Sciences <strong>and</strong><br />
Spatial Planning (FORMAS), <strong>and</strong> by the National Center for<br />
Ecological Analysis <strong>and</strong> Synthesis, a center funded by the<br />
National Science Foundation (grant DEB-94-21535), the University<br />
<strong>of</strong> California at Santa Barbara, <strong>and</strong> the State <strong>of</strong> California.<br />
mixing depth <strong>of</strong> lakes (Fee et al. 1996). DOC is an<br />
important regulator <strong>of</strong> ecosystem production, since its<br />
absorptive properties impede photosynthesis (Jones 1998),<br />
while at the same time, it serves as a substrate for<br />
heterotrophic bacteria (Tranvik 1988). These compounded<br />
effects <strong>of</strong> DOC on primary <strong>and</strong> secondary production<br />
result in many lakes being net heterotrophic ecosystems,<br />
with the consequence that they export CO 2 to the<br />
atmosphere (Sobek et al. 2005). Furthermore, DOC can<br />
affect the fate <strong>of</strong> other solutes, such as metals (Perdue 1998)<br />
or <strong>organic</strong> contaminants (Haitzer et al. 1998). Also, DOC is<br />
an efficient protector <strong>of</strong> lake biota from harmful ultraviolet<br />
(UV) radiation (Molot et al. 2004), while hormone-like<br />
effects <strong>of</strong> DOC may affect the physiology <strong>of</strong> aquatic<br />
animals (Steinberg et al. 2004). This wide array <strong>of</strong> effects on<br />
lake ecosystems explains the considerable interest that<br />
DOC has received during the last decades.<br />
Principally, the DOC concentration in lakes is regulated<br />
in a hierarchical manner (Mulholl<strong>and</strong> et al. 1990).<br />
Allochthonous DOC is leached from terrestrial soils to<br />
lakes, <strong>and</strong> the amount <strong>of</strong> DOC released from soils is<br />
determined by the water yield <strong>and</strong> by the production <strong>of</strong><br />
leachable <strong>organic</strong> <strong>carbon</strong> in soils. In the lakes, autochthonous<br />
DOC is produced <strong>and</strong>, together with allochthonous
DOC in lakes 1209<br />
DOC, is subject to processes that modify its concentration.<br />
Several regional studies have reported on DOC concentration<br />
levels <strong>and</strong> <strong>regulation</strong> patterns (e.g., Rasmussen et al.<br />
1989; Kortelainen 1993; Xenopoulos et al. 2003). In these<br />
studies, catchment properties such as drainage ratio<br />
(catchment : lake area), proportion <strong>of</strong> wetl<strong>and</strong>s, proportion<br />
<strong>of</strong> upstream lakes, watershed slope, <strong>and</strong> lake area have<br />
<strong>of</strong>ten been found to be related to lake DOC concentration.<br />
On the other h<strong>and</strong>, climatic factors, such as precipitation<br />
<strong>and</strong> run<strong>of</strong>f, have also been shown to influence the DOC<br />
concentration in lakes (Andersson et al. 1991; Pace <strong>and</strong><br />
Cole 2002). Furthermore, internal loss processes due to<br />
mineralization <strong>and</strong> sedimentation (Algesten et al. 2004), as<br />
well as dilution due to precipitation on the lake surface<br />
(Engstrom 1987), all affect lake DOC concentrations.<br />
While analyses <strong>of</strong> the <strong>regulation</strong> <strong>of</strong> DOC in confined<br />
regions have been numerous, we know <strong>of</strong> only a single<br />
attempt to examine this <strong>regulation</strong> at a global scale.<br />
Xenopoulos et al. (2003) examined data from 745 lakes in<br />
11 geographical regions <strong>and</strong> found that the proportion <strong>of</strong><br />
wetl<strong>and</strong>s in the catchment <strong>and</strong> lake elevation were<br />
important predictors <strong>of</strong> DOC in lakes across diverse<br />
geographical regions. By scaling up about 10-fold from<br />
the Xenopoulos et al. (2003) study, we present a new<br />
analysis <strong>of</strong> the <strong>regulation</strong> <strong>of</strong> DOC concentration in lakes,<br />
<strong>and</strong> we explicitly include climate as a driving variable.<br />
Methods<br />
Data collection—We assembled data on DOC concentrations<br />
in the water <strong>of</strong> global lakes from the published<br />
literature, unpublished studies, <strong>and</strong> national lake surveys.<br />
In cases where the concentration <strong>of</strong> total <strong>organic</strong> <strong>carbon</strong><br />
(TOC) was given, it was converted to DOC by multiplying<br />
by 0.9 (Wetzel 2001). Along with DOC concentration, we<br />
recorded pH <strong>and</strong> conductivity, as well as lake surface area,<br />
catchment area, lake depth, latitude, longitude, altitude,<br />
<strong>and</strong> time <strong>of</strong> sampling. Since not all <strong>of</strong> these variables are<br />
routinely reported, missing values are frequent in the data<br />
set.<br />
To obtain matching soil <strong>and</strong> climate data, we used<br />
ArcGIS 9.0 <strong>and</strong> fitted the lake data to a number <strong>of</strong> globalscale<br />
databases that are freely available on the internet.<br />
Mean annual air temperature <strong>and</strong> mean annual precipitation<br />
were acquired from New et al. (2000), mean annual<br />
run<strong>of</strong>f was acquired from Fekete et al. (2000), <strong>and</strong> mean<br />
annual evaporation <strong>and</strong> water balance were acquired from<br />
Ahn <strong>and</strong> Tateishi (1994). The density <strong>of</strong> <strong>carbon</strong> <strong>and</strong><br />
nitrogen in the top 1 m <strong>of</strong> soil was taken from the Global<br />
Soil Data Task Group database (2000). These databases<br />
consist <strong>of</strong> gridded data that were extrapolated to the global<br />
l<strong>and</strong> area from a network <strong>of</strong> measurement data. The grid<br />
sizes were ,55 km for temperature, precipitation, evaporation,<br />
water balance, <strong>and</strong> run<strong>of</strong>f, <strong>and</strong> ,1 km for soil<br />
<strong>carbon</strong> <strong>and</strong> nitrogen. Data on global l<strong>and</strong> cover, reflecting<br />
the terrestrial vegetation or ecosystem type, were acquired<br />
from the Global L<strong>and</strong> Cover Characteristics database<br />
(1997), classified according to Olson (1994). L<strong>and</strong> cover<br />
data are based on satellite imagery at a spatial resolution <strong>of</strong><br />
,1 km. The lake coordinates were used to match each lake<br />
to the database grids within a geographic information<br />
system (GIS) framework. For some lakes, matches with the<br />
high-resolution databases on soil characteristics <strong>and</strong> l<strong>and</strong><br />
cover returned missing values <strong>and</strong> the value ‘‘inl<strong>and</strong><br />
water,’’ respectively. However, many lake coordinates refer<br />
to the outlet <strong>of</strong> the lake rather than the center, <strong>and</strong> thus<br />
only 503 lakes were fitted to the l<strong>and</strong>-cover type ‘‘inl<strong>and</strong><br />
water,’’ independent <strong>of</strong> lake area.<br />
Statistical analyses—Many <strong>of</strong> the relationships between<br />
the variables in our data set are not strictly linear.<br />
However, since linear regression generally yielded higher<br />
degrees <strong>of</strong> explanation than nonlinear regressions, all<br />
correlation analyses between variables <strong>of</strong> the data set were<br />
conducted by means <strong>of</strong> linear regression. Variables with<br />
skewed distributions were log-transformed in order to<br />
approach normality. The reported R 2 values were adjusted<br />
for the number <strong>of</strong> parameters in the model. Along with the<br />
univariate linear regressions, we also performed multivariate<br />
data analysis. We used partial least squares regression<br />
(PLS, e.g., Höskuldsson 1988) in order to find out how<br />
different variables perform as predictors <strong>of</strong> lake DOC. The<br />
most important advantage <strong>of</strong> PLS compared to ordinary<br />
multiple regression is that PLS is relatively insensitive<br />
against dependence <strong>of</strong> X variables on each other (cocorrelation)<br />
<strong>and</strong> deviations from normality. Also, the PLS<br />
algorithm is very tolerant to missing values. A PLS<br />
regression extracts for each <strong>of</strong> the X variables the degree<br />
<strong>of</strong> explanation <strong>of</strong> the Y variable (i.e., DOC), as well as the<br />
relationships to the other X variables, <strong>and</strong> it shows the<br />
results in a two-dimensional scatter plot. In this way,<br />
a complex multidimensional data matrix can be dissected<br />
<strong>and</strong> shown in one simple graph. More precisely, PLS<br />
regressions place uncorrelated latent components (i.e.,<br />
orthogonal axes) into the X data space in order to<br />
maximally explain the variance in the Y data <strong>and</strong> the X<br />
data. Thereby, PLS uses the variance in the X data to<br />
explain the variance in the Y data. Only latent components<br />
that explain significant variability, as determined by a crossvalidation<br />
procedure (see Eriksson et al. 2001 for details),<br />
are included in the model. The results <strong>of</strong> a PLS analysis are<br />
explored in a series <strong>of</strong> plots, one <strong>of</strong> which is the ‘‘loadings<br />
plot,’’ which depicts the importance <strong>of</strong> the different X<br />
variables in explaining the Y variable, <strong>and</strong> the relationships<br />
<strong>of</strong> the X variables with each other. The first component <strong>of</strong><br />
a PLS (horizontal axis in a loadings plot) always explains<br />
more <strong>of</strong> the variance than the second component (vertical<br />
axis), <strong>and</strong> it is therefore <strong>of</strong> higher importance when<br />
interpreting the loadings plot. The correlation structure <strong>of</strong><br />
the data set is shown in the spatial distribution <strong>of</strong> variables<br />
in the plot area. Variables are positively correlated when<br />
situated close to each other, while they are negatively<br />
correlated if they are placed at opposite ends <strong>of</strong> the plot.<br />
Variables in the center <strong>of</strong> the plot are at most poorly related<br />
to the variables at the outer ends <strong>of</strong> the plot area.<br />
The performance <strong>of</strong> the PLS model is expressed in the<br />
terms R 2 Y, R 2 X, <strong>and</strong> Q 2 . R 2 Y <strong>and</strong> R 2 X are comparable to<br />
R 2 in linear regression <strong>and</strong> express how much <strong>of</strong> the<br />
variance in Y <strong>and</strong> X is explained by the latent components.<br />
Q 2 is a measure <strong>of</strong> the predictive power <strong>of</strong> the PLS model.
1210 Sobek et al.<br />
Figure 1. World map showing the geographical distribution <strong>of</strong> the lakes included in this study. The color grading <strong>of</strong> the points<br />
reflects the DOC concentration (mg L 21 ) <strong>of</strong> the lakes. The background colors <strong>of</strong> the map illustrate the major l<strong>and</strong>-cover types according<br />
to the Global Ecosystem framework (Olson 1994).<br />
If Q 2 is similar to R 2 Y, the model is not overfitted.<br />
Calculated models were validated using a permutation test,<br />
which results in a measure <strong>of</strong> the intrinsic ‘‘background<br />
correlation’’ <strong>of</strong> the data, i.e., a baseline in the coefficients<br />
R 2 Y <strong>and</strong> Q 2 that is not indicative for any correlations<br />
between variables but only due to chance. The lower this<br />
background correlation, the better <strong>and</strong> more stable the<br />
model. Highly skewed variables (skewness . 2.0 <strong>and</strong><br />
min : max ratio , 0.1) were log-transformed prior to<br />
modeling in order to increase model performance; these<br />
were lake area, catchment area, drainage ratio, altitude,<br />
conductivity, soil C : N, <strong>and</strong> DOC. All PLS modeling was<br />
done on the SIMCA-P 9.0 s<strong>of</strong>tware (Umetrics AB).<br />
In an attempt to predict lake DOC from a simple model<br />
based on a few easily accessible parameters, we performed<br />
a multiple linear regression analysis with the X variables<br />
that the PLS identified as important predictors <strong>of</strong> lake<br />
DOC. As for the PLS modeling, highly skewed variables<br />
were log-transformed prior to analysis in order to approach<br />
normality.<br />
Results<br />
In total, we managed to compile data from 7,514 lakes,<br />
most <strong>of</strong> which are situated between 25uN <strong>and</strong> 85uN (Fig. 1;<br />
Table 1). Even though large areas <strong>of</strong> the world are<br />
underrepresented or completely missing (particularly the<br />
tropics, Africa, Asia, <strong>and</strong> South America), the data set<br />
covers a wide climatic gradient that stretches from the high<br />
Arctic to the subtropics, which allowed us to analyze the<br />
relationship between lake DOC concentration <strong>and</strong> climatic<br />
conditions.<br />
Median DOC concentration for all 7,514 lakes was<br />
5.71 mg L 21 , ranging from 0.1 mg L 21 to 332 mg L 21 .<br />
Mean DOC concentration was 7.58 6 0.19 mg L 21 (695%<br />
confidence interval). The frequency distribution <strong>of</strong> DOC<br />
was skewed to the right (Fig. 2), <strong>and</strong> was best modelled<br />
with a Gamma distribution:<br />
y~ ðx=5:886Þ 0:970 |e ({x=5:886) |½1=5:886|C(1:218)Š ð1Þ<br />
In 87% <strong>of</strong> the lakes, DOC was between 1 <strong>and</strong> 20 mg L 21 ,<br />
while 8.3% <strong>of</strong> the lakes had concentrations less than<br />
1mgL 21 . Lakes between 20 <strong>and</strong> 40 mg L 21 were few<br />
(4.2%), <strong>and</strong> only 0.4% <strong>of</strong> the lakes had DOC concentrations<br />
above 40 mg L 21 (Fig. 3A). In 55% <strong>of</strong> the lakes,<br />
DOC concentration was above 5 mg L 21 , which has been<br />
suggested to be a threshold value for the transition between<br />
net autotrophy <strong>and</strong> net heterotrophy in lakes (Jansson et al.<br />
2000; Prairie et al. 2002). Hence, it is likely that more than<br />
half <strong>of</strong> the lakes in our data set are primarily net<br />
heterotrophic ecosystems.<br />
We grouped the lakes according to l<strong>and</strong> cover (Olson<br />
1994), which largely reflects the terrestrial vegetation or<br />
ecosystem type (Fig. 3). Grouping the lakes in this way<br />
reveals several interesting patterns. First, arctic lakes are<br />
generally characterized by low DOC concentrations<br />
(Fig. 3B; l<strong>and</strong>-cover types wooded tundra to bare desert,<br />
corresponding to an annual mean temperature <strong>of</strong> ,24uC).<br />
Second, boreal lakes display a tendency toward higher<br />
DOC concentration (Fig. 3B; l<strong>and</strong>-cover types deciduous<br />
<strong>and</strong> mixed boreal forest to deciduous conifer forest,<br />
corresponding to an annual mean temperature <strong>of</strong> 0.5–
DOC in lakes 1211<br />
Table 1. Sources <strong>of</strong> data for the present study. n.r.: not reported; epi: integrated epilimnetic sample; whole: integrated sample from<br />
the whole water column.<br />
Data source Geographical location Sample depth (m) No. <strong>of</strong> lakes<br />
Antoniades et al. (2003) Canadian Arctic n.r. 30<br />
Arts et al. (2000) Saskatchewan, Canada n.r. 36<br />
S. Bertilsson (unpubl. data) Canadian Arctic 0–0.5 15<br />
Carignan et al. (2000) Quebec, Canada epi 12<br />
Curtis <strong>and</strong> Schindler (1997) Ontario, Canada 0.3 11<br />
D’Arcy <strong>and</strong> Carignan (1997) Quebec, Canada epi 32<br />
del Giorgio et al. (1999) Quebec, Canada epi 9<br />
Dillon <strong>and</strong> Molot (1997) Ontario, Canada whole 7<br />
Duff et al. (1999) Northern Russia 0.5–1 80<br />
Eastern Lake Survey (1984) U.S.A. 1.5 1,764<br />
European Environment Agency Waterbase (1949–2004) Europe n.r. 306<br />
Ellis-Evans et al. (2001) Svalbard 0.2 15<br />
Finnish Lake Survey Finl<strong>and</strong> 1 978<br />
Gorniak et al. (1999) Pol<strong>and</strong> 0 3<br />
Hamilton et al. (2001) Canadian Arctic 0.6–0.8 179<br />
Hope et al. (1996) Wisconsin, U.S.A. 0.1 27<br />
Imai et al. (2003) Japan n.r. 1<br />
Jones et al. (1997) Great Britian epi 1<br />
Jonsson et al. (2003) Sweden 0.5 or 1 49<br />
Kelly et al. (2001) Canada 0.05–0.1 11<br />
Kling et al. (2000) Alaska, U.S.A. outlet 10<br />
Laurion et al. (2000) Alps <strong>and</strong> Pyrenees, Europe n.r. 26<br />
Lim et al. (2001, 2005) Canadian Arctic 0.3 84<br />
McKnight et al. (1997) Rocky Mountains, Colorado, U.S.A. n.r. 3<br />
Michelutti et al. (2002a,b) Canadian Arctic n.r. 72<br />
Molot et al. (2004) Canada n.r. 228<br />
Müller et al. (1998) Switzerl<strong>and</strong> 0.2 68<br />
Pienitz et al. (1997a,b) Central Canada 0.5 83<br />
Y. Prairie (unpubl. data) Quebec, Canada epi 76<br />
Rae et al. (2001) New Zeal<strong>and</strong> n.r. 11<br />
Rühl<strong>and</strong> et al. (2003) Central Canada 0.3 56<br />
Rai <strong>and</strong> Hill (1981) Brazil n.r. 1<br />
Sabbe et al. (2004) Antarctic 3 12<br />
Scully et al. (1996) Ontario, Canada n.r. 15<br />
Swedish Lake Monitoring (2000) Sweden 0.5 or 1 2,432<br />
Sobek et al. (2003) Sweden 0–0.5 33<br />
Western Lake Survey (1985) U.S.A. 1.5 738<br />
Total 7,514<br />
4uC). Third, lakes on the northern Great Plains in<br />
Saskatchewan, Canada, represent the highest DOC concentrations<br />
in the data set (Fig. 3C). We could not<br />
distinguish any distinct patterns in DOC for lakes situated<br />
in the warmer climate zones (upper part <strong>of</strong> Fig. 3B).<br />
The PLS regression extracted three significant components<br />
from the data set, which collectively explain 49% <strong>of</strong><br />
the variance in lake DOC (R 2 Y 5 0.48) <strong>and</strong> 13% <strong>of</strong> the<br />
variance in the X variables (R 2 X 5 0.13). The PLS model is<br />
highly robust <strong>and</strong> not overfitted, as model predictability is<br />
high (Q 2 5 0.47) <strong>and</strong> background correlation in R 2 Y is low<br />
(0.003). The PLS loadings plot (Fig. 4) shows the<br />
correlation structure between lake DOC <strong>and</strong> the different<br />
X variables on the first two axes <strong>of</strong> the model; the third axis<br />
explains only 2% <strong>of</strong> the variability in DOC <strong>and</strong> is omitted<br />
from the plot for reasons <strong>of</strong> clarity.<br />
The PLS analysis demonstrates that the terrestrial l<strong>and</strong><br />
cover (e.g., conifer boreal forest, barren tundra) strongly<br />
affects DOC in lakes (Fig. 4). Interestingly, while the l<strong>and</strong>cover<br />
type ‘‘conifer boreal forest’’ is positively related with<br />
lake DOC, ‘‘cool conifer forest’’ is negatively related to<br />
lake DOC; however, cool conifer forest is confined to highaltitude<br />
areas such as the Rocky Mountains <strong>and</strong> the Alps,<br />
which may explain the relatively low DOC concentrations<br />
found in these lakes (see discussion <strong>of</strong> the role <strong>of</strong> altitude<br />
below). Further, the PLS shows that lake DOC is<br />
negatively related to mean annual run<strong>of</strong>f, precipitation,<br />
<strong>and</strong> altitude, <strong>and</strong> it is positively related to conductivity, soil<br />
<strong>carbon</strong> density, <strong>and</strong> soil C : N ratio. All these variables<br />
explain significant variability in lake DOC. The positive<br />
relationship <strong>of</strong> longitude on lake DOC reflects that many<br />
high-DOC lakes are situated in boreal Sc<strong>and</strong>inavia (east <strong>of</strong><br />
Greenwich, i.e., positive longitude values), <strong>and</strong> many low-<br />
DOC lakes are in the Canadian Arctic <strong>and</strong> Rocky<br />
Mountains (west <strong>of</strong> Greenwich, i.e., negative longitude<br />
values). Neither lake area nor drainage ratio (catchment :<br />
lake area) were important predictors <strong>of</strong> lake DOC<br />
concentration (Fig. 4). The relationships between lake<br />
DOC <strong>and</strong> the most important variables <strong>of</strong> the PLS are<br />
also shown as bivariate scatter plots (Fig. 5). None <strong>of</strong> these
1212 Sobek et al.<br />
Figure 2. Histogram <strong>of</strong> the DOC concentration in the 7,514<br />
lakes <strong>of</strong> this study. The arrows indicate DOC concentrations that<br />
were observed in only a few lakes. One observation (332 mg L 21 )<br />
was omitted from the graph for reasons <strong>of</strong> clarity. The curve<br />
depicts the gamma distribution that was fitted to the data (see<br />
Results section).<br />
bivariate linear regressions individually explains more than<br />
21% <strong>of</strong> the variability in lake DOC, indicating that the high<br />
predictability <strong>of</strong> the PLS model (R 2 Y 5 0.48) is attributable<br />
to the cumulative effect <strong>of</strong> many variables rather than to<br />
the effect <strong>of</strong> any single variable.<br />
A multiple linear regression, using the most important<br />
predictors as identified by the PLS, resulted in the<br />
following model (Fig. 5F):<br />
log DOC~1:62z7:84|10 {3 |soil <strong>carbon</strong>{2:96|10 {4<br />
|run<strong>of</strong>f{0:41| log altitude;<br />
R 2 ~0:40; pv0:0001; F 3,6322 ~1,385<br />
where the units are mg L 21 for DOC, kg m 22 for soil<br />
<strong>carbon</strong> density, mm for mean annual run<strong>of</strong>f, <strong>and</strong> meters<br />
above sea level for altitude. Including conductivity into the<br />
model increased the degree <strong>of</strong> explanation by 4%; however,<br />
conductivity is strongly negatively correlated with altitude<br />
(R 2 5 0.26) <strong>and</strong> was therefore excluded from the model.<br />
Likewise, precipitation was excluded due to its strong<br />
positive correlation with run<strong>of</strong>f (R 2 5 0.50). All other<br />
variables in the data set added minimally to the degree <strong>of</strong><br />
explanation <strong>and</strong> were therefore not included in the model.<br />
Discussion<br />
The influence <strong>of</strong> climate <strong>and</strong> topography on lake DOC—<br />
Climatic conditions are highly important for the DOC<br />
concentration in lakes (Figs. 3, 4). In the Arctic, permafrost<br />
limits the exportable soil <strong>carbon</strong> pool, <strong>and</strong> together with<br />
low terrestrial productivity, this results in generally low<br />
DOC concentrations in arctic lakes. In the cool climate <strong>of</strong><br />
boreal forests, soils are <strong>of</strong>ten <strong>organic</strong>-rich because the input<br />
<strong>of</strong> <strong>organic</strong> matter from the vegetation is high, <strong>and</strong> the<br />
microbial degradation rates are relatively low due to low<br />
ð2Þ<br />
temperatures <strong>and</strong> the high frequency <strong>of</strong> waterlogged soils<br />
(e.g., in wetl<strong>and</strong>s). Hence, high-DOC lakes are comparatively<br />
frequent in the boreal forest zone. Lakes situated on<br />
the northern Great Plains in Saskatchewan frequently lack<br />
an outflow, <strong>and</strong> due to high evaporation, solutes are<br />
concentrated in the lake water (Curtis <strong>and</strong> Adams 1995).<br />
Accordingly, the high DOC concentrations in the Saskatchewan<br />
lakes are accompanied by high conductivities<br />
(up to 74,300 mS cm 21 ). Hence, climate affects both the<br />
production <strong>and</strong> mobilization <strong>of</strong> <strong>organic</strong> <strong>carbon</strong> from<br />
terrestrial soils <strong>and</strong> the hydrological balance <strong>of</strong> lakes <strong>and</strong><br />
therefore plays a superordinate role in the <strong>regulation</strong> <strong>of</strong><br />
DOC concentrations in lakes.<br />
The negative relationship between altitude <strong>and</strong> lake<br />
DOC (Fig. 5B; Eq. 2) shows that highl<strong>and</strong> lakes frequently<br />
have a lower DOC concentration than lowl<strong>and</strong> lakes. As<br />
illustrated by the PLS loadings plot (Fig. 4), the higher in<br />
a l<strong>and</strong>scape a lake is situated, the higher the precipitation,<br />
which leads to high area-specific run<strong>of</strong>f. High run<strong>of</strong>f is in<br />
turn associated with low soil <strong>carbon</strong> density <strong>and</strong> low lake<br />
DOC concentration (Fig. 4; see also discussion <strong>of</strong> run<strong>of</strong>f<br />
below). Lowl<strong>and</strong> lakes, on the contrary, experience less<br />
precipitation <strong>and</strong> area-specific run<strong>of</strong>f, which results in<br />
longer water residence times <strong>and</strong> higher soil <strong>carbon</strong> density.<br />
Apart from being related to precipitation <strong>and</strong> run<strong>of</strong>f,<br />
altitude also carries some information about the l<strong>and</strong>scape<br />
topography because catchments can be assumed to become<br />
increasingly hilly with increasing altitude. Several studies<br />
have shown that catchment slope is negatively correlated<br />
with DOC concentration, probably due to thicker <strong>organic</strong><br />
soil horizons (Rasmussen et al. 1989) <strong>and</strong> a higher degree <strong>of</strong><br />
waterlogged soils in catchments with flat topography<br />
(D’Arcy <strong>and</strong> Carignan 1997). Hence, flat topography is<br />
coupled to the abundance <strong>of</strong> wetl<strong>and</strong>s, which in turn is<br />
a major predictor <strong>of</strong> lake DOC both regionally (e.g.<br />
Kortelainen 1993) <strong>and</strong> in lakes from different regions<br />
(Xenopoulos et al. 2003). Thus, altitude is a master variable<br />
that incorporates climatic, topographic, <strong>and</strong> edaphic effects<br />
on lake DOC.<br />
The effect <strong>of</strong> run<strong>of</strong>f on lake DOC—We found that run<strong>of</strong>f<br />
was strongly negatively related to lake DOC concentration<br />
(Figs. 4, 5A). This negative correlation was repeated when<br />
we divided the data into 73 subsets <strong>of</strong> lakes from different<br />
confined geographical regions (containing at least 15 lakes),<br />
<strong>and</strong> plotted run<strong>of</strong>f against log DOC for these regional<br />
subsets (data not shown). This is surprising because many<br />
studies have shown that the export <strong>of</strong> DOC from terrestrial<br />
soils is enhanced by increases in precipitation or run<strong>of</strong>f<br />
(Andersson et al. 1991; Hinton et al. 1997; Mulholl<strong>and</strong><br />
2003). Likewise, two decades <strong>of</strong> relative drought were<br />
observed to lead to a decline in DOC concentrations<br />
(Schindler et al. 1997).<br />
The overall effect <strong>of</strong> high precipitation <strong>and</strong> run<strong>of</strong>f<br />
depends on the relationships between the DOC leaching<br />
capacity <strong>of</strong> the soils, the yield <strong>and</strong> flow path <strong>of</strong> water, <strong>and</strong><br />
the fate <strong>of</strong> DOC in the lake. The DOC leaching capacity <strong>of</strong><br />
soils at steady state is dependent on the production <strong>of</strong><br />
leachable <strong>organic</strong> <strong>carbon</strong>, <strong>and</strong> thus it is linked to primary<br />
productivity <strong>and</strong> microbial degradation (Mulholl<strong>and</strong> 2003).
DOC in lakes 1213<br />
Figure 3. Box <strong>and</strong> whisker-plot <strong>of</strong> the distribution <strong>of</strong> DOC concentration (A) for all lakes,<br />
(B) for lakes divided into different l<strong>and</strong>-cover types, <strong>and</strong> (C) for lakes in Saskatchewan, Canada.<br />
In (B), the l<strong>and</strong>-cover types have been sorted according to the average mean annual temperature.<br />
The boxes display the median <strong>and</strong> the quartiles, the whiskers represent the 10% <strong>and</strong> 90%<br />
percentiles, <strong>and</strong> the points represent the 5% <strong>and</strong> 95% percentiles. Only l<strong>and</strong>-cover types<br />
containing 10 or more lakes are shown. The l<strong>and</strong>-cover types ‘‘inl<strong>and</strong> water’’ <strong>and</strong> ‘‘sea water’’<br />
were omitted from the plot because they are not indicative <strong>of</strong> climate or geography.<br />
If high run<strong>of</strong>f <strong>and</strong> rapid washout <strong>of</strong> DOC from soils is not<br />
balanced by a high production <strong>of</strong> leachable <strong>organic</strong> <strong>carbon</strong><br />
in soils, it will in a long-term perspective lead to a reduced<br />
<strong>organic</strong> <strong>carbon</strong> export. Further, the flow path <strong>of</strong> water in<br />
the catchment is important. In most soils, a rise in the water<br />
table means that the main water flow path gets closer to the<br />
soil surface, <strong>and</strong> the water will therefore be increasingly in<br />
contact with the <strong>organic</strong>-rich uppermost soil horizons<br />
(Mulholl<strong>and</strong> 2003), leading to higher DOC export rates. In<br />
wetl<strong>and</strong>s, with their water-saturated soils, however, a rising<br />
water table will lead to increased surface water flow, <strong>and</strong><br />
thus a decreased contact <strong>of</strong> the main water flow path with<br />
the <strong>organic</strong>-rich uppermost soil layers, leading to lower<br />
DOC export (Schiff et al. 1998). Lastly, high run<strong>of</strong>f results<br />
in rapid flushing <strong>of</strong> lakes, which decreases the opportunity<br />
for in-lake loss <strong>of</strong> DOC (Algesten et al. 2004). On the other<br />
h<strong>and</strong>, high run<strong>of</strong>f <strong>and</strong> precipitation lead to an increased<br />
input <strong>of</strong> water to the lake, implying dilution <strong>and</strong> thus lower<br />
concentration <strong>of</strong> DOC.<br />
The fact that many regional studies on the temporal<br />
variability <strong>of</strong> DOC export have reported positive relationships<br />
with run<strong>of</strong>f may therefore either be due to the fact
1214 Sobek et al.<br />
Figure 4. Loadings plot <strong>of</strong> the partial least squares regression (PLS) analysis (total model<br />
R 2 Y 5 0.48). The graph depicts the correlation structures between the X variables <strong>and</strong> DOC<br />
concentration; variables situated along the same directional axis correlate positively with each<br />
other; variables situated at opposite ends <strong>of</strong> the plot correlate negatively with each other;<br />
variables situated in the center <strong>of</strong> the plot are poor predictors <strong>of</strong> DOC. The horizontal axis<br />
explains 38% <strong>of</strong> the variability in lake DOC, the vertical axis, 8%, <strong>and</strong> the third axis (explaining<br />
2%) was omitted for reasons <strong>of</strong> clarity. The square depicts the Y variable (DOC); circles depict<br />
continuous predictor variables; triangles depict l<strong>and</strong>-cover types. The following variables were<br />
log-transformed in order to approach normality: lake area, catchment area, drainage ratio,<br />
altitude, conductivity, soil C : N <strong>and</strong> DOC. The text labels for l<strong>and</strong>-cover types in the center <strong>of</strong> the<br />
plot were omitted for reasons <strong>of</strong> clarity.<br />
that the <strong>carbon</strong> budget <strong>of</strong> the studied l<strong>and</strong>scapes is not in<br />
steady state (i.e., increased run<strong>of</strong>f exports more DOC than<br />
is produced in soils, implying that observed increases are<br />
temporary), or that the changes in run<strong>of</strong>f are concomitant<br />
to changes in leachable <strong>organic</strong> <strong>carbon</strong> stocks in soils (i.e.,<br />
high run<strong>of</strong>f indicates a high water table, which favors DOC<br />
leaching <strong>and</strong> hampers microbial degradation due to anoxia<br />
<strong>and</strong> humification). Either way, the relationship between<br />
lake DOC <strong>and</strong> run<strong>of</strong>f presented in this study (Fig. 5A)<br />
represents the outcome <strong>of</strong> the interactions <strong>of</strong> many climatic<br />
<strong>and</strong> geographic factors over a long time (since the last<br />
deglaciation), while the observed changes in DOC export<br />
with changes in run<strong>of</strong>f (Andersson et al. 1991; Hinton et al.<br />
1997; Mulholl<strong>and</strong> 2003) span much shorter time periods<br />
(years to decades). Even though the DOC pool available in<br />
soils for mobilization <strong>and</strong> export by water is very large <strong>and</strong><br />
not easily depleted by fluxes <strong>of</strong> water (Mulholl<strong>and</strong> 2003),<br />
the negative relationship between run<strong>of</strong>f <strong>and</strong> lake DOC<br />
concentration indicates that when high run<strong>of</strong>f prevails over<br />
extended periods <strong>of</strong> time, the leachable soil <strong>organic</strong> <strong>carbon</strong><br />
pool will eventually be reduced.<br />
The relationship between soil properties <strong>and</strong> lake DOC—<br />
The positive relationship between lake DOC concentration<br />
<strong>and</strong> soil <strong>carbon</strong> density is in accordance with earlier studies<br />
that showed that the export <strong>of</strong> DOC from catchments is<br />
related to the <strong>organic</strong> <strong>carbon</strong> stocks in the catchment soils<br />
(Hope et al. 1994; Aitkenhead et al. 1999). Hence, we infer<br />
that allochthonous DOC is an important contributor to the<br />
DOC pool <strong>of</strong> lakes across a wide climatic gradient (Figs. 4,<br />
5). Since DOC has been recognized as a major modifier <strong>of</strong><br />
aquatic ecosystems (Wetzel 2001), these results demonstrate<br />
that the structure <strong>and</strong> functioning <strong>of</strong> lake ecosystems<br />
are tightly coupled to the terrestrial environment.<br />
The soil <strong>carbon</strong> data used in this analysis are a measure<br />
<strong>of</strong> the bulk soil <strong>carbon</strong> density in the 0–1-m soil pr<strong>of</strong>ile.<br />
Most <strong>of</strong> the DOC, however, originates from the uppermost<br />
<strong>organic</strong>-rich soil layers, <strong>and</strong> DOC concentrations in soil<br />
pore water decline sharply toward lower soil horizons<br />
(McDowell <strong>and</strong> Likens 1988). We therefore hypothesize<br />
that if we had been able to include a measure <strong>of</strong> <strong>organic</strong><br />
<strong>carbon</strong> content in the uppermost soil horizon in our<br />
analysis, this variable would have been a more powerful<br />
predictor <strong>of</strong> lake DOC than bulk soil <strong>carbon</strong> density.<br />
The C : N ratio <strong>of</strong> the soil explained a small (5%), but<br />
significant proportion <strong>of</strong> the variability in lake DOC<br />
(Figs. 4, 5E). It has been shown previously that the soil<br />
C : N ratio is a good predictor <strong>of</strong> the riverine export <strong>of</strong>
DOC in lakes 1215<br />
Figure 5. Scatter plots <strong>and</strong> linear regressions for the relationships between log-transformed lake DOC concentration <strong>and</strong> (A) mean<br />
annual run<strong>of</strong>f (y 524.06 3 10 24 3 x + 0.84; R 2 5 0.08; df 5 7,075; p , 0.0001), (B) log altitude (y 520.364 3 x + 1.56; R 2 5 0.21; df 5<br />
6,762; p , 0.0001), (C) soil <strong>carbon</strong> density (y 5 9.59 3 10 23 3 x + 0.453; R 2 5 0.09; df 5 7,325; p , 0.0001), (D) log conductivity (y 5<br />
0.299 3 x + 0.238; R 2 5 0.09; df 5 6,695; p , 0.0001), (E) log soil C : N ratio (y 5 0.498 3 x + 0.087; R 2 5 0.05; df 5 6,501; p , 0.0001),<br />
<strong>and</strong> (F) log DOC predicted by the multiple linear regression model y 5 1.618 + 7.84 3 10 23 3 soil <strong>carbon</strong> 2 2.96 3 10 24 3 run<strong>of</strong>f 2<br />
0.412 3 log altitude; R 2 5 0.40; df 5 6,322; p , 0.0001.<br />
DOC (Aitkenhead <strong>and</strong> McDowell 2000). The C : N ratio <strong>of</strong><br />
soils is affected by a multitude <strong>of</strong> factors (e.g., type <strong>and</strong> age<br />
<strong>of</strong> vegetation, N deposition, acidification), <strong>and</strong> a high C : N<br />
ratio is indicative <strong>of</strong> a high proportion <strong>of</strong> refractory <strong>organic</strong><br />
matter (e.g., Benner 2003), <strong>and</strong> thus a lower availability to<br />
microbial degradation. In soils with a high C : N ratio,<br />
a larger proportion <strong>of</strong> the soil <strong>organic</strong> <strong>carbon</strong> pool may<br />
therefore be exported as DOC, rather than respired to CO 2<br />
by microbes. Also, as wetl<strong>and</strong> soils <strong>of</strong>ten are characterized<br />
by a high C : N ratio (Mulholl<strong>and</strong> 2003), the C : N ratio<br />
could possibly be a proxy for wetl<strong>and</strong> abundance in the<br />
lakes’ surroundings, implying a high export <strong>of</strong> DOC from<br />
the catchment.<br />
Lake area, catchment area, <strong>and</strong> lake DOC—Lake area is<br />
related to lake depth (Wetzel 2001), <strong>and</strong>, hence, it is<br />
connected to lake volume <strong>and</strong> water retention time <strong>and</strong><br />
may therefore serve as a proxy for in-lake loss <strong>of</strong> DOC via<br />
mineralization <strong>and</strong> sedimentation. However, we found that<br />
lake area was not an important predictor <strong>of</strong> lake DOC<br />
(Fig. 4), in accordance with a study in lakes from different<br />
regions (Xenopoulos et al. 2003). In regional studies, DOC
1216 Sobek et al.<br />
concentration has been reported to be negatively related to<br />
lake area (Rasmussen et al. 1989; Xenopoulos et al. 2003),<br />
but no such relationship has been found in other regions<br />
(Houle et al. 1995). In Finnish lakes, lake area was not<br />
a good predictor <strong>of</strong> TOC concentration, but nevertheless,<br />
median TOC concentration in small lakes was higher than<br />
in large lakes (Kortelainen 1993). When dividing our data<br />
set into 73 subsets <strong>of</strong> geographically well-confined regions<br />
(containing at least 15 lakes), we found negative relationships<br />
between lake area <strong>and</strong> DOC for several, but not all<br />
regions (data not shown). Thus, there was no consistent<br />
effect <strong>of</strong> lake area on the DOC concentration <strong>of</strong> lakes.<br />
Furthermore, we could not observe an effect <strong>of</strong> drainage<br />
ratio (catchment : lake area) on lake DOC (Fig. 4), again in<br />
accordance with the study <strong>of</strong> lakes in different regions by<br />
Xenopoulos et al. (2003). In regional studies, drainage ratio<br />
has sometimes been found to be important (Engstrom 1987;<br />
Rasmussen et al. 1989; Kortelainen 1993), but sometimes not<br />
(Houle et al. 1995). When dividing our data into regional<br />
subsets, we found positive relationships between drainage<br />
ratio <strong>and</strong> DOC for a few, but far from all regions (data not<br />
shown). Drainage ratio influences lake DOC concentration<br />
in two different ways, both <strong>of</strong> which are in the same direction.<br />
First, the DOC loading rate increases with increasing<br />
drainage ratio, <strong>and</strong> second, high drainage ratio implies high<br />
flushing rates <strong>of</strong> lakes <strong>and</strong> thus low in-lake loss <strong>and</strong> high<br />
concentration <strong>of</strong> DOC. However, both effects are dependent<br />
on water flows <strong>and</strong> thus climate, which implies that drainage<br />
ratio will necessarily be a better predictor <strong>of</strong> lake DOC within<br />
a climatically homogeneous region than across climatic<br />
zones. Further, Engstrom (1987) demonstrated that only<br />
drainage ratios ,6–10 will affect lake DOC, which implies<br />
that in regions with different topographies, the drainage ratio<br />
will be differently important for lake DOC. In our data set,<br />
81% <strong>and</strong> 64% <strong>of</strong> the lakes had drainage ratios above 6 <strong>and</strong><br />
10, respectively, which, according to Engstrom (1987), would<br />
suggest that the DOC concentration in many lakes in our<br />
data set is not dependent on drainage ratio.<br />
The observation that drainage ratio <strong>and</strong> lake area can be<br />
important predictors <strong>of</strong> lake DOC in many regions, but not<br />
in lakes distributed across different geographical regions,<br />
suggests that other environmental conditions set an average<br />
regional DOC level, <strong>and</strong> that drainage ratio <strong>and</strong> lake area<br />
determine a certain part <strong>of</strong> the variation around that<br />
average regional DOC level in individual lakes. We tested<br />
this hypothesis by first using the multiple linear regression<br />
model (Fig. 5F; Eq. 2) to predict the log DOC concentration<br />
from altitude, run<strong>of</strong>f, <strong>and</strong> soil <strong>carbon</strong> for all lakes.<br />
Next, we plotted the residual variation in globally predicted<br />
log DOC against log lake area <strong>and</strong> log drainage ratio for<br />
the 73 regional subsets <strong>of</strong> lakes. There were significant<br />
linear relationships (p , 0.05) between the residuals <strong>of</strong><br />
globally predicted log DOC <strong>and</strong> log lake area in 42% <strong>of</strong> the<br />
regional subsets (data not shown), explaining on average<br />
17% <strong>of</strong> the residual variance in log DOC (range 3–35%).<br />
The slopes <strong>and</strong> intercepts <strong>of</strong> these relationships varied<br />
greatly (ranges 20.82 to 0.11 <strong>and</strong> 20.87 to 0.27, respectively),<br />
<strong>and</strong> they illustrate the great difference in the<br />
importance <strong>of</strong> lake area for lake DOC between regions.<br />
Likewise, there were significant linear relationships (p ,<br />
0.05) between the residuals <strong>of</strong> globally predicted log DOC<br />
<strong>and</strong> log drainage ratio in 26% <strong>of</strong> the regional subsets (data<br />
not shown), explaining on average 15% <strong>of</strong> the residual<br />
variance in log DOC (range 1–40%). Also, for the drainage<br />
ratio, the regression statistics were highly variable (ranges<br />
for the slope <strong>and</strong> intercept were 20.33 to 0.54 <strong>and</strong> 20.93 to<br />
0.22, respectively). Nevertheless, the fact that lake area <strong>and</strong><br />
drainage ratio explained significant proportions <strong>of</strong> the<br />
residual variance in lake DOC within many geographically<br />
confined regions illustrates the hierarchical <strong>regulation</strong> <strong>of</strong><br />
lake DOC. The climate, topography, <strong>and</strong> hydrology set the<br />
potential range <strong>of</strong> lake DOC concentrations within each<br />
region, <strong>and</strong> catchment <strong>and</strong> lake characteristics (drainage<br />
ratio, % wetl<strong>and</strong>s, % upstream lakes, water retention time)<br />
regulate the DOC concentration <strong>of</strong> each individual lake.<br />
This implies that regional empirical models on DOC<br />
concentration in lakes are limited in their applicability to<br />
global extrapolations (Xenopoulos et al. 2003) as well as to<br />
other regions, even if situated within relatively short<br />
distances (Rantakari et al. 2004).<br />
Sources <strong>of</strong> additional variability in lake DOC—Regional<br />
models <strong>of</strong> <strong>organic</strong> <strong>carbon</strong> in lake water rendered degrees <strong>of</strong><br />
explanation in the range <strong>of</strong> 31–75% (most frequently 50–<br />
70%), <strong>and</strong> an analysis including lakes from several different<br />
regions explained 45% <strong>of</strong> the variability in lake DOC<br />
(Rasmussen et al. 1989; Xenopoulos et al. 2003; Rantakari<br />
et al. 2004). Hence, our models compare well to earlier<br />
studies. The fact that our analyses leave 52% <strong>of</strong> the<br />
variability in lake DOC unexplained can be attributed to<br />
a multitude <strong>of</strong> factors. First, several important features <strong>of</strong><br />
the lakes <strong>and</strong> their catchments were not part <strong>of</strong> our data<br />
set. If we had been able to assemble data on, for example,<br />
the proportion <strong>of</strong> wetl<strong>and</strong>s <strong>and</strong> upstream lakes <strong>and</strong> on the<br />
volume or flushing rate <strong>of</strong> the lakes, we probably would<br />
have been able to explain a greater share <strong>of</strong> the variability<br />
in lake DOC. Second, the grid size <strong>of</strong> some <strong>of</strong> the databases<br />
was probably considerably larger than the actual local<br />
variability, especially in mountain areas, which adds<br />
additional variation to the analyses. Third, most DOC<br />
concentrations are derived from one single measurement,<br />
which leaves a considerable amount <strong>of</strong> temporal variability<br />
in the data. Fourth, the conversion <strong>of</strong> TOC to DOC by<br />
means <strong>of</strong> a conversion factor may introduce additional<br />
variability in a part <strong>of</strong> the data set. Last, differences in<br />
sampling <strong>and</strong> analytical protocols among the many studies<br />
<strong>and</strong> surveys will also add to the total unexplained variance.<br />
Linkages among climate, catchments, <strong>and</strong> lakes—This<br />
paper shows for the first time that the climatic <strong>regulation</strong> <strong>of</strong><br />
DOC concentration in lakes, which has been observed<br />
using time series data (Pace <strong>and</strong> Cole 2002), can also be<br />
observed over a wide spatial gradient. Combined with the<br />
global-scale importance <strong>of</strong> the proportion <strong>of</strong> wetl<strong>and</strong>s in<br />
the catchment on lake DOC (Xenopoulos et al. 2003), our<br />
study exemplifies the hierarchical structure <strong>of</strong> the <strong>regulation</strong><br />
<strong>of</strong> DOC in lakes: climate <strong>and</strong> topography regulate<br />
terrestrial vegetation, soils, <strong>and</strong> hydrology, which in turn<br />
set the range <strong>of</strong> possible DOC concentrations in lakes <strong>of</strong><br />
one region. Then, the DOC concentration <strong>of</strong> each in-
DOC in lakes 1217<br />
dividual lake within that region is regulated by the local<br />
lake <strong>and</strong> catchment settings, such as the proportion <strong>of</strong><br />
wetl<strong>and</strong>s <strong>and</strong> upstream lakes, <strong>and</strong> the water retention time.<br />
Further, the tight coupling among climate, catchments, <strong>and</strong><br />
the biogeochemistry <strong>of</strong> lakes demonstrated by our study<br />
clearly shows the sensitivity <strong>of</strong> lake ecosystems to climate<br />
change. Changes in climate will affect the DOC concentration<br />
in lakes, which in turn will affect ecosystem<br />
structure <strong>and</strong> function <strong>and</strong> thereby alter significant biogeochemical<br />
fluxes, such as the emission <strong>of</strong> CO 2 from lakes<br />
to the atmosphere (Sobek et al. 2005). The sensitivity <strong>of</strong><br />
lake DOC to climate change has been shown previously<br />
(e.g., Schindler et al. 1997), <strong>and</strong> this is now supported by<br />
the largest compilation to date <strong>of</strong> DOC concentrations in<br />
lakes distributed across a wide climatic gradient. Still, there<br />
are important gaps in the global coverage <strong>of</strong> our data set,<br />
especially at low latitudes. To improve our underst<strong>and</strong>ing<br />
<strong>of</strong> the climate <strong>and</strong> catchment <strong>regulation</strong> <strong>of</strong> lake ecosystems,<br />
future work should strive to fill these gaps, in particular<br />
with respect to tropical lakes.<br />
References<br />
AHN, C.-H., AND R. TATEISHI. 1994. Potential <strong>and</strong> actual<br />
evapotranspiration <strong>and</strong> water balance data set [Internet].<br />
Geneva: UNEP/GRID. Data available from http://www.grid.<br />
unep.ch/. Accessed April 2003.<br />
AITKENHEAD, J. A., D. HOPE, AND M. F. BILLETT. 1999. The<br />
relationship between <strong>dissolved</strong> <strong>organic</strong> <strong>carbon</strong> in stream water<br />
<strong>and</strong> soil <strong>organic</strong> <strong>carbon</strong> pools at different spatial scales.<br />
Hydrol. Process. 13: 1289–1302.<br />
AITKENHEAD, J. A., AND W. H. MCDOWELL. 2000. Soil C : N ratios<br />
as a predictor <strong>of</strong> annual riverine DOC flux at local <strong>and</strong> global<br />
scales. Global Biogeochem. Cy. 14: 127–138.<br />
ALGESTEN, G., S. SOBEK, A.-K. BERGSTRÖM, A. ÅGREN, L. J.<br />
TRANVIK, AND M. JANSSON. 2004. Role <strong>of</strong> lakes for <strong>organic</strong><br />
<strong>carbon</strong> cycling in the boreal zone. Glob. Change Biol. 10:<br />
141–147.<br />
ANDERSSON, T., Å. NILSSON, AND M. JANSSON. 1991. Coloured<br />
substances in Swedish lakes <strong>and</strong> rivers—Temporal variation<br />
<strong>and</strong> regulating factors. Lect. Notes Earth Sc. 33: 243–253.<br />
ANTONIADES, D., M. S. V. DOUGLAS, AND J. P. SMOL. 2003.<br />
Comparative physical <strong>and</strong> chemical limnology <strong>of</strong> two<br />
Canadian high arctic regions: Alert (Ellesmere Isl<strong>and</strong>, NU)<br />
<strong>and</strong> Mould Bay (Prince Patrick Isl<strong>and</strong>, NWT). Arch.<br />
Hydrobiol. 158: 485–516.<br />
ARTS, M. T., R. D. ROBARTS, F. KASAI, M. J. WAISER, V. P.<br />
TUMBER, A.J.PLANTE, H.RAI, AND H. D. DE LANGE. 2000.<br />
The attenuation <strong>of</strong> ultraviolet radiation in high <strong>dissolved</strong><br />
<strong>organic</strong> <strong>carbon</strong> waters <strong>of</strong> wetl<strong>and</strong>s <strong>and</strong> lakes on the northern<br />
Great Plains. Limnol. Oceanogr. 45: 292–299.<br />
BENNER, R. 2003. Molecular indicators <strong>of</strong> the bioavailability <strong>of</strong><br />
<strong>dissolved</strong> <strong>organic</strong> matter, p. 121–137. In S. Findlay <strong>and</strong> R. L.<br />
Sinsabaugh [eds.], Aquatic ecosystems: Interactivity <strong>of</strong> <strong>dissolved</strong><br />
<strong>organic</strong> matter. Academic Press.<br />
CARIGNAN, R., D. PLANAS, AND C. VIS. 2000. Planktonic production<br />
<strong>and</strong> respiration in oligotrophic Shield lakes. Limnol.<br />
Oceanogr. 45: 189–199.<br />
CURTIS, P. J., AND H. E. ADAMS. 1995. Dissolved <strong>organic</strong>-matter<br />
quantity <strong>and</strong> quality from fresh-water <strong>and</strong> saltwater lakes in<br />
east-central Alberta. Biogeochemistry 30: 59–76.<br />
CURTIS, P. J., AND D. W. SCHINDLER. 1997. Hydrologic control <strong>of</strong><br />
<strong>dissolved</strong> <strong>organic</strong> matter in low-order Precambrian Shield<br />
lakes. Biogeochemistry 36: 125–138.<br />
D’ARCY, P., AND R. CARIGNAN. 1997. Influence <strong>of</strong> catchment<br />
topography on water chemistry in southeastern Quebec Shield<br />
lakes. Can. J. Fish. Aquat. Sci. 54: 2215–2227.<br />
DEL GIORGIO, P. A., J. J. COLE, N.F.CARACO, AND R. H. PETERS.<br />
1999. Linking planktonic biomass <strong>and</strong> metabolism to net gas<br />
fluxes in northern temperate lakes. Ecology 80: 1422–1431.<br />
DILLON, P. J., AND L. A. MOLOT. 1997. Dissolved <strong>organic</strong> <strong>and</strong><br />
in<strong>organic</strong> <strong>carbon</strong> mass balances in central Ontario lakes.<br />
Biogeochemistry 36: 29–42.<br />
DUFF, K. E., T. E. LAING, J.P.SMOL, AND D. R. S. LEAN. 1999.<br />
Limnological characteristics <strong>of</strong> lakes located across arctic<br />
treeline in northern Russia. Hydrobiologia 391: 205–222.<br />
EASTERN LAKE SURVEY. 1984. Surface waters data <strong>and</strong> metadata<br />
files [Internet]. Washington (DC): U.S. Environmental Protection<br />
Agency. Available online at http://www.epa.gov/<br />
emap/html/dataI/surfwatr/data/index.html. Accessed March<br />
2003.<br />
ELLIS-EVANS, J. C., V. GALCHENKO, J.LAYBOURN-PARRY, A.P.<br />
MYLNIKOV, AND W. PETZ. 2001. Environmental characteristics<br />
<strong>and</strong> microbial plankton activity <strong>of</strong> freshwater environments at<br />
Kongsfjorden, Spitsbergen (Svalbard). Arch. Hydrobiol. 152:<br />
609–632.<br />
ENGSTROM, D. R. 1987. Influence <strong>of</strong> vegetation <strong>and</strong> hydrology on<br />
the humus budgets <strong>of</strong> Labrador lakes. Can. J. Fish. Aquat.<br />
Sci. 44: 1306–1314.<br />
ERIKSSON, L., E. JOHANSSON, N.KETTANEH-WOLD, AND S. WOLD.<br />
2001. Multi- <strong>and</strong> megavariate data analysis—Principles <strong>and</strong><br />
applications. Umetrics AB.<br />
EUROPEAN ENVIRONMENT AGENCY WATERBASE—LAKES. 1949–2004.<br />
Data service [Internet]. Copenhagen, Denmark: European<br />
Environment Agency. Available from http://dataservice.<br />
eea.europa.eu/dataservice/. Accessed November 2005.<br />
FEE, E. J., R. E. HECKY, S.E.M.KASIAN, AND D. R. CRUIKSHANK.<br />
1996. Effects <strong>of</strong> lake size, water clarity, <strong>and</strong> climatic<br />
variability on mixing depths in Canadian Shield lakes.<br />
Limnol. Oceanogr. 41: 912–920.<br />
FEKETE, B. M., C. J. VÖRÖSMARTY, AND W. GRABS. 2000. UNH/<br />
GRDC Composite Run<strong>of</strong>f Fields V. 1.0 [Internet]. Koblenz,<br />
Germany: Global Run<strong>of</strong>f Data Centre (GRDC). Available<br />
for download at http://www.grdc.sr.unh.edu/. Accessed April<br />
2003.<br />
GLOBAL LAND COVER CHARACTERISTICS DATABASE. 1997. Earth<br />
Resources Observation <strong>and</strong> Science: Global L<strong>and</strong> Cover<br />
Characterization [Internet]. L<strong>and</strong> Processes Distributed Active<br />
Archive Center, U.S. Geological Survey. Reston, Virginia.<br />
Data available at http://edcsns17.cr.usgs.gov/glcc/. Accessed<br />
November 2002.<br />
GLOBAL SOIL DATA TASK GROUP. 2000. Global gridded surfaces <strong>of</strong><br />
selected soil characteristics (IGBP-DIS) [Internet]. Oak Ridge,<br />
Tennessee: Oak Ridge National Laboratory Distributed<br />
Active Archive Center. Data set available from http://<br />
www.daac.ornl.gov. Accessed September 2003.<br />
GORNIAK, A., E. JEKATIERNYCZUK-RUDCZYK, AND P. DOBRZYN.<br />
1999. Hydrochemistry <strong>of</strong> three dystrophic lakes in northeastern<br />
Pol<strong>and</strong>. Acta Hydrochim. Hydrobiol. 27: 12–18.<br />
HAITZER, M., S. HOSS, W. TRAUNSPURGER, AND C. STEINBERG.<br />
1998. Effects <strong>of</strong> <strong>dissolved</strong> <strong>organic</strong> matter (DOM) on the<br />
bioconcentration <strong>of</strong> <strong>organic</strong> chemicals in aquatic organisms—<br />
A review. Chemosphere 37: 1335–1362.<br />
HAMILTON, P. B., K. GAJEWSKI,D.E.ATKINSON, AND D. R. S. LEAN.<br />
2001. Physical <strong>and</strong> chemical limnology <strong>of</strong> 204 lakes from the<br />
Canadian Arctic Archipelago. Hydrobiologia 457: 133–148.<br />
HINTON, M. J., S. L. SCHIFF, AND M. C. ENGLISH. 1997. The<br />
significance <strong>of</strong> storms for the concentrations <strong>and</strong> export <strong>of</strong><br />
<strong>dissolved</strong> <strong>organic</strong> <strong>carbon</strong> from two Precambrian Shield<br />
catchments. Biogeochemistry 36: 67–88.
1218 Sobek et al.<br />
HOPE, D., M. F. BILLETT, AND M. S. CRESSER. 1994. A review <strong>of</strong><br />
the export <strong>of</strong> <strong>carbon</strong> in river water: Fluxes <strong>and</strong> processes.<br />
Environ. Pollut. 84: 301–324.<br />
HOPE, D., T. K. KRATZ, AND J. L. RIERA. 1996. Relationship<br />
between PCO 2 <strong>and</strong> <strong>dissolved</strong> <strong>organic</strong> <strong>carbon</strong> in northern<br />
Wisconsin lakes. J. Environ. Qual. 25: 1442–1445.<br />
HÖSKULDSSON, A. 1988. PLS regression methods. J. Chemometr. 2:<br />
211–228.<br />
HOULE, D., R. CARIGNAN, M.LACHANCE, AND J. DUPONT. 1995.<br />
Dissolved <strong>organic</strong>-<strong>carbon</strong> <strong>and</strong> sulfur in southwestern Quebec<br />
lakes—Relationships with catchment <strong>and</strong> lake properties.<br />
Limnol. Oceanogr. 40: 710–717.<br />
IMAI, A., K. MATSUSHIGE, AND T. NAGAI. 2003. Trihalomethane<br />
formation potential <strong>of</strong> <strong>dissolved</strong> <strong>organic</strong> matter in a shallow<br />
eutrophic lake. Water Res. 37: 4284–4294.<br />
JANSSON, M., A.-K. BERGSTRÖM, P.BLOMQVIST, AND S. DRAKARE.<br />
2000. Allochthonous <strong>organic</strong> <strong>carbon</strong> <strong>and</strong> phytoplankton/<br />
bacterioplankton production relationships in lakes. Ecology<br />
81: 3250–3255.<br />
JONES, R. I., J. LAYBOURN-PARRY, M. C. WALTON, AND J. M.<br />
YOUNG. 1997. The forms <strong>and</strong> distribution <strong>of</strong> <strong>carbon</strong> in a deep,<br />
oligotrophic lake (Loch Ness, Scotl<strong>and</strong>). Verh. Internat.<br />
Verein. Limnol. 26: 330–334.<br />
JONES, R. I. 1998. Phytoplankton, primary production <strong>and</strong><br />
nutrient cycling, p. 145–195. In D. O. Hessen <strong>and</strong> L. J.<br />
Tranvik [eds.], Aquatic humic substances: Ecology <strong>and</strong><br />
biogeochemistry. Springer-Verlag.<br />
JONSSON, A., J. KARLSSON, AND M. JANSSON. 2003. Sources <strong>of</strong><br />
<strong>carbon</strong> dioxide in clearwater <strong>and</strong> humic lakes in northern<br />
Sweden. Ecosystems 6: 224–235.<br />
KELLY, C. A., E. FEE, P.S.RAMLAL, J.W.M.RUDD, R.H.<br />
HESSLEIN, C.ANEMA, AND E. U. SCHINDLER. 2001. Natural<br />
variability <strong>of</strong> <strong>carbon</strong> dioxide <strong>and</strong> net epilimnetic production<br />
in the surface waters <strong>of</strong> boreal lakes <strong>of</strong> different sizes. Limnol.<br />
Oceanogr. 46: 1054–1064.<br />
KLING, G. W., G. W. KIPPHUT, M.M.MILLER, AND W. J. O’BRIEN.<br />
2000. Integration <strong>of</strong> lakes <strong>and</strong> streams in a l<strong>and</strong>scape perspective:<br />
The importance <strong>of</strong> material processing on spatial patterns<br />
<strong>and</strong> temporal coherence. Freshwater Biol. 43: 477–497.<br />
KORTELAINEN, P. 1993. Content <strong>of</strong> total <strong>organic</strong> <strong>carbon</strong> in Finnish<br />
lakes <strong>and</strong> its relationship to catchment characteristics. Can. J.<br />
Fish. Aquat. Sci. 50: 1477–1483.<br />
LAURION, I., M. VENTURA, J. CATALAN, R. PSENNER, AND R.<br />
SOMMARUGA. 2000. Attenuation <strong>of</strong> ultraviolet radiation in<br />
mountain lakes: Factors controlling the among- <strong>and</strong> withinlake<br />
variability. Limnol. Oceanogr. 45: 1274–1288.<br />
LIM, D. S. S., M. S. V. DOUGLAS, AND J. P. SMOL. 2005. Limnology<br />
<strong>of</strong> 46 lakes <strong>and</strong> ponds on Banks Isl<strong>and</strong>, NWT, Canadian<br />
Arctic Archipelago. Hydrobiologia 545: 11–32.<br />
LIM, D. S. S., M. S. V. DOUGLAS, J.P.SMOL, AND D. R. S. LEAN.<br />
2001. Physical <strong>and</strong> chemical limnological characteristics <strong>of</strong> 38<br />
lakes <strong>and</strong> ponds on Bathurst Isl<strong>and</strong>, Nunavut, Canadian High<br />
Arctic. Int. Rev. Hydrobiol. 86: 1–22.<br />
MCDOWELL, W. H., AND G. E. LIKENS. 1988. Origin, composition,<br />
<strong>and</strong> flux <strong>of</strong> <strong>dissolved</strong> <strong>organic</strong>-<strong>carbon</strong> in the Hubbard Brook<br />
Valley. Ecol. Monogr. 58: 177–195.<br />
MCKNIGHT, D. M., R. HARNISH,R.L.WERSHAW,J.S.BARON, AND<br />
S. L. SCHIFF. 1997. Chemical characteristics <strong>of</strong> particulate,<br />
colloidal <strong>and</strong> <strong>dissolved</strong> <strong>organic</strong> material in Loch Vale<br />
Watershed, Rocky Mountain National Park. Biogeochemistry<br />
36: 99–124.<br />
MICHELUTTI, N., M. S. V. DOUGLAS, D.R.S.LEAN, AND J. P.<br />
SMOL. 2002a. Physical <strong>and</strong> chemical limnology <strong>of</strong> 34 ultraoligotrophic<br />
lakes <strong>and</strong> ponds near Wyniatt Bay, Victoria<br />
Isl<strong>and</strong>, Arctic Canada. Hydrobiologia 482: 1–13.<br />
MICHELUTTI, N., M. S. V. DOUGLAS, D.C.G.MUIR, X.W.WANG,<br />
AND J. P. SMOL. 2002b. Limnological characteristics <strong>of</strong> 38<br />
lakes <strong>and</strong> ponds on Axel Heiberg Isl<strong>and</strong>, High Arctic Canada.<br />
Int. Rev. Hydrobiol. 87: 385–399.<br />
MOLOT, L. A., W. KELLER, P.R.LEAVITT, R.D.ROBARTS, M.J.<br />
WAISER, M.T.ARTS, T.A.CLAIR, R.PIENITZ, N.D.YAN, D.<br />
K. MCNICOL, Y.T.PRAIRIE, P.J.DILLON, M.MACRAE, R.<br />
BELLO, R.N.NORDIN, P.J.CURTIS, J.P.SMOL, AND M. S. V.<br />
DOUGLAS. 2004. Risk analysis <strong>of</strong> <strong>dissolved</strong> <strong>organic</strong> mattermediated<br />
ultraviolet B exposure in Canadian inl<strong>and</strong> waters.<br />
Can. J. Fish. Aquat. Sci. 61: 2511–2521.<br />
MULHOLLAND, P. J. 2003. Large-scale patterns in <strong>dissolved</strong> <strong>organic</strong><br />
<strong>carbon</strong> concentration, flux, <strong>and</strong> sources p. 139–160. In S.<br />
Findlay <strong>and</strong> R. L. Sinsabaugh [eds.], Aquatic ecosystems—<br />
Interactivity <strong>of</strong> <strong>dissolved</strong> <strong>organic</strong> matter. Academic Press.<br />
MULHOLLAND, P. J., C. N. DAHM,M.B.DAVID,D.M.DI TORO,T.<br />
R. FISHER, H.F.HEMOND, I.KÖGEL-KNABNER, M.MEYBECK,<br />
J. L. MEYER, AND J. R. SEDELL. 1990. What are the temporal<br />
<strong>and</strong> spatial variations <strong>of</strong> <strong>organic</strong> acids at the ecosystem level?<br />
p. 315–329. In E. M. Perdue <strong>and</strong> E. T. Gjessing [eds.],<br />
Organic acids in aquatic ecosystems. Wiley.<br />
MÜLLER, B., A. F. LOTTER, M.STURM, AND A. AMMANN. 1998.<br />
Influence <strong>of</strong> catchment quality <strong>and</strong> altitude on the water <strong>and</strong><br />
sediment composition <strong>of</strong> 68 small lakes in Central Europe.<br />
Aquat. Sci. 60: 316–337.<br />
NEW, M., M. HUMLE, AND P. D. JONES. 2000. Global 30-year mean<br />
monthly climatology, 1961–1990 [Internet]. Oak Ridge,<br />
Tennessee: Oak Ridge National Laboratory Distributed<br />
Active Archive Center. Data set available from http://<br />
www.daac.ornl.gov. Accessed December 2002.<br />
OLSON, J. S. 1994. Global ecosystem framework—Definitions.<br />
U.S. Geological Survey EROS Data Center Internal Report.<br />
USGS. Sioux Falls, South Dakota.<br />
PACE, M. L., AND J. J. COLE. 2002. Synchronous variation <strong>of</strong><br />
<strong>dissolved</strong> <strong>organic</strong> <strong>carbon</strong> <strong>and</strong> color in lakes. Limnol.<br />
Oceanogr. 47: 333–342.<br />
PERDUE, E. M. 1998. Chemical composition, structure, <strong>and</strong> metal<br />
binding properties, p. 41–62. In D. O. Hessen <strong>and</strong> L. J.<br />
Tranvik [eds.], Aquatic humic substances: Ecology <strong>and</strong><br />
biogeochemistry. Springer-Verlag.<br />
PIENITZ, R., J. P. SMOL, AND D. R. S. LEAN. 1997a. Physical <strong>and</strong><br />
chemical limnology <strong>of</strong> 24 lakes located between Yellowknife<br />
<strong>and</strong> Contwoyto Lake, Northwest Territories (Canada). Can.<br />
J. Fish. Aquat. Sci. 54: 347–358.<br />
PIENITZ, R., J. P. SMAL, AND D. R. S. LEAN. 1997b. Physical <strong>and</strong><br />
chemical limnology <strong>of</strong> 24 lakes located between the southern<br />
Yukon <strong>and</strong> Tuktoyaktuk Peninsula, Northwest Territories<br />
(Canada). Can. J. Fish. Aquat. Sci. 54: 330–346.<br />
PRAIRIE, Y. T., D. F. BIRD, AND J. J. COLE. 2002. The summer<br />
metabolic balance in the epilimnion <strong>of</strong> southeastern Quebec<br />
lakes. Limnol. Oceanogr. 47: 316–321.<br />
RAE, R., C. HOWARD-WILLIAMS,I.HAWES, A.-M. SCHWARZ, AND W.<br />
F. VINCENT. 2001. Penetration <strong>of</strong> solar ultraviolet radiation<br />
into New Zeal<strong>and</strong> lakes: Influence <strong>of</strong> <strong>dissolved</strong> <strong>organic</strong> <strong>carbon</strong><br />
<strong>and</strong> catchment vegetation. Limnology 2: 79–89.<br />
RAI, H., AND G. HILL. 1981. Physical <strong>and</strong> chemical studies <strong>of</strong> Lago<br />
Tupé; a central Amazonian black water ‘‘Ria Lake.’’ Int.<br />
Revue Ges. Hydrobiol. 66: 37–82.<br />
RANTAKARI, M., P. KORTELAINEN, J.VUORENMAA, J.MANNIO, AND<br />
M. FORSIUS. 2004. Finnish lake survey: The role <strong>of</strong> catchment<br />
attributes in determining nitrogen, phosphorus, <strong>and</strong> <strong>organic</strong><br />
<strong>carbon</strong> concentrations. Water, Air, Soil Poll. Focus 4:<br />
683–699.<br />
RASMUSSEN, J. B., L. GODBOUT, AND M. SCHALLENBERG. 1989. The<br />
humic content <strong>of</strong> lake water <strong>and</strong> its relationship to watershed<br />
<strong>and</strong> lake morphometry. Limnol. Oceanogr. 34: 1336–1343.
DOC in lakes 1219<br />
RÜHLAND, K. M., J. P. SMOL, X.WANG, AND D. C. G. MUIR. 2003.<br />
Limnological characteristics <strong>of</strong> 56 lakes in the Central<br />
Canadian Arctic treeline region. J. Limnol. 62: 9–27.<br />
SABBE, K., D. A. HODGSON,E.VERLEYEN,A.TATON,A.WILMOTTE,<br />
K. VANHOUTTE, AND W. VYVERMAN. 2004. Salinity, depth <strong>and</strong><br />
the structure <strong>and</strong> composition <strong>of</strong> microbial mats in continental<br />
Antarctic lakes. Freshwater Biol. 49: 296–319.<br />
SCHIFF, S., R. ARAVENA, E.MEWHINNEY, R.ELGOOD, B.WARNER,<br />
P. DILLON, AND S. TRUMBORE. 1998. Precambrian shield<br />
wetl<strong>and</strong>s: Hydrologic control <strong>of</strong> the sources <strong>and</strong> export <strong>of</strong><br />
<strong>dissolved</strong> <strong>organic</strong> matter. Climatic Change 40: 167–188.<br />
SCHINDLER, D. W., P. J. CURTIS, S.E.BAYLEY, B.R.PARKER, K.<br />
G. BEATY, AND M. P. STAINTON. 1997. Climate-induced<br />
changes in the <strong>dissolved</strong> <strong>organic</strong> <strong>carbon</strong> budgets <strong>of</strong> boreal<br />
lakes. Biogeochemistry 36: 9–28.<br />
SCULLY, N. M., D. J. MCQUEEN, AND D. R. S. LEAN. 1996.<br />
Hydrogen peroxide formation: The interaction <strong>of</strong> ultraviolet<br />
radiation <strong>and</strong> <strong>dissolved</strong> <strong>organic</strong> <strong>carbon</strong> in lake waters<br />
along a 43–75 degrees N gradient. Limnol. Oceanogr. 41:<br />
540–548.<br />
SOBEK, S., G. ALGESTEN, A.-K. BERGSTRÖM, M. JANSSON, AND<br />
L. J. TRANVIK. 2003. The catchment <strong>and</strong> climate <strong>regulation</strong><br />
<strong>of</strong> pCO 2 in boreal lakes. Glob. Change Biol. 9: 630–<br />
641.<br />
SOBEK, S., L. J. TRANVIK, AND J. J. COLE. 2005. Temperature<br />
independence <strong>of</strong> <strong>carbon</strong> dioxide supersaturation in global<br />
lakes. Glob. Biogeochem. Cy. 19, GB2003, doi: 10.1029/<br />
2004GB002264.<br />
STEINBERG, C. E. W., S. HOSS, W.KLOAS, I.LUTZ, T.MEINELT, S.<br />
PFLUGMACHER, AND C. WIEGAND. 2004. Hormonelike effects<br />
<strong>of</strong> humic substances on fish, amphibians, <strong>and</strong> invertebrates.<br />
Environ. Toxicol. 19: 409–411.<br />
SWEDISH NATIONAL LAKE MONITORING. 2000. Riksinventering<br />
2000, vattenkemi i sjöar. Institutionen för miljöanalys<br />
[Internet]. Ultuna, Sweden: Department <strong>of</strong> Environmental<br />
Assessment, Swedish University <strong>of</strong> Agricultural Sciences.<br />
Data available from http://info1.ma.slu.se/ri/www_ri.<br />
acgi$Project?ID52000KS. Accessed May 2003.<br />
TRANVIK, L. J. 1988. Availability <strong>of</strong> <strong>dissolved</strong> <strong>organic</strong> <strong>carbon</strong> for<br />
planktonic bacteria in oligotrophic lakes <strong>of</strong> differing humic<br />
content. Microbial Ecol. 16: 311–322.<br />
WESTERN LAKE SURVEY. 1985. Surface waters data <strong>and</strong> metadata<br />
files [Internet]. Washington (DC): Environmental Protection<br />
Agency. Available from http://www.epa.gov/emap/html/dataI/<br />
surfwatr/data/index.html. Accessed April 2005.<br />
WETZEL, R. G. 2001. Limnology. Lake <strong>and</strong> River Ecosystems, 3rd<br />
ed. Academic Press.<br />
XENOPOULOS, M. A., D. M. LODGE, J.FRENTRESS, T.A.KREPS, S.<br />
D. BRIDGHAM, E. GROSSMAN, AND C. J. JACKSON. 2003.<br />
Regional comparisons <strong>of</strong> watershed determinants <strong>of</strong> <strong>dissolved</strong><br />
<strong>organic</strong> <strong>carbon</strong> in temperate lakes from the Upper Great<br />
Lakes region <strong>and</strong> selected regions globally. Limnol. Oceanogr.<br />
48: 2321–2334.<br />
Received: 12 July 2006<br />
Accepted: 1 December 2006<br />
Amended: 30 January 2007