Achievements and Outcomes - Knowledge Transfer Partnerships
Achievements and Outcomes - Knowledge Transfer Partnerships
Achievements and Outcomes - Knowledge Transfer Partnerships

Create successful ePaper yourself
Turn your PDF publications into a flip-book with our unique Google optimized e-Paper software.
<strong>Knowledge</strong> <strong>Transfer</strong> <strong>Partnerships</strong><br />
1,083 total projects – April 2011<br />
Since then:<br />
434 projects completed<br />
222 offer letters issued for classic KTPs<br />
<br />
845 total projects – March 2012<br />
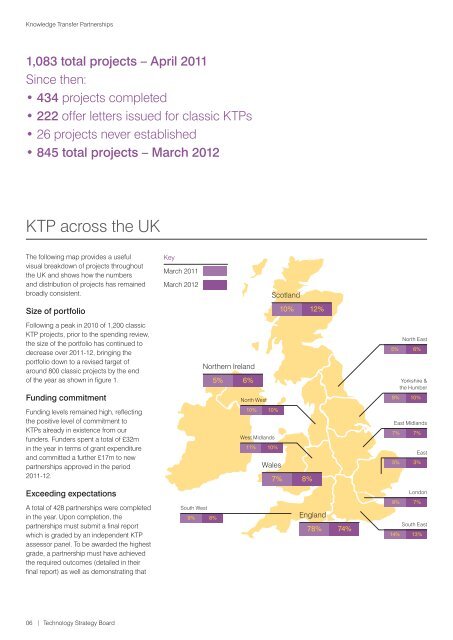
KTP across the UK<br />
The following map provides a useful<br />
visual breakdown of projects throughout<br />
the UK <strong>and</strong> shows how the numbers<br />
<strong>and</strong> distribution of projects has remained<br />
broadly consistent.<br />
Size of portfolio<br />
Following a peak in 2010 of 1,200 classic<br />
KTP projects, prior to the spending review,<br />
the size of the portfolio has continued to<br />
decrease over 2011-12, bringing the<br />
portfolio down to a revised target of<br />
around 800 classic projects by the end<br />
of the year as shown in figure 1.<br />
Funding commitment<br />
Funding levels remained high, reflecting<br />
the positive level of commitment to<br />
KTPs already in existence from our<br />
funders. Funders spent a total of £32m<br />
in the year in terms of grant expenditure<br />
<strong>and</strong> committed a further £17m to new<br />
partnerships approved in the period<br />
2011-12.<br />
Exceeding expectations<br />
A total of 428 partnerships were completed<br />
in the year. Upon completion, the<br />
partnerships must submit a final report<br />
which is graded by an independent KTP<br />
assessor panel. To be awarded the highest<br />
grade, a partnership must have achieved<br />
the required outcomes (detailed in their<br />
final report) as well as demonstrating that<br />
Key<br />
March 2011<br />
March 2012<br />
Scotl<strong>and</strong><br />
10% 12%<br />
Northern Irel<strong>and</strong><br />
5% 6%<br />
South West<br />
9% 8%<br />
North West<br />
10% 10%<br />
West Midl<strong>and</strong>s<br />
11% 10%<br />
Wales<br />
7% 8%<br />
Engl<strong>and</strong><br />
78% 74%<br />
North East<br />
5% 6%<br />
Yorkshire &<br />
the Humber<br />
9% 10%<br />
East Midl<strong>and</strong>s<br />
7% 7%<br />
5% 3%<br />
London<br />
8% 7%<br />
East<br />
South East<br />
14% 13%<br />
06 | Technology Strategy Board