Crop selection and irrigation scheduling decision tools for limited ...
Crop selection and irrigation scheduling decision tools for limited ...
Crop selection and irrigation scheduling decision tools for limited ...

Create successful ePaper yourself
Turn your PDF publications into a flip-book with our unique Google optimized e-Paper software.
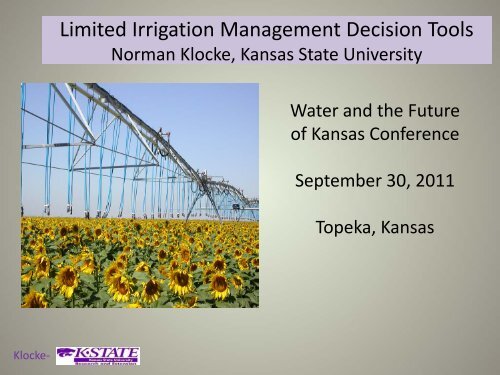
Limited Irrigation Management Decision Tools<br />
Norman Klocke, Kansas State University<br />
Water <strong>and</strong> the Future<br />
of Kansas Conference<br />
September 30, 2011<br />
Topeka, Kansas<br />
Klocke‐
Collaborators<br />
• Loyd Stone, Soil Physics, KSU, Manhattan<br />
• Troy Dumler, Ag Economist, KSU, Garden City<br />
• Steven Briggeman, Sprout Software, KC, MO<br />
• Dale Bolton, Data Processing, KSU, Garden City<br />
This research was supported in part by the Ogallala Aquifer<br />
Program, a consortium between USDA‐Agricultural Research<br />
Service, Kansas State University, Texas AgriLife Research, Texas<br />
AgriLife Extension Service, Texas Tech University, <strong>and</strong> West Texas<br />
A&M University.<br />
Klocke‐
Questions <strong>for</strong> Limited* Irrigation Management<br />
Using Economic Return<br />
• Which Combination of <strong>Crop</strong>s to Plant?<br />
• What are Optimum Irrigation Schedules?<br />
*Limited Irrigation = Restricted Water Supply by<br />
Irrigation System Capacity or Public Policy<br />
Klocke‐
• Evaluate an array crop rotations <strong>and</strong> water<br />
allocations<br />
• Net return = (<strong>Crop</strong> price X <strong>Crop</strong> Yield) –<br />
(Production Costs) – (Irrigation Costs)<br />
• Income risk analysis
<strong>Crop</strong>s <strong>for</strong><br />
Rotations<br />
Alfalfa<br />
Corn<br />
Grain Sorghum<br />
Soybean<br />
Wheat<br />
Sunflower<br />
Fallow<br />
L<strong>and</strong> Splits –Predetermined<br />
100%<br />
50% ‐ 50%<br />
75% ‐ 25%<br />
33% ‐ 33% ‐ 33%<br />
50% ‐ 25% ‐ 25%<br />
25% ‐ 25% ‐ 25% ‐ 25%<br />
Klocke
<strong>Crop</strong> Water Allocator<br />
Relative Yield vs. Net Irrigation For Corn<br />
Klocke<br />
Net Return = Rel. Yield X Max. Yield X Price – Operating Costs
<strong>Crop</strong>ping <strong>for</strong> 2012??<br />
• All wheat <strong>for</strong> 2012 (least risk ?)<br />
– Need to irrigate fall 2011<br />
– Borrow 2012 water <strong>for</strong> fall 2011<br />
• Wheat‐Corn <strong>for</strong> 2012<br />
– Need to irrigate wheat fall 2011<br />
– Borrow 2012 water <strong>for</strong> fall 2011?<br />
• Fall‐winter fallow then corn/sorghum in 2012<br />
• Fall‐winter fallow then all corn in 2012 (most risk ?)<br />
Klocke
<strong>Crop</strong>ping <strong>for</strong> 2012?<br />
Assumptions <strong>for</strong> 2011/2012 <strong>Crop</strong> Selections<br />
Rainfall 11"‐2011 11"‐2012<br />
Well 400 gpm 2200 hrs. pumping<br />
Irrigation in 2012=13 inches total<br />
Wheat is irrigated in Fall 2011<br />
Prices<br />
$6/bu‐corn; $8/bu‐wheat; $4/bu‐sorg.<br />
Klocke
<strong>Crop</strong>ping <strong>for</strong> 2012?<br />
<strong>Crop</strong><br />
Irrigation<br />
Yield<br />
(bu/ac)<br />
Net<br />
Return<br />
Klocke<br />
All Wheat 13" 55 $162/ac<br />
Wheat/Corn 5"/20" 21/203 $341/ac<br />
Corn/Sorghum 20"/5" 203/42 $302/ac<br />
All Corn 13" 128 $338/ac<br />
Net Return = Price X Yield – Operating Costs
Forecasting Irrigation Schedule<br />
By Economic Return<br />
Pre‐Growing Season Irrigation?<br />
Date of First Irrigation During the Growing Season?<br />
Irrigation Frequency?<br />
Irrigation System Capacity<br />
M<strong>and</strong>ated Annual Irrigation<br />
Predetermined Irrigation Schedule?<br />
Date of Last Irrigation During the Growing Season?<br />
Klocke‐
Reference ET<br />
Kansas Water Budget<br />
Maximum ET<br />
Soil Water Balance<br />
Actual ET<br />
Available SW<br />
Effective ET<br />
Yield<br />
Klocke
Corn –<br />
Results <strong>for</strong> Available SW = 30%, 50%, 70%<br />
Oct. 1 Relative Net<br />
ASW Yield Return ET Drain<br />
(%) (%) ($/ac) (in) (in)<br />
30 70 350 20.5 0.2<br />
50 75 410 21.4 0.9<br />
70 78 430 21.8 2.4<br />
Annual Irrigation = 12 inches between May 20 & Aug 20<br />
Annual Precipitation = 16 inches<br />
Klocke‐
Income Risk from 80%, 50%, 20%<br />
Rainfall Probabilities‐Corn<br />
Annual Relative Net<br />
Precip. Yield Return ET Drain<br />
(mm) (%) ($/ac) (in) (in)<br />
12 56 120 18.7 0<br />
16 70 350 20.5 0.2<br />
19 76 420 21.5 1.0<br />
30% ASW on October 1<br />
Annual Irrigation = 12 inches between May 20 & Aug 20<br />
Klocke‐
Effectiveness of Pre‐Season Irrigation<br />
Klocke‐<br />
Oct. 1 GS NGS Rel. Net<br />
ASW Irr. Irr. Yield Return Drain.<br />
(%) (in) (in) (%) ($/ac) (in)<br />
30 12 0 70 350 0.2<br />
30 9 3 70 350 0.5<br />
70 12 0 80 450 2.0<br />
70 9 3 75 400 2.9<br />
Pre‐season Irrigation on March 1, March 15, April 1<br />
NGS = Non‐Growing Season<br />
GS = Growing Season<br />
Annual Precipitation = 16 inches
Summary<br />
User Acceptance – Computer Literate<br />
Producers<br />
<strong>Crop</strong> Consultants<br />
Water Policy Agencies<br />
Irrigation Specialists<br />
Educators<br />
Training Needs<br />
CWA – 1 hour<br />
CYP – 2 hour<br />
Klocke‐
Download CWA <strong>and</strong> CYP at:<br />
www.mobile<strong>irrigation</strong>lab.com<br />
Klocke‐