FDMS TEOM/BAM field studies - MARAMA
FDMS TEOM/BAM field studies - MARAMA
FDMS TEOM/BAM field studies - MARAMA

Create successful ePaper yourself
Turn your PDF publications into a flip-book with our unique Google optimized e-Paper software.
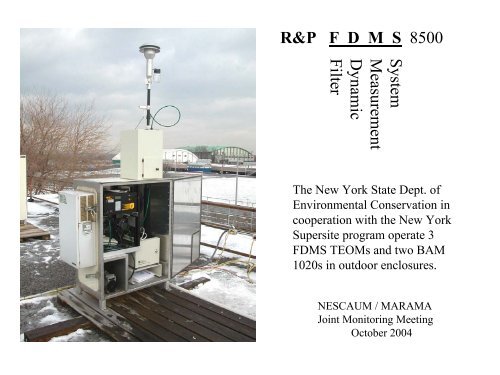
R&P F D M S 8500<br />
System<br />
Measurement<br />
Dynamic<br />
Filter<br />
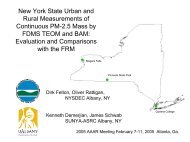
The New York State Dept. of<br />
Environmental Conservation in<br />
cooperation with the New York<br />
Supersite program operate 3<br />
<strong>FDMS</strong> <strong>TEOM</strong>s and two <strong>BAM</strong><br />
1020s in outdoor enclosures.<br />
NESCAUM / <strong>MARAMA</strong><br />
Joint Monitoring Meeting<br />
October 2004
Filter Dynamics Measurement System (<strong>FDMS</strong>) <strong>TEOM</strong> Monitor<br />
•PM 10 inlet followed by PM 2.5<br />
sensor and diffusion dryer<br />
sharp cut cyclone, (30 deg C), mass<br />
•<strong>FDMS</strong> also utilizes a 3 way switching valve and a (4deg C) chilled<br />
47 mm diameter filter (which collects and holds particles during the<br />
purge or reference portion of the measurement cycle)<br />
•The difference between the measured mass concentrations during<br />
the purge;(usually negative) and sample periods is reported by the<br />
instrument.<br />
•Mass Conc. = Sample – (Purge Mass)
1/21/04 0:00<br />
The Reference Mass is usually negative. The Mass Conc is the rolling average of<br />
the subtraction (Base – Ref) from the previous ten 6 minute switching periods.<br />
PMTACS Winter Intensive PS219 <strong>FDMS</strong> - Jan 10 - 21, 2004<br />
MC, Base and Reference Data: 1 hour running average<br />
50<br />
40<br />
30<br />
20<br />
10<br />
0<br />
-10<br />
1/10/04 0:00<br />
1/11/04 0:00<br />
1/12/04 0:00<br />
1/13/04 0:00<br />
1/14/04 0:00<br />
1/15/04 0:00<br />
1/16/04 0:00<br />
1/17/04 0:00<br />
1/18/04 0:00<br />
1/19/04 0:00<br />
1/20/04 0:00<br />
ug/m3<br />
MC Base MC Ref MC
The <strong>FDMS</strong> mass is only significantly higher when the atmospheric PM-2.5<br />
contains a high proportion of volatile material.<br />
PMTACS Winter Intensive PS219 <strong>FDMS</strong> and Collocated 50 Deg <strong>TEOM</strong><br />
Jan 10 - 21, 2004 - 1 hour running averages<br />
50<br />
40<br />
30<br />
ug/m3<br />
20<br />
10<br />
0<br />
-10<br />
10-Jan<br />
11-Jan<br />
12-Jan<br />
13-Jan<br />
14-Jan<br />
15-Jan<br />
16-Jan<br />
17-Jan<br />
18-Jan<br />
19-Jan<br />
20-Jan<br />
21-Jan<br />
<strong>FDMS</strong> <strong>TEOM</strong> 50
Met One Beta Attenuation Monitor (<strong>BAM</strong>)<br />
Model 1020 with “Smart Heater”<br />
The shelter is not air conditioned. The shelter<br />
heat is only used below 4 or 5 deg C.<br />
“Smart Heater”: This is a canister style heater<br />
on the inlet tube.
Met One Beta Attenuation Monitor<br />
(<strong>BAM</strong>) Model 1020<br />
Radioactive Source 14 C (Carbon-14)<br />
(less than 60 uCi)<br />
The mass density of particulate on the filter<br />
is calculated from the measured reduction in<br />
the number of beta particles passing through<br />
the filter.<br />
The <strong>BAM</strong> 1020 is a reference instrument for<br />
PM-10.<br />
Tape rolls last approximately two months.<br />
A new Teflon sample tape has been<br />
developed in an effort to reduce noise and<br />
improve sensitivity.
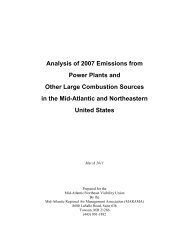
Comparison of Instruments and Methods<br />
<strong>TEOM</strong><br />
50 Deg C.<br />
<strong>TEOM</strong><br />
<strong>FDMS</strong><br />
<strong>BAM</strong><br />
“Cold”<br />
Shelter<br />
Temperature<br />
2 – 25 Deg C.<br />
AC Required<br />
2 – 25 Deg C.<br />
AC Required<br />
Above 0 Deg C<br />
Water<br />
Management<br />
Inlet Heat<br />
Nafion Dryer<br />
Inlet Heat<br />
Sample<br />
Conditioning<br />
50 Deg C.<br />
30 Deg C.<br />
< 45% Relative<br />
Humidity<br />
Correlation to<br />
Mass<br />
Spring Equation<br />
and NIST Std.<br />
Spring Equation<br />
and NIST Std.<br />
Factory<br />
Calibration<br />
Data Resolution<br />
10 Minute<br />
Rolling Average<br />
6 min. switch<br />
1 Hr Rolling Av<br />
51 min Analysis<br />
1 Hr Discrete Val
Site #1: Queens College NYC<br />
<strong>FDMS</strong> Start Date – Jan. 8, 03<br />
<strong>BAM</strong> Since Nov 28, 03 (Quartz)<br />
FRM Daily<br />
<strong>TEOM</strong> 50 Deg C<br />
STN 1/3 Day<br />
Site #2: Pinnacle State Park<br />
<strong>FDMS</strong> Start Date – Mar. 26, 03<br />
<strong>BAM</strong> Since July 28, 04 (Teflon)<br />
FRM Daily<br />
<strong>TEOM</strong> 50 Deg C<br />
STN 1/3 Day<br />
IMPROVE 1/3 Day<br />
Site #3: Niagara Falls<br />
<strong>FDMS</strong> Start Date – July 23, 03<br />
FRM 1/3 Day<br />
<strong>TEOM</strong> 50 Deg C<br />
STN 1/6 Day (Buffalo)
Hourly data from <strong>FDMS</strong> and <strong>BAM</strong> instruments can be difficult to use.<br />
The collocated hourly precision <strong>FDMS</strong> vs <strong>BAM</strong>: (r 2 is less than .6)<br />
Hour to hour variability is higher for the <strong>BAM</strong>.<br />
45<br />
PMTACS Winter Intensive - Collocated <strong>FDMS</strong> and <strong>BAM</strong><br />
Hourly Data<br />
35<br />
PM-2.5 ug/m3<br />
25<br />
15<br />
5<br />
-5<br />
1/10<br />
1/10<br />
1/10<br />
1/11<br />
1/11<br />
1/12<br />
1/12<br />
1/13<br />
1/13<br />
1/14<br />
1/14<br />
1/15<br />
1/15<br />
1/15<br />
1/16<br />
1/16<br />
1/17<br />
1/17<br />
1/18<br />
1/18<br />
1/19<br />
1/19<br />
1/20<br />
1/20<br />
1/21<br />
<strong>BAM</strong><br />
<strong>FDMS</strong> - PS219
Appling a Smoothing function: 5 hour centered on the hour makes the data more useful.<br />
Smoothed near real-time data is ideal for producing an AQI.<br />
Smoothed collocated precision: <strong>FDMS</strong> vs <strong>BAM</strong> (r 2 is .8 - .9)<br />
PMTACS Winter Intensive - Collocated <strong>FDMS</strong> and <strong>BAM</strong><br />
Rolling 5 Hour Smoothing Applied to Hourly Data<br />
45<br />
40<br />
35<br />
30<br />
25<br />
20<br />
15<br />
10<br />
5<br />
0<br />
1/10/04 0:00<br />
1/10/04 8:00<br />
1/10/04 16:00<br />
1/11/04 0:00<br />
1/11/04 8:00<br />
1/11/04 16:00<br />
1/12/04 0:00<br />
1/12/04 8:00<br />
1/12/04 16:00<br />
1/13/04 0:00<br />
1/13/04 8:00<br />
1/13/04 16:00<br />
1/14/04 0:00<br />
1/14/04 8:00<br />
1/14/04 16:00<br />
1/15/04 0:00<br />
1/15/04 8:00<br />
1/15/04 16:00<br />
1/16/04 0:00<br />
1/16/04 8:00<br />
1/16/04 16:00<br />
1/17/04 0:00<br />
1/17/04 8:00<br />
1/17/04 16:00<br />
1/18/04 0:00<br />
1/18/04 8:00<br />
1/18/04 16:00<br />
1/19/04 0:00<br />
1/19/04 8:00<br />
1/19/04 16:00<br />
1/20/04 0:00<br />
1/20/04 8:00<br />
1/20/04 16:00<br />
1/21/04 0:00<br />
<strong>BAM</strong> <strong>FDMS</strong> PS219
24-Hr Averages compared to FRM data: Winter Urban Comparison<br />
FRM, <strong>FDMS</strong> <strong>TEOM</strong> and <strong>BAM</strong> Data<br />
1st Qtr 2004 - Queens, NY<br />
40<br />
30<br />
?<br />
ug/m3<br />
20<br />
10<br />
0<br />
1-Jan<br />
8-Jan<br />
15-Jan<br />
22-Jan<br />
29-Jan<br />
5-Feb<br />
12-Feb<br />
19-Feb<br />
26-Feb<br />
FRM <strong>FDMS</strong> <strong>BAM</strong>(Quartz)<br />
<strong>FDMS</strong> = 1.08 (FRM) + .3 <strong>BAM</strong>(Quartz) = 1.07 (FRM) + .6<br />
R 2 = .96 R 2 = .93
22-Aug<br />
Hourly Mass data is just as noisy at the Rural site.<br />
Pinnacle (Rural) 2004 Summer Intensive<br />
60<br />
50<br />
40<br />
30<br />
20<br />
10<br />
0<br />
30-Jul<br />
31-Jul<br />
2-Aug<br />
4-Aug<br />
5-Aug<br />
7-Aug<br />
9-Aug<br />
10-Aug<br />
12-Aug<br />
14-Aug<br />
15-Aug<br />
17-Aug<br />
20-Aug<br />
19-Aug<br />
-10<br />
FRM <strong>BAM</strong>(Teflon) <strong>FDMS</strong><br />
ug/m3
24-Hr Averages compared to FRM data: Summer Rural Comparison<br />
FRM data is not yet validated<br />
Pinnacle (Rural) 2004 Summer Intensive<br />
50<br />
40<br />
ug/m3<br />
30<br />
20<br />
10<br />
0<br />
30-Jul<br />
1-Aug<br />
3-Aug<br />
5-Aug<br />
7-Aug<br />
9-Aug<br />
11-Aug<br />
13-Aug<br />
15-Aug<br />
17-Aug<br />
19-Aug<br />
21-Aug<br />
23-Aug<br />
FRM <strong>FDMS</strong> <strong>BAM</strong>(Teflon)<br />
<strong>FDMS</strong> = 0.98 (FRM) + .98 <strong>BAM</strong>(Teflon) = 1.24 (FRM) – 2.76<br />
R 2 = .93 R 2 = .95
Two suspicious FRM values were removed from the comparisons<br />
FRM data is not yet validated<br />
Pinnacle (Rural) 2004 Summer Intensive<br />
50<br />
ug/m3<br />
40<br />
30<br />
20<br />
Outliers<br />
Removed<br />
10<br />
0<br />
30-Jul<br />
1-Aug<br />
3-Aug<br />
5-Aug<br />
7-Aug<br />
9-Aug<br />
11-Aug<br />
13-Aug<br />
15-Aug<br />
17-Aug<br />
19-Aug<br />
21-Aug<br />
23-Aug<br />
FRM <strong>FDMS</strong> <strong>BAM</strong>(Teflon)<br />
<strong>FDMS</strong> = 1.00 (FRM) + .7 <strong>BAM</strong>(Teflon) = 1.26 (FRM) – 3.02<br />
R 2 = .98 R 2 = .99
<strong>FDMS</strong> Data Losses in 2003 and 2004:<br />
<strong>FDMS</strong> operational problems have resulted in an unacceptably large<br />
percentage of down time at New York sites. The majority of these<br />
problems were related to temperature/condensation problems which were<br />
aggravated by the operation of these instruments in outdoor enclosures.<br />
R&P has addressed these problems:<br />
The air conditioning system in the outdoor enclosure has been redesigned.<br />
New outdoor enclosures will have twice the insulation of the old ones.<br />
The <strong>FDMS</strong> (Version II) has been modified to include additional more<br />
accurate humidity sensors on both the inlet and outlet of the Nafion dryer.<br />
The <strong>FDMS</strong> design has been modified to use the pump vacuum more<br />
efficiently and to reduce the amount of tubing and connections.<br />
A coalescing filter has been added on the bypass line to prevent water from<br />
entering the bypass flow controller.
Summary Stats:<br />
The <strong>FDMS</strong> <strong>TEOM</strong> and the <strong>BAM</strong> (with smart heater) report significantly more mass<br />
than previous <strong>TEOM</strong>s and <strong>BAM</strong>s and, on average, capture more mass than the FRM<br />
at these New York sites.<br />
Urban Queens: 1 st and 2 nd Quarter (FRM is Daily)<br />
2003: <strong>FDMS</strong> = 1.24 (FRM) + 2.36 R 2 = .93<br />
2004: <strong>FDMS</strong> = 1.28 (FRM) - .64 R 2 = .94<br />
2004: <strong>BAM</strong>(Q) = 1.32 (FRM) + .13 R 2 = .84<br />
Industrial Niagara Falls: Mar – July 2004 (FRM is 1/3)<br />
2004: <strong>FDMS</strong> = 1.08 (FRM) + .9 R 2 = .89<br />
Rural Pinnacle: 2003 (Feb – April) 2004 (July – Aug) (FRM is Daily)<br />
2003: <strong>FDMS</strong> = 1.10 (FRM) - .35 R 2 = .90<br />
2004: <strong>BAM</strong>(T) = 1.24 (FRM) - 3.71 R 2 = .98
Summary Continued:<br />
- The data from the <strong>BAM</strong> with Quartz tape is somewhat noisier than the <strong>FDMS</strong><br />
<strong>TEOM</strong> but overall is quite comparable.<br />
- The New York City instrument comparison is still lacking summer data.<br />
- The <strong>BAM</strong> with Teflon tape installed at Pinnacle State Park correlates well with<br />
the FRM but the manufacturer plans to recalibrate the instrument.<br />
- Seasonal Bias may make Class III Equivalency difficult for the <strong>FDMS</strong> and <strong>BAM</strong>.<br />
Seasonal Bias: (<strong>FDMS</strong> <strong>TEOM</strong> - FRM) New York City<br />
20<br />
15<br />
ug/m3<br />
10<br />
5<br />
0<br />
-5<br />
1 26 51 76 101 126 151 176 201 226 251 276 301 326 351<br />
Julian Day: 2004<br />
y = -0.0001x 2 + 0.0388x + 0.424<br />
R 2 = 0.1119
Acknowledgments<br />
This work was supported in part by<br />
• U.S. Environmental Protection Agency (EPA) cooperative<br />
agreement # R828060010<br />
• New York State Energy Research and Development<br />
Authority (NYSERDA), contract # 4918ERTERES99,<br />
• New York State Department of Environmental Conservation<br />
(NYS DEC), contract # C004210.
End<br />
End of Slide Show
The Nafion dryer in the <strong>FDMS</strong> exhibited a drop in efficiency as the shelter<br />
temperature increased. This resulted in water condensing on the 47 mm filter.<br />
R&P <strong>FDMS</strong> Sample Dew Point January - August 2003<br />
Queens NYC - NYSDEC Raw Hourly Averaged Data<br />
5<br />
3<br />
1<br />
-1<br />
-3<br />
-5<br />
-7<br />
-9<br />
-11<br />
-13<br />
-15<br />
1/8/2003 13:01<br />
1/15/2003 7:00<br />
1/22/2003 1:00<br />
1/28/2003 19:00<br />
2/4/2003 13:00<br />
2/11/2003 7:00<br />
2/18/2003 1:00<br />
2/24/2003 19:00<br />
3/3/2003 13:00<br />
3/10/2003 7:00<br />
3/17/2003 1:00<br />
3/23/2003 19:00<br />
3/30/2003 13:00<br />
4/6/2003 7:00<br />
4/13/2003 1:00<br />
4/19/2003 19:00<br />
4/17/2003 13:00<br />
1/0/1900 7:00<br />
5/1/2003 1:00<br />
5/7/2003 19:00<br />
5/14/2003 13:00<br />
5/21/2003 7:00<br />
5/28/2003 1:00<br />
6/3/2003 19:00<br />
6/10/2003 13:00<br />
6/17/2003 7:00<br />
6/24/2003 1:00<br />
6/30/2003 19:00<br />
7/7/2003 13:00<br />
7/14/2003 7:00<br />
7/21/2003 1:00<br />
7/27/2003 19:00<br />
8/3/2003 23:00<br />
Deg C<br />
Sample Dew
This “collocated” comparison is informational. The QC instrument is next to a parking<br />
lot and the office trailers used during the PMTACS intensive while the PS219<br />
instrument is 150 yards away on the roof of a school.<br />
PMTACS Winter Intensive<br />
<strong>FDMS</strong>(QC) vs <strong>FDMS</strong>(PS219)<br />
PM-2.5 - Smoothed Data: Jan 10 - 21, 2004<br />
50<br />
y = 1.06x + 0.47<br />
R 2 = 0.97<br />
<strong>FDMS</strong>(PS219) - ug/m3<br />
40<br />
30<br />
20<br />
10<br />
0<br />
0 10 20 30 40 50<br />
<strong>FDMS</strong>(QC) - ug/m3
This is the 2003 <strong>FDMS</strong> vs FRM comparison data from Pinnacle State Park.<br />
This is late winter early spring.<br />
PMTACS Pinnacle (Rural) Site PM-2.5<br />
<strong>FDMS</strong> vs. FRM Feb. - April 2003<br />
y = 1.10x - 0.35<br />
R 2 = 0.90<br />
30<br />
25<br />
<strong>FDMS</strong> ug/m3<br />
20<br />
15<br />
10<br />
5<br />
0<br />
0 5 10 15 20 25 30<br />
FRM ug/m3
50<br />
Pinnacle Summer Intensive 2004<br />
y = 1.26x - 3.02<br />
R 2 = 0.99<br />
40<br />
<strong>BAM</strong><br />
30<br />
20<br />
10<br />
FRM vs <strong>BAM</strong> (Teflon)<br />
Linear (FRM vs <strong>BAM</strong><br />
(Teflon))<br />
0<br />
0 10 20 30 40 50<br />
FRM
The <strong>FDMS</strong> and the <strong>BAM</strong> are well correlated during this period. Larger datasets<br />
suggest that the <strong>BAM</strong> reads higher than the <strong>FDMS</strong> at low concentrations.<br />
The data is smoothed with a centered 5 hour rolling average.<br />
PMTACS Winter Intensive<br />
<strong>FDMS</strong> (PS219) vs <strong>BAM</strong> (PS219)<br />
PM-2.5 - Smoothed Data: Jan 10 - 21, 2004<br />
50<br />
y = 0.89x + 1.74<br />
R 2 = 0.89<br />
<strong>BAM</strong> - ug/m3<br />
40<br />
30<br />
20<br />
10<br />
y = 0.98x<br />
R 2 = 0.88<br />
0<br />
0 10 20 30 40 50<br />
<strong>FDMS</strong> - ug/m3
PMTACS Winter Intensive Monitoring Locations<br />
Main installation in office trailers<br />
<strong>FDMS</strong> (PS219)<br />
<strong>BAM</strong> (PS219)
PMTACS Winter Intensive – November 2003
Pinnacle State Park – Addison, New York – March 2003<br />
<strong>FDMS</strong> Inlet<br />
<strong>FDMS</strong>