Chapter 15--Our Sun - Geological Sciences
Chapter 15--Our Sun - Geological Sciences
Chapter 15--Our Sun - Geological Sciences

Create successful ePaper yourself
Turn your PDF publications into a flip-book with our unique Google optimized e-Paper software.
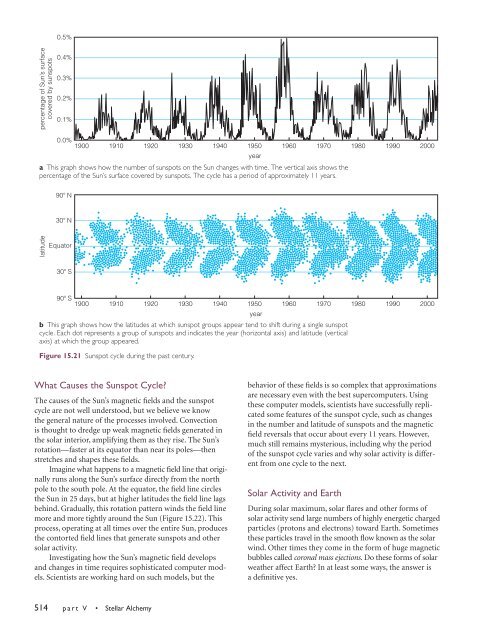
0.5%<br />
percentage of <strong>Sun</strong>’s surface<br />
covered by sunspots<br />
0.4%<br />
0.3%<br />
0.2%<br />
0.1%<br />
0.0%<br />
1900 1910 1920 1930 1940 1950 1960 1970 1980 1990 2000<br />
a This graph shows how the number of sunspots on the <strong>Sun</strong> changes with time. The vertical axis shows the<br />
percentage of the <strong>Sun</strong>’s surface covered by sunspots. The cycle has a period of approximately 11 years.<br />
year<br />
90 N<br />
30 N<br />
latitude<br />
Equator<br />
30 S<br />
90 S<br />
1900<br />
1910 1920 1930 1940 1950 1960 1970 1980 1990 2000<br />
b This graph shows how the latitudes at which sunspot groups appear tend to shift during a single sunspot<br />
cycle. Each dot represents a group of sunspots and indicates the year (horizontal axis) and latitude (vertical<br />
axis) at which the group appeared.<br />
Figure <strong>15</strong>.21 <strong>Sun</strong>spot cycle during the past century.<br />
year<br />
What Causes the <strong>Sun</strong>spot Cycle?<br />
The causes of the <strong>Sun</strong>’s magnetic fields and the sunspot<br />
cycle are not well understood, but we believe we know<br />
the general nature of the processes involved. Convection<br />
is thought to dredge up weak magnetic fields generated in<br />
the solar interior, amplifying them as they rise. The <strong>Sun</strong>’s<br />
rotation—faster at its equator than near its poles—then<br />
stretches and shapes these fields.<br />
Imagine what happens to a magnetic field line that originally<br />
runs along the <strong>Sun</strong>’s surface directly from the north<br />
pole to the south pole. At the equator, the field line circles<br />
the <strong>Sun</strong> in 25 days, but at higher latitudes the field line lags<br />
behind. Gradually, this rotation pattern winds the field line<br />
more and more tightly around the <strong>Sun</strong> (Figure <strong>15</strong>.22). This<br />
process, operating at all times over the entire <strong>Sun</strong>, produces<br />
the contorted field lines that generate sunspots and other<br />
solar activity.<br />
Investigating how the <strong>Sun</strong>’s magnetic field develops<br />
and changes in time requires sophisticated computer models.<br />
Scientists are working hard on such models, but the<br />
behavior of these fields is so complex that approximations<br />
are necessary even with the best supercomputers. Using<br />
these computer models, scientists have successfully replicated<br />
some features of the sunspot cycle, such as changes<br />
in the number and latitude of sunspots and the magnetic<br />
field reversals that occur about every 11 years. However,<br />
much still remains mysterious, including why the period<br />
of the sunspot cycle varies and why solar activity is different<br />
from one cycle to the next.<br />
Solar Activity and Earth<br />
During solar maximum, solar flares and other forms of<br />
solar activity send large numbers of highly energetic charged<br />
particles (protons and electrons) toward Earth. Sometimes<br />
these particles travel in the smooth flow known as the solar<br />
wind. Other times they come in the form of huge magnetic<br />
bubbles called coronal mass ejections. Do these forms of solar<br />
weather affect Earth? In at least some ways, the answer is<br />
a definitive yes.<br />
514 part V • Stellar Alchemy