MSAT - University of Bristol
MSAT - University of Bristol
MSAT - University of Bristol

You also want an ePaper? Increase the reach of your titles
YUMPU automatically turns print PDFs into web optimized ePapers that Google loves.
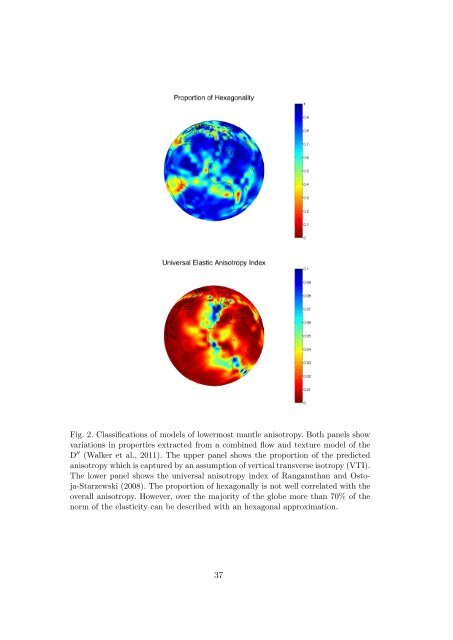
Fig. 2. Classifications <strong>of</strong> models <strong>of</strong> lowermost mantle anisotropy. Both panels show<br />
variations in properties extracted from a combined flow and texture model <strong>of</strong> the<br />
D ′′ (Walker et al., 2011). The upper panel shows the proportion <strong>of</strong> the predicted<br />
anisotropy which is captured by an assumption <strong>of</strong> vertical transverse isotropy (VTI).<br />
The lower panel shows the universal anisotropy index <strong>of</strong> Ranganathan and Ostoja-Starzewski<br />
(2008). The proportion <strong>of</strong> hexagonally is not well correlated with the<br />
overall anisotropy. However, over the majority <strong>of</strong> the globe more than 70% <strong>of</strong> the<br />
norm <strong>of</strong> the elasticity can be described with an hexagonal approximation.<br />
37