MSAT - University of Bristol
MSAT - University of Bristol
MSAT - University of Bristol

Create successful ePaper yourself
Turn your PDF publications into a flip-book with our unique Google optimized e-Paper software.
0.1<br />
A L1 Az = 30; L2 dip = 00 B L1 Az = 30; L2 dip = 30 C<br />
1<br />
Upper Γ<br />
Upper Γ<br />
0.9<br />
Lower Γ<br />
Lower Γ<br />
Eff. Γ<br />
Eff. Γ<br />
0.8<br />
0.7<br />
L1 Az = 60; L2 dip = 30<br />
Upper Γ<br />
Lower Γ<br />
Eff. Γ<br />
Lag times (s)<br />
0.6<br />
0.5<br />
0.4<br />
0.3<br />
0.2<br />
Fast shear−wave orientation (degree)<br />
80<br />
60<br />
40<br />
20<br />
0<br />
−20<br />
−40<br />
−60<br />
Upper Γ<br />
Lower Γ<br />
Eff. Γ<br />
Upper Γ<br />
Lower Γ<br />
Eff. Γ<br />
Upper Γ<br />
Lower Γ<br />
Eff. Γ<br />
−80<br />
0 50 100 150 200 250 300 350<br />
Polarisation (relative to downdip direction)<br />
0 50 100 150 200 250 300 350<br />
Polarisation (relative to downdip direction)<br />
0 50 100 150 200 250 300 350<br />
Polarisation (relative to downdip direction)<br />
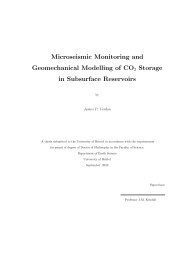
Fig. 4. Results <strong>of</strong> running the demonstration program split model. This shows<br />
the variation <strong>of</strong> the splitting parameters (δt and φ in the upper and lower panels<br />
respectively) with respect to source polarisation calculated using the model shown<br />
in figure 3. Three cases are shown: A, L1 Azimuth = 30, L2 Dip = 0; B, L1 Azimuth<br />
= 30, L2 Dip = 30; and C, L1 Azimuth = 60, L2 Dip = 30. The individual layer<br />
parameters are shown in the red and green dashed lines, the black line shows the<br />
effective splitting. The dashed part <strong>of</strong> the black lines are where the effective fast<br />
direction is nearly parallel or perpendicular to the source polarisation. This would<br />
result in a null result in real data (Wüstefeld and Bokelmann, 2007), and the effective<br />
splitting equations are unstable in such cases. While the dip influences the results<br />
(compare panels A and B), the strongest effect comes from the interaction between<br />
the orientation <strong>of</strong> the two layers with respect to the polarisation (compare panels<br />
B and C). The <strong>MSAT</strong> toolkit can be used to quickly implement and test simple<br />
models like these.<br />
39