BSL PRO Lesson H32 - Biopac
BSL PRO Lesson H32 - Biopac
BSL PRO Lesson H32 - Biopac

Create successful ePaper yourself
Turn your PDF publications into a flip-book with our unique Google optimized e-Paper software.
<strong>BSL</strong> <strong>PRO</strong> <strong>Lesson</strong> <strong>H32</strong><br />
Power spectral density plot:<br />
BIOPAC Systems, Inc.<br />
For a power spectral density plot, divide the square of the FFT by the spectral bandwidth (i.e. frequency<br />
increment of the FFT). The frequency increment will vary depending on the number of R-R Intervals used and<br />
on the sampling frequency of the raw data. To measure it:<br />
1. Click the horizontal scale of the FFT.<br />
2. Change the time to 0.01.<br />
3. Right-click or choose Display > Show > Dot Plot.<br />
4. Highlight a segment of data that contains only two (2) points.<br />
5. Set a measurement to delta F to obtain the frequency increment.<br />
6. Click Transform > Expression.<br />
a) Enter "(CH1*CH1)/(delta F frequency increment)" to square the<br />
waveform and divide it by the frequency increment, (in this case<br />
0.001907).<br />
b) Set Destination to New.<br />
c) Select "Transform entire waveform."<br />
d) Click "Scaling" and change volts to "msec square/Hz" or "sec<br />
square/Hz" to acquire the correct units.<br />
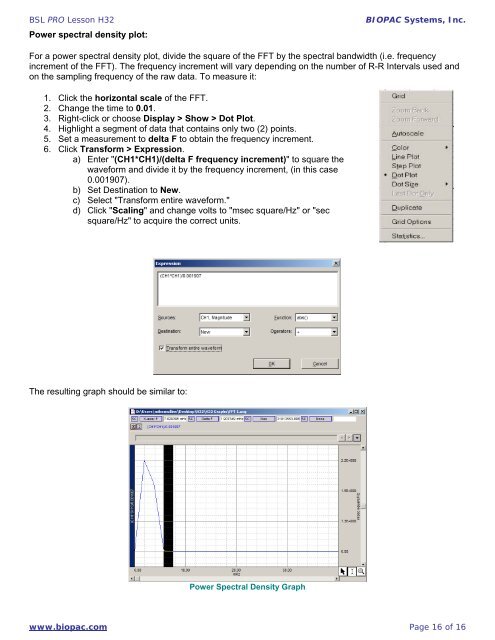
The resulting graph should be similar to:<br />
Power Spectral Density Graph<br />
www.biopac.com<br />
Page 16 of 16