Sustainability Plan - University of Washington Tacoma
Sustainability Plan - University of Washington Tacoma
Sustainability Plan - University of Washington Tacoma

Create successful ePaper yourself
Turn your PDF publications into a flip-book with our unique Google optimized e-Paper software.
<strong>Sustainability</strong><br />
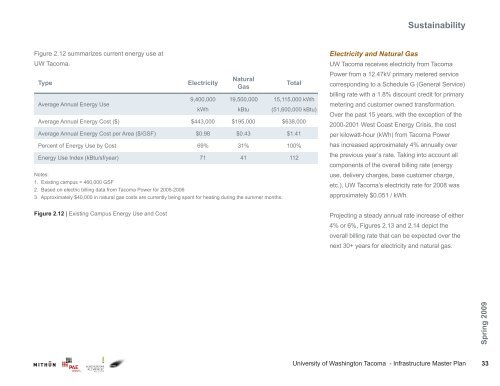
Figure 2.12 summarizes current energy use at<br />
UW <strong>Tacoma</strong>.<br />
Type<br />
Average Annual Energy Use<br />
Electricity<br />
9,400,000<br />
kWh<br />
Natural<br />
Gas<br />
19,500,000<br />
kBtu<br />
Total<br />
15,115,000 kWh<br />
(51,600,000 kBtu)<br />
Average Annual Energy Cost ($) $443,000 $195,000 $638,000<br />
Average Annual Energy Cost per Area ($/GSF) $0.98 $0.43 $1.41<br />
Percent <strong>of</strong> Energy Use by Cost 69% 31% 100%<br />
Energy Use Index (kBtu/sf/year) 71 41 112<br />
Notes:<br />
1. Existing campus = 460,000 GSF<br />
2. Based on electric billing data from <strong>Tacoma</strong> Power for 2005-2006<br />
3. Approximately $40,000 in natural gas costs are currently being spent for heating during the summer months.<br />
Electricity and Natural Gas<br />
UW <strong>Tacoma</strong> receives electricity from <strong>Tacoma</strong><br />
Power from a 12.47kV primary metered service<br />
corresponding to a Schedule G (General Service)<br />
billing rate with a 1.8% discount credit for primary<br />
metering and customer owned transformation.<br />
Over the past 15 years, with the exception <strong>of</strong> the<br />
2000-2001 West Coast Energy Crisis, the cost<br />
per kilowatt-hour (kWh) from <strong>Tacoma</strong> Power<br />
has increased approximately 4% annually over<br />
the previous year’s rate. Taking into account all<br />
components <strong>of</strong> the overall billing rate (energy<br />
use, delivery charges, base customer charge,<br />
etc.), UW <strong>Tacoma</strong>’s electricity rate for 2008 was<br />
approximately $0.051 / kWh.<br />
Figure 2.12 | Existing Campus Energy Use and Cost<br />
Projecting a steady annual rate increase <strong>of</strong> either<br />
4% or 6%, Figures 2.13 and 2.14 depict the<br />
overall billing rate that can be expected over the<br />
next 30+ years for electricity and natural gas.<br />
Spring 2009<br />
<strong>University</strong> <strong>of</strong> <strong>Washington</strong> <strong>Tacoma</strong> - Infrastructure Master <strong>Plan</strong><br />
33