Sustainability Plan - University of Washington Tacoma
Sustainability Plan - University of Washington Tacoma
Sustainability Plan - University of Washington Tacoma

Create successful ePaper yourself
Turn your PDF publications into a flip-book with our unique Google optimized e-Paper software.
<strong>Sustainability</strong><br />
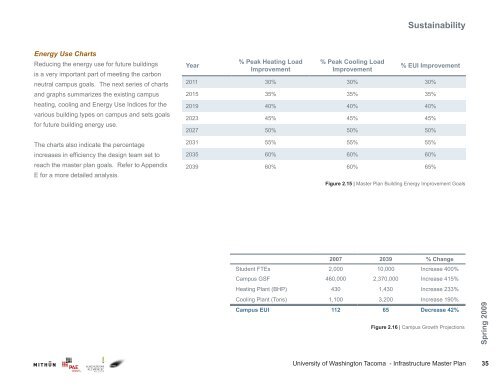
Energy Use Charts<br />
Reducing the energy use for future buildings<br />
is a very important part <strong>of</strong> meeting the carbon<br />
neutral campus goals. The next series <strong>of</strong> charts<br />
and graphs summarizes the existing campus<br />
heating, cooling and Energy Use Indices for the<br />
various building types on campus and sets goals<br />
for future building energy use.<br />
The charts also indicate the percentage<br />
increases in efficiency the design team set to<br />
reach the master plan goals. Refer to Appendix<br />
E for a more detailed analysis.<br />
Year<br />
% Peak Heating Load<br />
Improvement<br />
% Peak Cooling Load<br />
Improvement<br />
% EUI Improvement<br />
2011 30% 30% 30%<br />
2015 35% 35% 35%<br />
2019 40% 40% 40%<br />
2023 45% 45% 45%<br />
2027 50% 50% 50%<br />
2031 55% 55% 55%<br />
2035 60% 60% 60%<br />
2039 60% 60% 65%<br />
Figure 2.15 | Master <strong>Plan</strong> Building Energy Improvement Goals<br />
2007 2039 % Change<br />
Student FTEs 2,000 10,000 Increase 400%<br />
Campus GSF 460,000 2,370,000 Increase 415%<br />
Heating <strong>Plan</strong>t (BHP) 430 1,430 Increase 233%<br />
Cooling <strong>Plan</strong>t (Tons) 1,100 3,200 Increase 190%<br />
Campus EUI 112 65 Decrease 42%<br />
Figure 2.16 | Campus Growth Projections<br />
Spring 2009<br />
<strong>University</strong> <strong>of</strong> <strong>Washington</strong> <strong>Tacoma</strong> - Infrastructure Master <strong>Plan</strong><br />
35