LECTURE 18 - Cornell - Cornell University
LECTURE 18 - Cornell - Cornell University
LECTURE 18 - Cornell - Cornell University

Create successful ePaper yourself
Turn your PDF publications into a flip-book with our unique Google optimized e-Paper software.
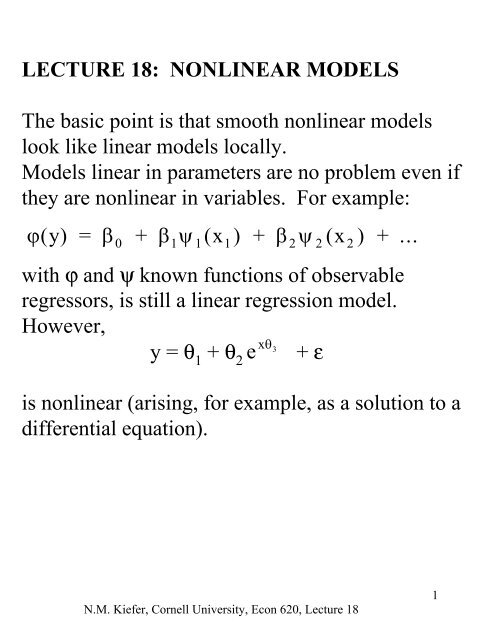
<strong>LECTURE</strong> <strong>18</strong>: NONLINEAR MODELS<br />
The basic point is that smooth nonlinear models<br />
look like linear models locally.<br />
Models linear in parameters are no problem even if<br />
they are nonlinear in variables. For example:<br />
ϕ( y) = β + β ψ ( x ) + β ψ ( x ) + ...<br />
0 1 1 1 2 2 2<br />
with ϕ and ψ known functions of observable<br />
regressors, is still a linear regression model.<br />
However,<br />
y = θ 1<br />
+ θ 2<br />
e xθ 3<br />
+ ε<br />
is nonlinear (arising, for example, as a solution to a<br />
differential equation).<br />
N.M. Kiefer, <strong>Cornell</strong> <strong>University</strong>, Econ 620, Lecture <strong>18</strong><br />
1
Notation:<br />
y i = f(X i ,θ) + ε i =f i (θ) + ε i<br />
i = 1,2, ..., N<br />
Stacking up yields<br />
y = f(θ) + ε<br />
where y is Nx1, f(θ) is Nx1, θ is Kx1 and ε is Nx1.<br />
For X i<br />
i = 1,2,...,N fixed, f: R K →R N .<br />
∂f<br />
∂θ′<br />
= F( θ) =<br />
⎡ ∂f1<br />
∂f1<br />
⎢<br />
. . .<br />
∂θ1<br />
∂θ<br />
⎢<br />
⎢<br />
. . . . .<br />
⎢<br />
⎢<br />
∂f<br />
∂<br />
⎢<br />
N<br />
f<br />
. . .<br />
⎣⎢<br />
∂θ1<br />
∂θ<br />
⎤<br />
⎥<br />
⎥<br />
⎥<br />
.<br />
⎥<br />
⎥<br />
⎥<br />
⎦⎥<br />
Obviously F(θ) is NxK. Assume Eε = 0 and<br />
Vε = σ 2 I.<br />
K<br />
N<br />
K<br />
N.M. Kiefer, <strong>Cornell</strong> <strong>University</strong>, Econ 620, Lecture <strong>18</strong><br />
2
The nonlinear least squares estimator minimizes<br />
S(θ) =<br />
N<br />
2<br />
∑ ( yi<br />
− fi( θ))<br />
= (y - f( θ)) ′ (y - f( θ)).<br />
i 1<br />
=<br />
Differentiation yields<br />
∂ ∂<br />
S(<br />
θ)=<br />
∂θ′<br />
∂θ′<br />
( y−<br />
f ( θ))<br />
′(y-f(<br />
θ))<br />
=-2(y-f( θ))F(<br />
′ θ).<br />
Thus, the nonlinear least squares (NLS) estimator<br />
$θ satisfies<br />
F( θ $ )( ′ y− f( θ $ )) = 0.<br />
(Are these equations familiar?)<br />
This is like the property<br />
method.<br />
Xe ′<br />
= 0 in the LS<br />
N.M. Kiefer, <strong>Cornell</strong> <strong>University</strong>, Econ 620, Lecture <strong>18</strong><br />
3
Computing $θ :<br />
The Gauss-Newton method is to use a first-order<br />
expansion of f(θ) around θ T<br />
(a "trial" value) in<br />
S(θ), giving<br />
S ( θ) = (y-f( θ T ) −F( θ )( θ− θ ))′( y−f( θ ) −F( θ )( θ−θ<br />
)).<br />
T T T T T T<br />
Minimizing S T<br />
in θ gives<br />
−1<br />
θM = θT + [F( θT )′ F( θT)] F( θT) ′( y−<br />
f( θT)).<br />
(Exercise: Show θ M<br />
is the minimizer.)<br />
We know S T<br />
(θ M<br />
) ≤ S T<br />
(θ T<br />
).<br />
Is it true that S(θ M<br />
)≤ S(θ T<br />
)?<br />
N.M. Kiefer, <strong>Cornell</strong> <strong>University</strong>, Econ 620, Lecture <strong>18</strong><br />
4
S<br />
S T (θ)<br />
S(θ)<br />
θ-hat<br />
θ M<br />
θ T<br />
θ<br />
S T (θ)<br />
θ M<br />
S(θ)<br />
θ-hat<br />
θ T<br />
N.M. Kiefer, <strong>Cornell</strong> <strong>University</strong>, Econ 620, Lecture <strong>18</strong><br />
5
The method is to use θ M<br />
for the new trial value,<br />
expand again, minimize and iterate. But there can<br />
be problems. For example, it is possible that<br />
S(θ M<br />
) > S(θ T<br />
), but there is a θ* between θ T<br />
and θ M<br />
,<br />
θ* = θ T<br />
+ λ(θ M<br />
-θ T<br />
)<br />
for some λ < 1, with S(θ*) ≤ S(θ T<br />
). This suggests<br />
trying a decreasing sequence of λ's in [0,1], leading<br />
to the modified Gauss-Newton method.<br />
(1) Start with θ T<br />
and compute<br />
−1<br />
D T<br />
= [ F( θ )′ F( θ )] F( θ )′( y−<br />
f( θ )).<br />
T T T T<br />
(2) Find λ such that S(θ T<br />
+ λD T<br />
) < S(θ T<br />
).<br />
(3) Set θ* = θ T<br />
+ λD T<br />
and go to (1) using θ* as<br />
a new value for θ T<br />
.<br />
N.M. Kiefer, <strong>Cornell</strong> <strong>University</strong>, Econ 620, Lecture <strong>18</strong><br />
6
Stop when the changes in parameter values and S<br />
between iterations are small. Good practice is to<br />
try several different starting values.<br />
Estimation of σ 2 = V(ε):<br />
s<br />
=<br />
(y - f( ˆ)) θ ′(y - f( ˆ))<br />
N − K<br />
2 θ<br />
σ$<br />
2 =<br />
(y - f( θ$ )) ′ (y - f( θ$<br />
))<br />
N<br />
Why are there two possibilities?<br />
N.M. Kiefer, <strong>Cornell</strong> <strong>University</strong>, Econ 620, Lecture <strong>18</strong><br />
7
Note the simplification possible when the<br />
model is linear in some of the parameters<br />
(as in the example)<br />
y = θ 1<br />
+ θ 2<br />
exp(θ 3<br />
x) + ε<br />
Here, given θ 3<br />
, the other parameters can<br />
be estimated by OLS. Thus the sum of<br />
squares function S can be concentrated,<br />
that is written as a function of one<br />
parameter alone. The nonlinear<br />
maximization problem is 1-dimensional,<br />
not 3. This is an important trick.<br />
We used the same device to estimate<br />
models with autocorrelation the ρ -<br />
differenced model could be estimated by<br />
OLS conditional on ρ.<br />
N.M. Kiefer, <strong>Cornell</strong> <strong>University</strong>, Econ 620, Lecture <strong>18</strong><br />
8
Inference:<br />
We can show that<br />
1<br />
$θ = θ 0<br />
+ F(<br />
θ )′<br />
F(<br />
θ ))<br />
− F(<br />
θ ) ε + r<br />
( ′<br />
0 0<br />
0<br />
where θ 0<br />
is the true parameter value and<br />
plim N 1/2 r = 0 (show). So r can be ignored in<br />
calculating the asymptotic distribution of $θ . This<br />
is just like the expression in the linear model -<br />
decomposing $β into the true value plus sampling<br />
error.<br />
Thus the asymptotic distribution of N 1/2 ( $θ -θ 0<br />
) is<br />
N<br />
⎛<br />
⎜<br />
2⎛ ( F(<br />
θ0)<br />
′ F(<br />
θ0)<br />
⎞<br />
0, σ<br />
⎜<br />
⎟<br />
⎝ ⎝ N ⎠<br />
−1<br />
⎞<br />
⎟.<br />
⎠<br />
So the approximate distribution of<br />
N(θ 0<br />
,σ 2<br />
−1<br />
( F( θ )′<br />
F( θ ))<br />
0 0<br />
$θ<br />
becomes<br />
N.M. Kiefer, <strong>Cornell</strong> <strong>University</strong>, Econ 620, Lecture <strong>18</strong><br />
9
In practice σ 2 is estimated by s 2 or σ<br />
and<br />
F( θ )′<br />
F( θ )<br />
0 0<br />
is estimated by<br />
F( θ $ )′<br />
F( θ $ ).<br />
Check that this is OK.<br />
Applications:<br />
1. The overidentified SEM is a nonlinear<br />
regression model (linear in variables, nonlinear in<br />
parameters) - consider the reduced form equations<br />
in terms of structural parameters.<br />
2. Many other models - more to come.<br />
$ 2<br />
N.M. Kiefer, <strong>Cornell</strong> <strong>University</strong>, Econ 620, Lecture <strong>18</strong><br />
10
Efficiency: Consider another consistent<br />
estimator θ * with “sampling error” in the<br />
form<br />
n 1/2 (θ*- θ)=<br />
1<br />
F(<br />
θ )′<br />
F(<br />
θ ))<br />
− F(<br />
θ )′<br />
ε +C’ε+r<br />
(<br />
0 0<br />
0<br />
It can be shown, in a proof like that of the<br />
Gauss-Markov Theorem, that the minimum<br />
variance estimator in this class (locally<br />
linear) has C=0.<br />
A better property holds when the errors are<br />
iid normal. Then, the NLS estimator is the<br />
MLE, and we have the Cramer-Rao<br />
efficiency result.<br />
N.M. Kiefer, <strong>Cornell</strong> <strong>University</strong>, Econ 620, Lecture <strong>18</strong><br />
11
Nonlinear SEM<br />
Let y i = f(Z i ,θ) + ε i =f i (θ) + ε I<br />
Where now Z is used to indicate included<br />
endogenous variables. NLS will not be<br />
consistent (why not?). The trick is to find<br />
instruments W and look at<br />
W’ y = W’f(θ) + W’ ε<br />
If the model is just-identified, we can just set<br />
W’ ε = 0 (its expected value) and solve.<br />
Otherwise, we can do nonlinear GLS,<br />
minimizing the variance-weighted sum of<br />
squares<br />
(y-f(θ))’W(W’W) -1 W’(y-f(θ))<br />
N.M. Kiefer, <strong>Cornell</strong> <strong>University</strong>, Econ 620, Lecture <strong>18</strong><br />
12
This θ-hat is called the nonlinear 2SLS<br />
estimator (by Amemiya, who studied its<br />
properties in 1974). Note that there are not<br />
two separate stages.<br />
Specifically, it might be tempting to just<br />
obtain a first-stage Z-hat = (I-M)Z = [Y 2 -<br />
hat,X 1 ] and do nonlinear regression of y on<br />
f(Z-hat, θ).<br />
This does not necessarily work. Z-hat is<br />
orthogonal to ε, but f may not be. In the<br />
linear regression case, we want Z-hat’ ε =0.<br />
The corresponding condition here is F-hat’<br />
ε=0. Since F-hat depends generally on θ,<br />
there is no real way to do this in stages.<br />
N.M. Kiefer, <strong>Cornell</strong> <strong>University</strong>, Econ 620, Lecture <strong>18</strong><br />
13
Asymptotic Distribution Theory<br />
n<br />
−1/2<br />
⎛<br />
2 ( (<br />
0)<br />
( ' )<br />
(<br />
0)<br />
⎜ ⎛ F θ ′ W W W<br />
θ −θ<br />
→ N 0, σ ⎜<br />
⎜<br />
⎝ ⎝ N<br />
−1<br />
W'<br />
F(<br />
θ0)<br />
⎞<br />
⎟<br />
⎠<br />
−1<br />
⎞<br />
⎟.<br />
⎟<br />
⎠<br />
In practice σ 2 is estimated by<br />
(or over n-k)<br />
(y-f(Z, θhat)’(y-f(Z, θhat)/n<br />
and F(θ 0 ) is estimated by F(θhat)<br />
Don’t forget to remove the factor N -1 in the<br />
variance when approximating the variance of<br />
your estimator.<br />
The calculation is exactly like the usual<br />
calculation of the variance of the GLS<br />
estimator<br />
N.M. Kiefer, <strong>Cornell</strong> <strong>University</strong>, Econ 620, Lecture <strong>18</strong><br />
14
Proposition:<br />
∑<br />
∞<br />
MISCELLANEOUS:<br />
2<br />
( f i ( θ ) ( θ )) θ θ<br />
i 1 0 - f ′ = ∞ , ′ ≠<br />
=<br />
i 0<br />
is necessary for the existence of a consistent<br />
NLS estimator. (Compare this with OLS).<br />
Funny example: Consider y i = e -αi + ε i<br />
where<br />
α∈(0,2π) and V(ε i ) = σ 2 . Is there a consistent<br />
estimator?<br />
Consistency can be shown (generally, not just in<br />
this example) using regularity conditions, not<br />
requiring derivatives. Normality can be shown<br />
using first but not second derivatives .<br />
N.M. Kiefer, <strong>Cornell</strong> <strong>University</strong>, Econ 620, Lecture <strong>18</strong><br />
15
Many models can be set up as nonlinear<br />
regressions - like qualitative dependent variable<br />
models. Sometimes it is hard to interpret<br />
parameters. We might be interested in functions<br />
of parameters, for example elasticities.<br />
Tests on functions of parameters:<br />
Remember the delta-method. Let $θ ~ N(θ 0<br />
,Σ) be<br />
a consistent estimator of θ whose true value is<br />
θ 0<br />
. Suppose g(θ) is the quantity of interest.<br />
Expanding g( $θ ) around θ 0<br />
yields<br />
g( $ ∂g<br />
θ) = g( θ ) ( θ $ 0 + θ= θ − θ0)<br />
0<br />
∂θ<br />
+ more.<br />
N.M. Kiefer, <strong>Cornell</strong> <strong>University</strong>, Econ 620, Lecture <strong>18</strong><br />
16
This implies that<br />
g<br />
Vg ( ( $ )) $ 2 ∂g<br />
∂<br />
θ = E(g( θ) - g( θ0<br />
)) ≈ ⎛ ′<br />
.<br />
⎝ ⎜ ⎞ ⎛ ⎞<br />
⎟ Σ⎜<br />
⎟<br />
∂θ ⎠ ⎝ ∂θ ⎠<br />
0 0<br />
Asymptotically, g( $θ ) ~ N(g(θ 0<br />
), V(g( $θ )).<br />
This is a very useful method. It also shows that<br />
normal approximation may be poor. (why?)<br />
How can the normal approximation be<br />
improved? This is a deep question. One trick is<br />
to choose a parametrization for which ∂ 2 l/∂θ∂θ′<br />
is constant or nearly so. Why does this work?<br />
Consider the Taylor expansion of the score … .<br />
N.M. Kiefer, <strong>Cornell</strong> <strong>University</strong>, Econ 620, Lecture <strong>18</strong><br />
17