University Corporation for Atmospheric Research FY2008 Summary ...
University Corporation for Atmospheric Research FY2008 Summary ...
University Corporation for Atmospheric Research FY2008 Summary ...

You also want an ePaper? Increase the reach of your titles
YUMPU automatically turns print PDFs into web optimized ePapers that Google loves.
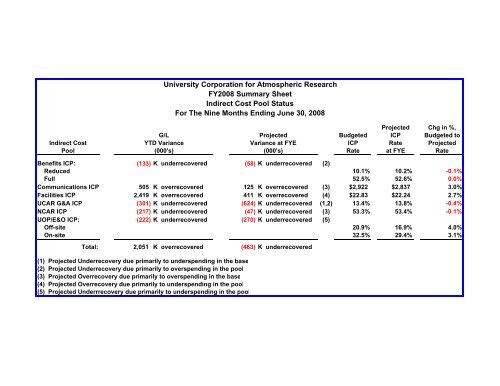
<strong>University</strong> <strong>Corporation</strong> <strong>for</strong> <strong>Atmospheric</strong> <strong>Research</strong><br />
<strong>FY2008</strong> <strong>Summary</strong> Sheet<br />
Indirect Cost Pool Status<br />
For The Nine Months Ending June 30, 2008<br />
Projected Chg in %,<br />
G/L<br />
Projected<br />
Budgeted ICP Budgeted to<br />
Indirect Cost YTD Variance<br />
Variance at FYE<br />
ICP Rate Projected<br />
Pool (000's)<br />
(000's)<br />
Rate at FYE Rate<br />
Benefits ICP: (133) K underrecovered (58) K underrecovered (2)<br />
Reduced 10.1% 10.2% -0.1%<br />
Full 52.5% 52.6% 0.0%<br />
Communications ICP 505 K overrecovered 125 K overrecovered (3) $2,922 $2,837 3.0%<br />
Facilities ICP 2,419 K overrecovered 411 K overrecovered (4) $22.83 $22.24 2.7%<br />
UCAR G&A ICP (301) K underrecovered (624) K underrecovered (1,2) 13.4% 13.8% -0.4%<br />
NCAR ICP (217) K underrecovered (47) K underrecovered (3) 53.3% 53.4% -0.1%<br />
UOP/E&O ICP: (222) K underrecovered (270) K underrecovered (5)<br />
Off-site 20.9% 16.9% 4.0%<br />
On-site 32.5% 29.4% 3.1%<br />
Total: 2,051 K overrecovered (463) K underrecovered<br />
(1) Projected Underrecovery due primarily to underspending in the base<br />
(2) Projected Underrecovery due primarily to overspending in the pool<br />
(3) Projected Overrecovery due primarily to overspending in the base<br />
(4) Projected Overrecovery due primarily to underspending in the pool<br />
(5) Projected Underrrecovery due primarily to underspending in the pool
<strong>University</strong> <strong>Corporation</strong> <strong>for</strong> <strong>Atmospheric</strong> <strong>Research</strong><br />
Variance and Rate Projections to <strong>FY2008</strong> Year-End<br />
Numerator/Denominator In<strong>for</strong>mation by Cost Pool<br />
For The Nine Months Ending June 30, 2008<br />
Difference<br />
(Over)/Under<br />
Budgeted <strong>for</strong> Budgeted Projected Projected Projected to<br />
Benefits: <strong>FY2008</strong> Rate <strong>FY2008</strong> FYE Rate Budget<br />
Cost Pool <strong>for</strong> casual employees $ 8,691,889<br />
$ 8,641,889<br />
50,000<br />
Base <strong>for</strong> all employees (including casual) $ 85,800,000 10.1% $ 84,700,000 10.2% 1,100,000<br />
Cost Pool <strong>for</strong> fully benefited employees $ 35,695,000<br />
$ 35,375,000<br />
320,000<br />
Base <strong>for</strong> fully benefited employees $ 84,200,000 42.4% $ 83,500,000 42.4% 700,000<br />
52.5% 52.6%<br />
Communications:<br />
Facilities:<br />
UCAR G&A:<br />
Cost Pool $ 4,154,976<br />
$ 4,154,976<br />
0<br />
Base (Headcount) 1,422 $2,922 1,465 $2,837 (43)<br />
Cost Pool $ 16,364,929<br />
$ 15,578,861<br />
786,068<br />
Base (Square Footage) 716,750 $22.83 700,410 $22.24 16,340<br />
Cost Pool $ 20,595,895<br />
$ 20,725,961<br />
(130,066)<br />
Base (MTDC) $ 153,614,041 13.4% $ 150,018,112 13.8% 3,595,929<br />
NCAR:<br />
Cost Pool $ 46,529,570<br />
$ 46,100,288<br />
429,282<br />
Base (MTDC) $ 87,300,000 53.3% $ 86,403,985 53.4% 896,015<br />
UOP/E&O:<br />
UOP/E&O All Site Cost Pool $ 6,164,514<br />
$ 4,623,386<br />
1,541,129<br />
UOP/E&O All Site Base (Total MTDC) $ 29,477,908<br />
$ 27,333,667<br />
2,144,241<br />
Off Site Indirect Cost Rate 20.9% 16.9%<br />
Facility and Communication Allocations $ 2,319,355<br />
$ 2,262,411<br />
56,944<br />
On Site Base (Boulder MTDC) $ 20,078,803<br />
$ 18,170,254<br />
1,908,549<br />
Additional percentage <strong>for</strong> On Site Only 11.6% 12.5%<br />
On Site Indirect Cost Rate 32.5% 29.4%
<strong>University</strong> <strong>Corporation</strong> <strong>for</strong> <strong>Atmospheric</strong> <strong>Research</strong><br />
UCAR Benefit Pool<br />
<strong>FY2008</strong> ICP as of June 30, 2008<br />
Expenditures<br />
Base<br />
Projected<br />
Straight-line Projected Year End<br />
<strong>FY2008</strong> Budget at Year to Date Year End (Over)/Under FYE<br />
Regular Employee: Budget Nine Months Expenditures Expenditures Budget Benefit Rate Budgeted Projection<br />
Regular Employee Benefits<br />
Group Life and Major Medical 8,800,000 6,600,000 6,129,196 8,500,000 300,000 Cost Pool <strong>for</strong> Regular Employees 35,695,000 35,375,000<br />
TIAA/CREF 9,725,000 7,293,750 6,923,777 9,800,000 (75,000) Total Regular Employee Base 84,200,000 83,500,000<br />
Educational Assistance 250,000 187,500 200,057 270,000 (20,000)<br />
Disability 820,000 615,000 598,603 910,000 (90,000) Cost Pool <strong>for</strong> Casual Employees 8,691,889 8,641,889<br />
Severance 500,000 375,000 179,940 400,000 100,000 Base <strong>for</strong> Regular and Casual Employees 85,800,000 84,700,000<br />
Subtotal: Regular Employee Benefits 20,095,000 15,071,250 14,031,574 19,880,000 215,000<br />
Benefit Rate Regular Employees 42.4% 42.4%<br />
Holiday 3,310,000 2,482,500 2,619,599 3,400,000 (90,000) Benefit Rate Casual Employees 10.1% 10.2%<br />
Vacation, Sick Leave, PTO<br />
Vacation 3,600,000 2,700,000 2,001,811 2,800,000 800,000<br />
Sick Leave/SLR/SCP/FSL/FDL 1,940,000 1,455,000 1,312,882 1,790,000 150,000<br />
PTO 6,600,000 4,950,000 5,249,481 7,400,000 (800,000)<br />
Subtotal: Vacation, Sick Leave, PTO 12,140,000 9,105,000 8,564,175 11,990,000 150,000<br />
Other Non-Work Time 150,000 112,500 85,466 105,000 45,000<br />
TOTAL REGULAR EMPLOYEE 35,695,000 26,771,250 25,300,814 35,375,000 320,000 BENEFIT POOL RATE 52.5% 52.6%<br />
Casual Employee:<br />
Projected Variance Calculation:<br />
FICA 6,900,000 5,175,000 4,873,161 6,925,000 (25,000)<br />
Travel Insurance 40,000 30,000 22,061 45,000 (5,000) Budgeted Regular Employee Rate 42.4%<br />
Unemployment Insurance 60,000 45,000 84,289 110,000 (50,000) Proj. Regular Employee Base 83,500,000<br />
Worker's Compensation 500,000 375,000 308,806 320,000 180,000 Subtotal 35,404,000<br />
Miscellaneous Other 250,000 187,500 248,410 300,000 (50,000)<br />
Budgeted Casual Employee Rate 10.1%<br />
TOTAL CASUAL EMPLOYEE 7,750,000 5,812,500 5,536,727 7,700,000 50,000 Proj. Casual and Regular Employee Base 84,700,000<br />
Subtotal 8,554,700<br />
GRAND TOTAL 43,445,000 32,583,750 30,837,541 43,075,000 370,000<br />
TOTAL Cost Pool Recovery 43,958,700<br />
Prior Year Variance 941,889 706,417 706,416 941,889 0 Less Projected ICP Expenses 44,016,889<br />
Projected FYE Variance (58,189)<br />
TOTAL BENEFIT POOL 44,386,889 33,290,167 31,543,957 44,016,889 370,000
<strong>University</strong> <strong>Corporation</strong> <strong>for</strong> <strong>Atmospheric</strong> <strong>Research</strong><br />
Communications<br />
<strong>FY2008</strong> ICP as of June 30, 2008<br />
Expenditures<br />
Base<br />
Projected<br />
Straight-line Projected Year End<br />
<strong>FY2008</strong> Budget at Year to Date Year to Date Year End (Over)/Under FYE<br />
Budget Nine Months Expenditures Encumbrances Expenditures Budget Communications Budgeted Projection<br />
Indirect Cost Pool 4,154,976 4,154,976<br />
Network Engineering and Technology 3,974,270 2,980,703 2,577,278 926,414 3,974,270 0<br />
Enterprise Services 460,200 345,150 308,142 90,566 460,200 0 Headcount Base 1,422 1,465<br />
Network Security 161,680 121,260 102,922 24,955 161,680 0<br />
Indirect Cost Rate $2,922 $2,837<br />
Division Total 4,596,150 3,447,113 2,988,342 1,041,935 4,596,150 0<br />
Total ICP Be<strong>for</strong>e Variance 4,596,150 3,447,113 2,988,342 1,041,935 4,596,150 0 Projected Variance Calculation:<br />
Prior Year Variance (441,174) (330,881) (330,881) 0 (441,174) 0 Budgeted Indirect Cost Rate $2,922<br />
Projected Base 1,465<br />
Projected Cost Pool Recovery 4,279,483<br />
Projected Cost Pool Expenditures 4,154,976<br />
Total Communications ICP 4,154,976 3,116,232 2,657,461 1,041,935 4,154,976 0 Projected FYE Variance 124,507
<strong>University</strong> <strong>Corporation</strong> <strong>for</strong> <strong>Atmospheric</strong> <strong>Research</strong><br />
Facilities<br />
<strong>FY2008</strong> ICP as of June 30, 2008<br />
Expenditures<br />
Base<br />
Projected<br />
Straight-line Projected Year End<br />
<strong>FY2008</strong> Budget at Year to Date Year to Date Year End (Over)/Under FYE<br />
Budget Nine Months Expenditures Encumbrances Expenditures Budget Facilities Budgeted Projection<br />
Building & Maintenance 2,867,950 2,150,963 1,925,587 627,103 2,544,415 323,535 Indirect Cost Pool 16,364,929 15,578,861<br />
Engineering and Space Management 436,450 327,338 261,376 134,348 403,062 33,388<br />
Move and Remodel 328,000 246,000 195,491 63,964 321,000 7,000 Square Footage Base 716,750 700,410<br />
Space Project Office 475,800 356,850 352,794 94,231 475,800 0<br />
Utilities 2,289,100 1,716,825 1,014,528 0 1,808,000 481,100 Indirect Cost Rate $22.83 $22.24<br />
Custodial 792,360 594,270 559,871 353,323 871,000 (78,640)<br />
Administration 119,420 89,565 110,298 9,975 121,593 (2,173)<br />
Leases 842,000 631,500 625,984 293,540 815,896 26,104<br />
Building Debt Service 6,195,000 4,646,250 3,077,854 0 6,195,000 0<br />
Logistics Operations 507,880 380,910 339,453 108,116 507,880 0<br />
Security 973,320 729,990 616,600 1,017,715 973,320 0<br />
Health, Environment, and Safety 107,030 80,273 88,201 14,706 107,030 0<br />
Conference Support 458,200 343,650 310,543 91,604 458,200 0<br />
Division Total 16,392,510 12,294,383 9,478,581 2,808,625 15,602,196 790,314<br />
Communications Allocation 157,784 118,338 120,007 0 162,030 (4,246) Projected Variance Calculation:<br />
Total ICP Be<strong>for</strong>e Variance 16,550,294 12,412,721 9,598,588 2,808,625 15,764,226 786,068 Budgeted Indirect Cost Rate $22.83<br />
Projected Facility Base 700,410<br />
Prior Year Variance (185,365) (139,024) (139,024) 0 (185,365) 0 Projected Cost Pool Recovery 15,990,351<br />
Projected Facility Cost Pool Expenditures 15,578,861<br />
Total Facilities ICP 16,364,929 12,273,697 9,459,564 2,808,625 15,578,861 786,068 Projected FYE Variance 411,491
<strong>University</strong> <strong>Corporation</strong> <strong>for</strong> <strong>Atmospheric</strong> <strong>Research</strong><br />
UCAR General and Administrative<br />
<strong>FY2008</strong> ICP as of June 30, 2008<br />
Expenditures<br />
Base<br />
Projected<br />
Straight-line Projected Year End<br />
<strong>FY2008</strong> Budget at Year to Date Year to Date Year End (Over)/Under FYE<br />
Budget Nine Months Expenditures Encumbrances Expenditures Budget G&A Indirect Cost Rate Budgeted Projection<br />
Presidents Office 826,560 619,920 662,984 236,116 926,277 (99,717) Indirect Cost Pool 20,595,895 20,725,961<br />
VP Corporate Affairs 348,200 261,150 258,591 98,613 362,200 (14,000)<br />
Trustees - Members 196,000 147,000 145,407 66,126 213,000 (17,000) Modified Total Direct Cost Base 153,614,041 150,018,112<br />
UCAR Communications 1,152,550 864,413 726,501 273,965 956,518 196,032<br />
Development 119,982 89,987 82,633 34,217 111,852 8,130 Indirect Cost Rate 13.4% 13.8%<br />
Government Affairs 494,812 371,109 362,895 80,236 482,024 12,788<br />
Archives 136,855 102,641 95,067 29,444 136,855 0<br />
VP Finance & Administration 359,850 269,888 208,753 132,076 340,829 19,021<br />
Treasury 337,070 252,803 226,617 85,405 339,744 (2,674)<br />
Special Projects & IA 10,000 7,500 29,314 10,599 39,913 (29,913)<br />
Office of General Counsel 1,201,050 900,788 756,564 148,740 1,203,800 (2,750)<br />
AVP Business Services 300,750 225,563 205,614 99,509 311,184 (10,434)<br />
Contracts & Sponsored Agreements 1,450,900 1,088,175 1,005,262 392,481 1,446,168 4,732<br />
In<strong>for</strong>mation Technology 3,508,900 2,631,675 2,368,940 838,135 3,680,520 (171,620)<br />
Budget & Finance 2,101,840 1,576,380 1,501,442 569,967 2,132,436 (30,596)<br />
Human Resources 1,579,600 1,184,700 1,126,209 432,941 1,580,971 (1,371)<br />
EAC 28,500 21,375 17,989 0 28,500 0<br />
Safety and Site Services 334,950 251,213 232,440 81,441 327,450 7,500<br />
SaSS Administration 343,560 257,670 198,428 102,798 343,560 0<br />
Transportation Services (shuttle) 389,150 291,863 268,776 80,343 389,150 0<br />
Administrative Support 36,000 27,000 27,622 41,579 35,346 654<br />
Library 1,463,133 1,097,350 1,138,485 227,970 1,461,981 1,152<br />
Community and Public Service 1,196,050 897,038 781,778 308,778 1,196,050 0<br />
UCAR Webmaster 454,850 341,138 311,671 99,801 454,850 0<br />
UCAR Officers 62,750 47,063 44,961 17,593 62,750 0<br />
Division Total 18,433,862 13,825,397 12,784,943 4,488,872 18,563,928 (130,066)<br />
Communications Allocation 479,196 359,397 369,287 0 479,196 0<br />
Facilities Allocation 1,940,731 1,455,548 1,471,826 0 1,940,731 0 Projected Variance Calculation:<br />
Total ICP Be<strong>for</strong>e Variance 20,853,789 15,640,342 14,626,057 4,488,872 20,983,855 (130,066)<br />
Budgeted Indirect Cost Rate 13.4%<br />
Prior Year Variance (257,894) (193,421) (193,421) 0 (257,894) 0 Projected G&A Base 150,018,112<br />
Projected Cost Pool Recovery 20,102,427<br />
Projected G&A Cost Pool Expenditures 20,725,961<br />
Total UCAR G&A ICP 20,595,895 15,446,921 14,432,636 4,488,872 20,725,961 (130,066) Projected FYE Variance (623,534)
<strong>University</strong> <strong>Corporation</strong> <strong>for</strong> <strong>Atmospheric</strong> <strong>Research</strong><br />
National Center <strong>for</strong> <strong>Atmospheric</strong> <strong>Research</strong><br />
<strong>FY2008</strong> ICP as of June 30, 2008<br />
Expenditures<br />
Projected<br />
Straight-line Projected Year End Estimated * Nine Months Year Projected<br />
<strong>FY2008</strong> Budget at Year to Date Year to Date (Over)/Under Base at Original to Year End<br />
Budget Nine Months Expenditures Encumbrances Budget Expenditures Estimate Date MTDC<br />
CISL Assoc Director's Office 485,808 364,356 554,726 223,220 863,772 (377,964)<br />
IMAGe 335,965 251,974 204,865 65,775 298,869 37,097 2,054,311 1,540,733 1,576,392 2,218,554<br />
SCD 976,372 732,279 435,474 152,338 630,627 345,745 12,282,875 9,212,156 8,649,435 11,991,698<br />
Subtotal CISL 1,798,146 1,348,610 1,195,066 441,332 1,793,268 4,878 14,337,186 10,752,889 10,225,827 14,210,251<br />
MTDC<br />
EOL Assoc Director's Office<br />
EOL 2,272,305 1,704,229 1,517,168 592,258 2,263,613 8,692 18,611,966 13,958,974 11,765,093 17,407,471<br />
Subtotal EOL 2,272,305 1,704,229 1,517,168 592,258 2,263,613 8,692 18,611,966 13,958,974 11,765,093 17,407,471<br />
ESSL Assoc Director's Office 379,766 284,824 480,609 172,963 670,133 (290,367) 30,412 22,809 39,738 128,050<br />
TIMES 419,668 314,751 267,671 102,580 395,425 24,243 2,234,331 1,675,748 1,564,373 2,088,416<br />
CGD 1,070,186 802,640 652,981 234,850 976,842 93,344 9,019,150 6,764,362 6,457,712 8,951,058<br />
ACD 1,015,801 761,851 707,274 228,036 1,014,745 1,056 8,444,318 6,333,238 6,232,745 8,537,000<br />
HAO 922,589 691,942 744,536 255,368 993,082 (70,492) 7,085,501 5,314,126 5,071,135 7,199,036<br />
MMM 1,013,652 760,239 695,874 263,394 993,584 20,068 7,148,159 5,361,119 5,338,112 7,480,115<br />
Subtotal ESSL 4,821,662 3,616,247 3,548,945 1,257,191 5,043,810 (222,148) 33,961,870 25,471,402 24,703,815 34,383,674<br />
RAL Assoc Director's Office 0<br />
RAP 2,827,364 2,120,523 1,963,351 749,299 2,913,761 (86,397) 15,824,226 11,868,169 11,537,352 16,235,350<br />
ISSE 413,054 309,791 196,978 63,019 260,039 153,016 1,800,373 1,350,280 1,158,929 1,758,000<br />
Subtotal RAL 3,240,418 2,430,314 2,160,330 812,318 3,173,800 66,618 17,624,599 13,218,449 12,696,281 17,993,350<br />
SERE Assoc Director's Office 437,163 327,872 359,071 4,701 434,854 2,309 191,886 143,914 33,270 11,952<br />
Subtotal SERE 437,163 327,872 359,071 4,701 434,854 2,309 191,886 143,914 33,270 11,952<br />
ASP 404,650 303,487 233,738 87,144 338,621 66,028 2,007,173 1,505,380 1,200,024 1,785,242<br />
CCB 46,248 34,686 25,996 11,465 46,678 (430) 484,224 363,168 364,250 515,846<br />
Subttl NCAR Wide Program 450,898 338,173 259,734 98,609 385,300 65,598 2,491,396 1,868,547 1,564,274 2,301,087<br />
Laboratories Total 13,020,592 9,765,444 9,040,313 3,206,410 13,094,645 (74,053) 87,218,902 65,414,177 60,988,560 86,307,785<br />
NCAR Director's Office 2,380,910 1,785,683 1,512,385 565,449 2,222,108 158,802 81,098 60,823 124,831 96,200<br />
Division Total 15,401,502 11,551,127 10,552,699 3,771,859 15,316,753 84,749 87,300,000 65,475,000 61,113,391 86,403,985<br />
* Includes anticipated MTDC growth prorated to Lab/Div<br />
NCAR Indirect Cost Rate:<br />
FYE<br />
Budgeted Projected<br />
FYE ICP Expenditures 46,529,570 46,100,288<br />
Modified Total Direct Cost Base 87,300,000 86,403,985<br />
Communications Allocation 2,892,705 2,169,529 2,247,142 0 3,047,101 (154,396) Indirect Cost Rate 53.3% 53.4%<br />
Facilities Allocation 12,557,671 9,418,253 9,055,561 0 12,223,224 334,447<br />
G&A Allocation 15,841,284 11,880,963 11,057,836 0 15,676,802 164,482 Projected Variance Calculation:<br />
NCAR Indirect Cost Rate 53.3%<br />
Total ICP Be<strong>for</strong>e Variance 46,693,162 35,019,872 32,913,239 3,771,859 46,263,880 429,282 Projected NCAR Base 86,403,985<br />
Projected NCAR Cost Pool Recovery 46,053,324<br />
Prior Year Variance (163,592) (122,694) (122,694) 0 (163,592) 0 Projected NCAR Cost Pool Expenditures 46,100,288<br />
Total NCAR ICP 46,529,570 34,897,177 32,790,544 3,771,859 46,100,288 429,282 Projected FYE Variance (46,964)
<strong>University</strong> <strong>Corporation</strong> <strong>for</strong> <strong>Atmospheric</strong> <strong>Research</strong><br />
UCAR Office of Programs/Education and Outreach<br />
<strong>FY2008</strong> ICP as of June 30, 2008<br />
Expenditures<br />
MTDC<br />
Projected<br />
Straight-line Projected Year End Estimated Nine Months Year Projected<br />
<strong>FY2008</strong> Budget at Year to Date Year to Date Year End (Over)/Under Base at Original to Year End<br />
Budget Nine Months Expenditures Encumbrances Expenditures Budget Expenditures Estimate Date MTDC<br />
JOSS 280,587 210,440 171,239 109,348 280,587 0 JOSS 7,073,408 5,305,056 4,311,976 6,224,883<br />
UNIDATA 113,304 84,978 82,757 30,547 113,304 0 UNIDATA 3,113,855 2,335,391 2,159,750 3,117,872<br />
VSP 210,592 157,944 142,469 68,123 210,592 0 VSP 6,657,379 4,993,034 4,552,454 6,572,042<br />
NSDL 38,590 28,943 23,956 0 38,590 0 NSDL 1,490,145 1,117,609 1,121,131 1,618,495<br />
COMET 146,459 109,844 75,703 70,756 146,459 0 COMET 4,428,248 3,321,186 2,557,943 3,692,714<br />
DLS 36,372 27,279 41,625 4,746 36,372 0 DPC 628,026 471,020 557,872 805,359<br />
COSMIC 68,833 51,625 40,610 28,223 68,833 0 COSMIC 1,983,569 1,487,677 1,211,654 1,749,175<br />
GLOBE 98,082 73,562 33,381 64,701 98,082 0 GLOBE 2,963,405 2,222,554 1,611,055 2,325,762<br />
Education & Outreach 124,112 93,084 95,554 28,558 124,112 0 Education & Outreach 1,104,732 828,549 812,750 1,173,308<br />
UOP Director 35,139 26,354 37,445 54,057<br />
29,477,906 22,108,430 18,934,031 27,333,667<br />
Division Total 1,116,931 837,698 707,295 405,001 1,116,931 0<br />
UOP/E&O Indirect Cost Rate:<br />
FYE<br />
UOP/E&O Director 547,969 410,977 340,111 187,858 527,969 20,000 Budgeted Projected<br />
UOP/E&O Bid and Proposal 0 0 0 0 0 0 Indirect Cost Pool:<br />
UOP/E&O Graphics Subsidy 0 0 0 0 0 0 Applicable to All Sites 6,164,514 4,623,386<br />
On-Site - Add Com & Facil 2,319,355 2,262,411<br />
8,483,869 6,885,797<br />
Subtotal 547,969 410,977 340,111 187,858 527,969 20,000 Total Modified Direct Cost Base:<br />
All Sites 29,477,908 27,333,667<br />
Communications Allocation 572,697 429,523 392,763 0 529,194 43,503 On-Site 20,078,803 18,170,254<br />
Facilities Allocation 1,746,658 1,309,994 1,287,023 0 1,719,289 27,369 Off-Site 9,399,105 9,163,413<br />
G&A Allocation 4,486,460 3,364,845 2,902,579 0 4,184,425 302,035<br />
Indirect Cost Rates:<br />
Off-Site Rate 20.9% 16.9%<br />
Total ICP Be<strong>for</strong>e Variance 8,470,715 6,353,036 5,629,770 592,859 8,077,807 392,908 Add Occupancy <strong>for</strong> On-Site Rate 11.6% 12.5%<br />
On-Site Rate 32.5% 29.4%<br />
Prior Year Variance 13,154 9,866 9,866 0 13,154 0<br />
Total UOP/E&O ICP 8,483,869 6,362,902 5,639,636 592,859 8,090,962 392,908<br />
Projected Variance Calculation:<br />
Budgeted Indirect Cost Rate On Site 32.5%<br />
Projected On Site Base 18,170,254<br />
Projected On Site Cost Recovery 5,905,333<br />
Budgeted Off Site Rate 20.9%<br />
Projected Off Site Base 9,163,413<br />
Projected Off Site Cost Recovery 1,915,153<br />
Projected UOP Cost Pool Recovery 7,820,486<br />
Projected UOP Cost Pool Expenditures 8,090,962<br />
Projected FYE Variance (270,477)
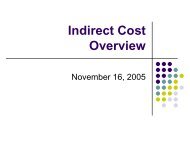
NCAR Total MTDC Spending<br />
80,000,000<br />
70,000,000<br />
60,000,000<br />
June<br />
MTDC<br />
$61.1M<br />
FY08 MTDC<br />
Projection<br />
$86.4M<br />
50,000,000<br />
40,000,000<br />
30,000,000<br />
FY 2006<br />
FY 2007<br />
FY 2008<br />
Projection<br />
20,000,000<br />
10,000,000<br />
0<br />
Oct Nov Dec Jan Feb Mar Apr May Jun Jul Aug Sep
30,000,000<br />
25,000,000<br />
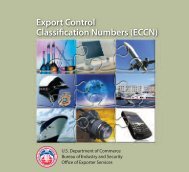
UOP/E&O Total MTDC Spending<br />
June<br />
MTDC<br />
$18.9M<br />
FY08 MTDC<br />
Projection<br />
$27.3M<br />
20,000,000<br />
15,000,000<br />
10,000,000<br />
FY06<br />
FY07<br />
FY08<br />
Projection<br />
5,000,000<br />
0<br />
Oct Nov Dec Jan Feb Mar Apr May Jun Jul Aug Sep