Resource Sampler - Pearson
Resource Sampler - Pearson
Resource Sampler - Pearson

You also want an ePaper? Increase the reach of your titles
YUMPU automatically turns print PDFs into web optimized ePapers that Google loves.
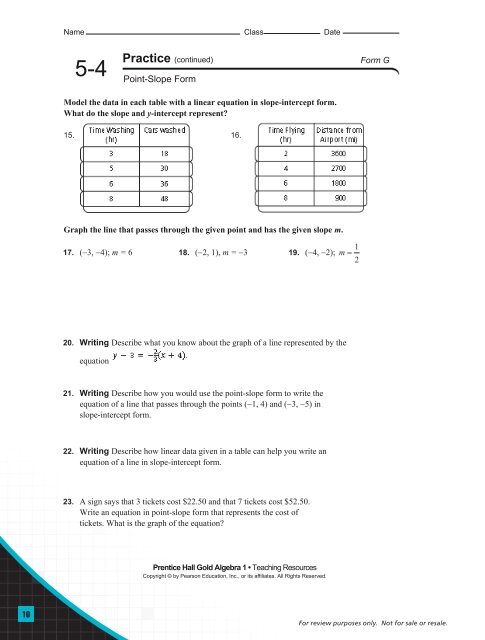
Name Class Date<br />
5-4<br />
Practice (continued) Form G<br />
Point-Slope Form<br />
Model the data in each table with a linear equation in slope-intercept form.<br />
What do the slope and y-intercept represent?<br />
15. 16.<br />
Graph the line that passes through the given point and has the given slope m.<br />
17. (−3, −4); m = 6 18. (−2, 1), m = −3 19. (−4, −2);<br />
1<br />
m =<br />
2<br />
20. Writing Describe what you know about the graph of a line represented by the<br />
equation<br />
21. Writing Describe how you would use the point-slope form to write the<br />
equation of a line that passes through the points (−1, 4) and (−3, −5) in<br />
slope-intercept form.<br />
22. Writing Describe how linear data given in a table can help you write an<br />
equation of a line in slope-intercept form.<br />
23. A sign says that 3 tickets cost $22.50 and that 7 tickets cost $52.50.<br />
Write an equation in point-slope form that represents the cost of<br />
tickets. What is the graph of the equation?<br />
Prentice Hall Gold Algebra 1 • Teaching <strong>Resource</strong>s<br />
Copyright © by <strong>Pearson</strong> Education, Inc., or its affiliates. All Rights Reserved.<br />
34<br />
10<br />
For review purposes only. Not for sale or resale.