The Illinois Report 2013 - Institute of Government & Public Affairs ...
The Illinois Report 2013 - Institute of Government & Public Affairs ...
The Illinois Report 2013 - Institute of Government & Public Affairs ...

Create successful ePaper yourself
Turn your PDF publications into a flip-book with our unique Google optimized e-Paper software.
C H A P T E R 4<br />
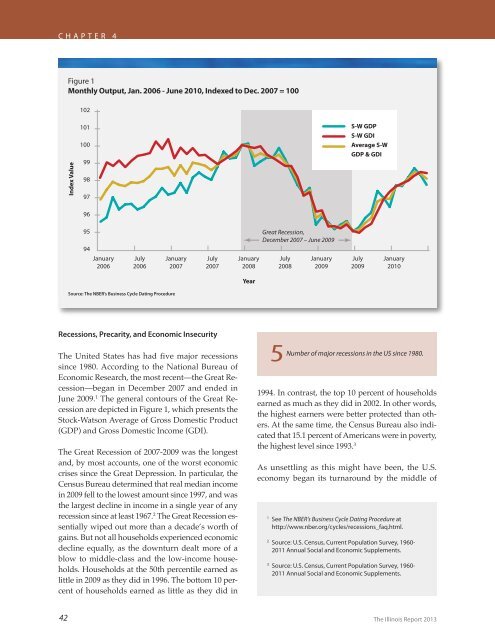
Figure 1<br />
Monthly Output, Jan. 2006 - June 2010, Indexed to Dec. 2007 = 100<br />
102<br />
Index Value<br />
101<br />
100<br />
99<br />
98<br />
97<br />
96<br />
S-W GDP<br />
S-W GDI<br />
Average S-W<br />
GDP & GDI<br />
95<br />
94<br />
January<br />
2006<br />
July<br />
2006<br />
January<br />
2007<br />
July<br />
2007<br />
January<br />
2008<br />
Great Recession,<br />
December 2007 – June 2009<br />
July<br />
2008<br />
January<br />
2009<br />
July<br />
2009<br />
January<br />
2010<br />
Year<br />
Source: <strong>The</strong> NBER’s Business Cycle Dating Procedure<br />
Recessions, Precarity, and Economic Insecurity<br />
<strong>The</strong> United States has had five major recessions<br />
since 1980. According to the National Bureau <strong>of</strong><br />
Economic Research, the most recent—the Great Recession—began<br />
in December 2007 and ended in<br />
June 2009. 1 <strong>The</strong> general contours <strong>of</strong> the Great Recession<br />
are depicted in Figure 1, which presents the<br />
Stock-Watson Average <strong>of</strong> Gross Domestic Product<br />
(GDP) and Gross Domestic Income (GDI).<br />
<strong>The</strong> Great Recession <strong>of</strong> 2007-2009 was the longest<br />
and, by most accounts, one <strong>of</strong> the worst economic<br />
crises since the Great Depression. In particular, the<br />
Census Bureau determined that real median income<br />
in 2009 fell to the lowest amount since 1997, and was<br />
the largest decline in income in a single year <strong>of</strong> any<br />
recession since at least 1967. 2 <strong>The</strong> Great Recession essentially<br />
wiped out more than a decade’s worth <strong>of</strong><br />
gains. But not all households experienced economic<br />
decline equally, as the downturn dealt more <strong>of</strong> a<br />
blow to middle-class and the low-income households.<br />
Households at the 50th percentile earned as<br />
little in 2009 as they did in 1996. <strong>The</strong> bottom 10 percent<br />
<strong>of</strong> households earned as little as they did in<br />
5<br />
Number <strong>of</strong> major recessions in the US since 1980.<br />
1994. In contrast, the top 10 percent <strong>of</strong> households<br />
earned as much as they did in 2002. In other words,<br />
the highest earners were better protected than others.<br />
At the same time, the Census Bureau also indicated<br />
that 15.1 percent <strong>of</strong> Americans were in poverty,<br />
the highest level since 1993. 3<br />
As unsettling as this might have been, the U.S.<br />
economy began its turnaround by the middle <strong>of</strong><br />
1<br />
See <strong>The</strong> NBER’s Business Cycle Dating Procedure at<br />
http://www.nber.org/cycles/recessions_faq.html.<br />
2<br />
Source: U.S. Census, Current Population Survey, 1960-<br />
2011 Annual Social and Economic Supplements.<br />
3<br />
Source: U.S. Census, Current Population Survey, 1960-<br />
2011 Annual Social and Economic Supplements.<br />
42<br />
<strong>The</strong> <strong>Illinois</strong> <strong>Report</strong> <strong>2013</strong>