Buongiorno Spa Interim Report as of March 31, 2009
Buongiorno Spa Interim Report as of March 31, 2009
Buongiorno Spa Interim Report as of March 31, 2009

Create successful ePaper yourself
Turn your PDF publications into a flip-book with our unique Google optimized e-Paper software.
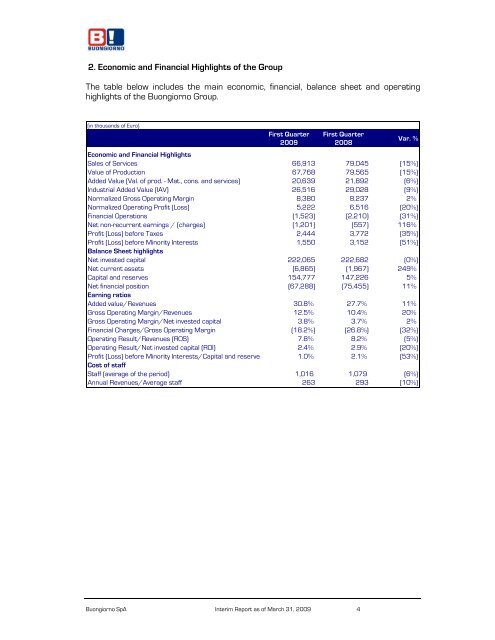
2. Economic and Financial Highlights <strong>of</strong> the Group<br />
The table below includes the main economic, financial, balance sheet and operating<br />
highlights <strong>of</strong> the <strong>Buongiorno</strong> Group.<br />
(in thousands <strong>of</strong> Euro)<br />
First Quarter<br />
<strong>2009</strong><br />
First Quarter<br />
2008<br />
<strong>Buongiorno</strong> SpA <strong>Interim</strong> <strong>Report</strong> <strong>as</strong> <strong>of</strong> <strong>March</strong> <strong>31</strong>, <strong>2009</strong> 4<br />
Var. %<br />
Economic and Financial Highlights<br />
Sales <strong>of</strong> Services 66,913 79,045 (15%)<br />
Value <strong>of</strong> Production 67,768 79,565 (15%)<br />
Added Value (Val. <strong>of</strong> prod. - Mat., cons. and services) 20,639 21,892 (6%)<br />
Industrial Added Value (IAV) 26,516 29,028 (9%)<br />
Normalized Gross Operating Margin 8,380 8,237 2%<br />
Normalized Operating Pr<strong>of</strong>it (Loss) 5,222 6,516 (20%)<br />
Financial Operations (1,523) (2,210) (<strong>31</strong>%)<br />
Net non-recurrent earnings / (charges) (1,201) (557) 116%<br />
Pr<strong>of</strong>it (Loss) before Taxes 2,444 3,772 (35%)<br />
Pr<strong>of</strong>it (Loss) before Minority Interests<br />
Balance Sheet highlights<br />
1,550 3,152 (51%)<br />
Net invested capital 222,065 222,682 (0%)<br />
Net current <strong>as</strong>sets (6,865) (1,967) 249%<br />
Capital and reserves 154,777 147,226 5%<br />
Net financial position<br />
Earning ratios<br />
(67,288) (75,455) 11%<br />
Added value/Revenues 30.8% 27.7% 11%<br />
Gross Operating Margin/Revenues 12.5% 10.4% 20%<br />
Gross Operating Margin/Net invested capital 3.8% 3.7% 2%<br />
Financial Charges/Gross Operating Margin (18.2%) (26.8%) (32%)<br />
Operating Result/Revenues (ROS) 7.8% 8.2% (5%)<br />
Operating Result/Net invested capital (ROI) 2.4% 2.9% (20%)<br />
Pr<strong>of</strong>it (Loss) before Minority Interests/Capital and reserve<br />
Cost <strong>of</strong> staff<br />
1.0% 2.1% (53%)<br />
Staff (average <strong>of</strong> the period) 1,016 1,079<br />
(6%)<br />
Annual Revenues/Average staff 263 293 (10%)