Exposure of Photoresists - MicroChemicals
Exposure of Photoresists - MicroChemicals
Exposure of Photoresists - MicroChemicals

Create successful ePaper yourself
Turn your PDF publications into a flip-book with our unique Google optimized e-Paper software.
<strong>Exposure</strong> <strong>of</strong><br />
<strong>Photoresists</strong><br />
Revised: 2010-01-27<br />
Source: www.microchemicals.eu/technical_information<br />
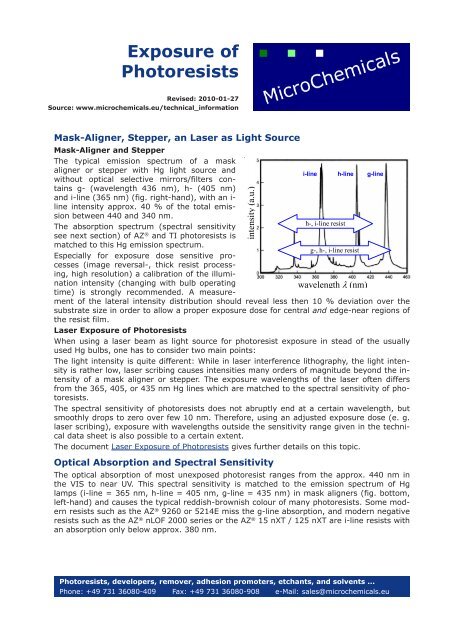
Mask-Aligner, Stepper, an Laser as Light Source<br />
Mask-Aligner and Stepper<br />
The typical emission spectrum <strong>of</strong> a mask<br />
aligner or stepper with Hg light source and<br />
without optical selective mirrors/filters contains<br />
g- (wavelength 436 nm), h- (405 nm)<br />
and i-line (365 nm) (fig. right-hand), with an iline<br />
intensity approx. 40 % <strong>of</strong> the total emission<br />
between 440 and 340 nm.<br />
The absorption spectrum (spectral sensitivity<br />
see next section) <strong>of</strong> AZ ® i-line h-line g-line<br />
h-, i-line resist<br />
and TI photoresists is<br />
matched to this Hg emission spectrum.<br />
g-, h-, i-line resist<br />
Especially for exposure dose sensitive processes<br />
(image reversal-, thick resist processing,<br />
high resolution) a calibration <strong>of</strong> the illumination<br />
intensity (changing with bulb operating<br />
wavelength λ (nm)<br />
time) is strongly recommended. A measurement<br />
<strong>of</strong> the lateral intensity distribution should reveal less then 10 % deviation over the<br />
substrate size in order to allow a proper exposure dose for central and edge-near regions <strong>of</strong><br />
the resist film.<br />
Laser <strong>Exposure</strong> <strong>of</strong> <strong>Photoresists</strong><br />
When using a laser beam as light source for photoresist exposure in stead <strong>of</strong> the usually<br />
used Hg bulbs, one has to consider two main points:<br />
The light intensity is quite different: While in laser interference lithography, the light intensity<br />
is rather low, laser scribing causes intensities many orders <strong>of</strong> magnitude beyond the intensity<br />
<strong>of</strong> a mask aligner or stepper. The exposure wavelengths <strong>of</strong> the laser <strong>of</strong>ten differs<br />
from the 365, 405, or 435 nm Hg lines which are matched to the spectral sensitivity <strong>of</strong> photoresists.<br />
The spectral sensitivity <strong>of</strong> photoresists does not abruptly end at a certain wavelength, but<br />
smoothly drops to zero over few 10 nm. Therefore, using an adjusted exposure dose (e. g.<br />
laser scribing), exposure with wavelengths outside the sensitivity range given in the technical<br />
data sheet is also possible to a certain extent.<br />
The document Laser <strong>Exposure</strong> <strong>of</strong> <strong>Photoresists</strong> gives further details on this topic.<br />
Optical Absorption and Spectral Sensitivity<br />
The optical absorption <strong>of</strong> most unexposed photoresist ranges from the approx. 440 nm in<br />
the VIS to near UV. This spectral sensitivity is matched to the emission spectrum <strong>of</strong> Hg<br />
lamps (i-line = 365 nm, h-line = 405 nm, g-line = 435 nm) in mask aligners (fig. bottom,<br />
left-hand) and causes the typical reddish-brownish colour <strong>of</strong> many photoresists. Some modern<br />
resists such as the AZ ® 9260 or 5214E miss the g-line absorption, and modern negative<br />
resists such as the AZ ® nLOF 2000 series or the AZ ® 15 nXT / 125 nXT are i-line resists with<br />
an absorption only below approx. 380 nm.<br />
<strong>Photoresists</strong>, developers, remover, adhesion promoters, etchants, and solvents ...<br />
Phone: +49 731 36080-409 Fax: +49 731 36080-908 e-Mail: sales@microchemicals.eu<br />
intensity (a.u.)
absorption coeffizient (1/µm) _____<br />
1,8<br />
1,6<br />
1,4<br />
1,2<br />
1<br />
0,8<br />
0,6<br />
0,4<br />
0,2<br />
0<br />
AZ 9260<br />
AZ 4562<br />
AZ 6632<br />
AZ 1518<br />
AZ 1512HS<br />
AZ 701MiR<br />
AZ 5214E<br />
320 370 420 470<br />
wavelength (nm)<br />
<strong>MicroChemicals</strong> GmbH - <strong>Exposure</strong> <strong>of</strong> <strong>Photoresists</strong><br />
<strong>Photoresists</strong>, developers, remover, adhesion promoters, etchants, and solvents ...<br />
Phone: +49 731 36080-409 www.microchemicals.eu e-Mail: sales@microchemicals.eu<br />
-2-<br />
During exposure, positive photoresists almost<br />
completely bleach down to approx.<br />
300 nm (fig. bottom):<br />
<strong>Exposure</strong> <strong>of</strong> “Thick” and “Thin” Resists<br />
In this context, “thick” resist means a film thickness much higher than the penetration<br />
depth <strong>of</strong> the exposure light. For standard positive resists and standard exposure wavelengths<br />
(g-, h-, i-line), this means a thickness <strong>of</strong> > 5 µm, while “thin” resists hold for film<br />
thicknesses < 1 µm which is below the penetration depth <strong>of</strong> typical exposure wavelengths.<br />
One would assume that a very thick resist film cannot be completely exposed towards the<br />
substrate. However, the “trick” is the bleaching <strong>of</strong> the resist: As the plot right-hand shows,<br />
DNQ-based photoresists (= almost all AZ ® positive resists) become UV-transparent during<br />
exposure.<br />
Therefore, in the beginning <strong>of</strong> the exposure, light only penetrates the upper 1-2 µm <strong>of</strong> the<br />
resist film. This part <strong>of</strong> the resist film bleaches, so with the exposure going on, light will be<br />
able to penetrate the first 2-3 µm <strong>of</strong> the film, and so on (see schema below). As a consequence,<br />
the exposed (and developable) resist film thickness goes approx. linear with the exposure<br />
dose. The transition exposed/unexposed is sufficiently sharp for reproducible grey-<br />
unexposed<br />
unexposed<br />
absorption coeff. (1/µm) ____<br />
1<br />
0,8<br />
0,6<br />
0,4<br />
0,2<br />
0<br />
AZ 9260<br />
unexposed<br />
AZ 9260<br />
bleached<br />
290 340 390 440 490<br />
wavelength (nm)<br />
exposed<br />
exposed<br />
While “thin” resist films show a rather homogeneous illumination depth pr<strong>of</strong>ile (top), ‘thick’ resist films<br />
bleach towards the substrate during exposure (bottom).
<strong>MicroChemicals</strong> GmbH - <strong>Exposure</strong> <strong>of</strong> <strong>Photoresists</strong><br />
scale lithography applications (for further information <strong>of</strong> greyscale lithography please consult<br />
the document Greyscale Lithography with <strong>Photoresists</strong>).<br />
On the other hand, a thin resist film is homogeneously exposed from the very beginning <strong>of</strong><br />
exposure. Hereby, the later development rate increases with the exposure dose to a certain<br />
extent.<br />
<strong>Exposure</strong> Dose and <strong>Exposure</strong> Time: Good to Know ...<br />
Concerning the <strong>Exposure</strong> Tool and the Resist Data Sheets<br />
When calculating the correct exposure time from the exposure doses given in the technical<br />
data sheet for each resist, the following has to be considered:<br />
� Is the light source spectrum broadband (g-, h-, and i-line) or monochromatic?<br />
� Measuring the light intensity: Does the sensor only respond to g-, h-, or i-line, or to<br />
broadband intensity? For which spectral range is the illumination intensity given in the<br />
mask aligner manual?<br />
� On which spectral range does the photoresist technical data sheet refer with respect to<br />
the necessary exposure dose, either<br />
a) a certain spectral range (g-, h-, or i-line) when using broadband exposure, or<br />
b) i-line using monochromatic exposure, or<br />
c) the integrated g-, h-, and i-line intensity?<br />
� What is the spectral sensitivity <strong>of</strong> the photoresist?<br />
Light Intensities <strong>of</strong> Typical Mask-Aligners<br />
The commonly used mask-aligners with 350 W Hg bulb typically achieve a light intensity <strong>of</strong><br />
approx. 20-30 mW/cm2 over g-, h-, and i-line, with an i-line fraction <strong>of</strong> 6-12 mW/cm2 . If a<br />
1000 W bulb is used instead, these values can be tripled.<br />
Determining the Optimum <strong>Exposure</strong> Dose<br />
For most positive resist applications, the optimum exposure dose is the one where the development<br />
rate starts to saturate. If the exposure dose is too low, the development time<br />
and thus the dark erosion increase. Too high exposure dose values cause light scattering<br />
and diffraction in the resist film which deteriorates the resolution. In case <strong>of</strong> negative resists,<br />
the optimum exposure dose depends on the required degree <strong>of</strong> cross-linking as well<br />
as the desired resist sidewall pr<strong>of</strong>ile.<br />
If the light intensity <strong>of</strong> a mask-aligner is unknown and no tools to measure this value are<br />
available, a value <strong>of</strong> approx. 20-25 mW/cm2 is a good approximation for a 350 W maskaligner,<br />
and three times more for 1000 W Hg bulbs. If an i-line filter or i-line resists (such as<br />
the AZ ® nLOF 2000 series, or the AZ ® 15 nXT or 125 nXT, details here) are used, the effective<br />
intensities can be divided by a factor <strong>of</strong> three.<br />
Generally, each new process and each process optimization requires an exposure series<br />
where the exposure dose varies between approx. 50% and 200% <strong>of</strong> the estimated optimum<br />
value. In case <strong>of</strong> positive resists, the development rate as a function <strong>of</strong> the exposure dose<br />
shows a saturation from a certain dose on which is a recommended dose most applications.<br />
In case <strong>of</strong> negative resists, the degree <strong>of</strong> cross-linking, and the resist sidewall pr<strong>of</strong>ile determine<br />
the optimum exposure dose.<br />
<strong>Exposure</strong> Series <strong>of</strong> Typical <strong>Photoresists</strong><br />
In order to give you a clue for your own (very recommended!) exposure series, the following<br />
plots show the dependency <strong>of</strong> the exposure time on the development rate for certain<br />
positive resists processed as follows:<br />
Spin coating at 4.000 U/min, s<strong>of</strong>tbake at 100°C contact hotplate for 1 minute for each µm<br />
resist film thickness, development in AZ ® 826 MIF. In all plots, the saturation <strong>of</strong> the development<br />
rate from a certain exposure time is clearly visible.<br />
The exposure tool was a mask aligner with 350 W Hg light source, an i-line intensity <strong>of</strong> 8.5<br />
mW/cm2 , and an integrated g-, h-, and i-line intensity <strong>of</strong> 20 mW/cm2 .<br />
<strong>Photoresists</strong>, developers, remover, adhesion promoters, etchants, and solvents ...<br />
Phone: +49 731 36080-409 www.microchemicals.eu e-Mail: sales@microchemicals.eu<br />
-3-
Development rate (µm/min)<br />
Development rate (µm/min)<br />
16<br />
14<br />
12<br />
10<br />
8<br />
6<br />
4<br />
2<br />
0<br />
16<br />
14<br />
12<br />
10<br />
8<br />
6<br />
4<br />
2<br />
0<br />
AZ ® 1512 HS (1.2 µm)<br />
in AZ ® 826 MIF<br />
0 5 10 15 20 25 30 35 40<br />
<strong>Exposure</strong> time (seconds)<br />
AZ ® 1518 (1.8 µm) in<br />
AZ ® 826 MIF<br />
0 5 10 15 20 25 30 35 40<br />
<strong>Exposure</strong> time (seconds)<br />
The Photo Reaction<br />
Positive and Image Reversal Resists<br />
The photo active compound <strong>of</strong> AZ ® and TI<br />
photoresists belongs to the group <strong>of</strong><br />
diazonaphtho-quinone-sulphonates (DNQ).<br />
Their presence in photoresists reduces the alkaline<br />
solubility by more than one order <strong>of</strong><br />
magnitude (Meyerh<strong>of</strong>er-plot right-hand).<br />
During exposure, the DNQ transforms into a<br />
carboxylic acid, accompanied by the release<br />
<strong>of</strong> nitrogen and the absorption <strong>of</strong> water<br />
(schema overleaf). Thus, the alkaline solubility<br />
increases by several orders <strong>of</strong> magnitude<br />
and is finally more than one order <strong>of</strong> magnitude<br />
higher as compared to pure Novolak.<br />
<strong>MicroChemicals</strong> GmbH - <strong>Exposure</strong> <strong>of</strong> <strong>Photoresists</strong><br />
<strong>Photoresists</strong>, developers, remover, adhesion promoters, etchants, and solvents ...<br />
Phone: +49 731 36080-409 www.microchemicals.eu e-Mail: sales@microchemicals.eu<br />
-4-<br />
Development rate (µm/min)<br />
Development rate (µm/min)<br />
Development rate (µm/min)<br />
20<br />
18<br />
16<br />
14<br />
12<br />
10<br />
8<br />
6<br />
4<br />
2<br />
0<br />
0 5 10 15 20 25 30 35 40<br />
<strong>Exposure</strong> time (seconds)<br />
3,0<br />
2,5<br />
2,0<br />
1,5<br />
1,0<br />
0,5<br />
0,0<br />
0 5 10 15 20 25 30 35 40<br />
<strong>Exposure</strong> time (seconds)<br />
3,5<br />
3,0<br />
2,5<br />
2,0<br />
1,5<br />
1,0<br />
0,5<br />
0,0<br />
dissolution rate (nm/s)<br />
AZ ® 6612 (1.2 µm) in<br />
AZ ® 826 MIF<br />
AZ ® 4533 (3.3 µm) in<br />
AZ ® 826 MIF<br />
AZ ® 4562 (6.2 µm) in<br />
AZ ® 826 MIF<br />
0 5 10 15 20 25 30 35 40<br />
<strong>Exposure</strong> time (seconds)<br />
1000<br />
100<br />
10<br />
1<br />
exposed<br />
unexposed<br />
typical<br />
loadings<br />
0.1<br />
0 5 10 15 20 25 30<br />
DNQ-sulfonate concentration (%)
O N<br />
C<br />
H<br />
S<br />
<strong>MicroChemicals</strong> GmbH - <strong>Exposure</strong> <strong>of</strong> <strong>Photoresists</strong><br />
In order to improve the DNQ solubility in the resist and to increase the inhibitor property<br />
(dark erosion reduction), generally several DNQ-sulfonate molecules are bonded to a socalled<br />
backbone-molecule.<br />
The photoreaction quantum efficiency defines the number <strong>of</strong> above-mentioned reactions in<br />
relation to the photons absorbed in the resist film. Using a sufficiently transparent resin, a<br />
suited photon energy (g-, h-, i-line with respect to the specific DNQ) and a sufficient H 2 Oconcentration<br />
in the resist, the quantum efficiency in DNQ-based positive-tone photoresists<br />
achieves values <strong>of</strong> typically 20-30 %.<br />
If the resist lacks a minimum concentration <strong>of</strong> water, the ketone (scheme above, center)<br />
may perform various side reactions (e. g. esterify with the resin or polymerize accompanied<br />
by CO 2 -separation). In both cases, the development rate solely increases by the reduction<br />
<strong>of</strong> the inhibitor (DNQ-sulfonate) concentration. As a consequence, the total dark erosion increases<br />
due to the longer development time required. Thus, steep resist sidewalls as well as<br />
very high resolutions or aspect ratios can not be realized. For details on this topic, please<br />
consult the document Rehydration <strong>of</strong> <strong>Photoresists</strong>.<br />
Negative (Cross-Linking) Resists<br />
Negative resists such as the AZ ® nLOF 2000 series, or the AZ ® 15 nXT and 125 nXT (details<br />
here) contain a crosslinker which is activated during exposure and thermally activated<br />
crosslinks the resin during a subsequent baking step. Higher exposure doses increase the<br />
degree <strong>of</strong> cross-linking, which improves the thermal and chemical stability, and makes an<br />
impact on the attained resist pr<strong>of</strong>ile after development.<br />
The Contrast <strong>of</strong> <strong>Photoresists</strong><br />
The contrast <strong>of</strong> a photoresist defines the development rate as a function <strong>of</strong> the absorbed<br />
light dose. <strong>Photoresists</strong> with a high contrast show minor dark erosion and develop from a<br />
certain dose D on at a constant rate, while resist parts exposed with D < D (e. g. diffrac-<br />
0 0<br />
tion patterns) remain on the substrate.<br />
The contrast curve <strong>of</strong> a photoresist (plot below) plots the remaining resist film thickness after<br />
development (in relation to the thickness before development) d'/d as a function <strong>of</strong> the<br />
0<br />
(logarithmically plotted) exposure dose.<br />
The transfer <strong>of</strong> information from a given<br />
contrast curve to an individual lithographic<br />
process requires information <strong>of</strong> all process<br />
parameters which impact on the development<br />
rate, such as resist thickness, s<strong>of</strong>tbake,<br />
rehydration, air temperature and -<br />
humidity, developer etc.<br />
The contrast curve <strong>of</strong> an ideal positive resist<br />
is a step function (contrast = infinity).<br />
Realistic contrast curves show a d'/d < 1 0<br />
for an exposure dose = 0 (dark erosion)<br />
and a non-infinitesimal logarithmic decay<br />
in d'/d � 0 over a nonzero range <strong>of</strong> the<br />
0<br />
dose towards D (‘dose to clear’). The<br />
C<br />
slope <strong>of</strong> this decay defines the contrast.<br />
<strong>Photoresists</strong>, developers, remover, adhesion promoters, etchants, and solvents ...<br />
Phone: +49 731 36080-409 www.microchemicals.eu e-Mail: sales@microchemicals.eu<br />
-5-<br />
N 2<br />
H 2 O
<strong>MicroChemicals</strong> GmbH - <strong>Exposure</strong> <strong>of</strong> <strong>Photoresists</strong><br />
<strong>Exposure</strong>-Related Resolution Limits<br />
The Photomask<br />
At low exposure doses, the contrast <strong>of</strong> photoresists reduces the impact <strong>of</strong> defects in the<br />
mask (holes in the Cr film) to a certain extent. Towards higher exposure doses, however,<br />
the contrast curve enhances irregularities in the mask as well as interference patterns in the<br />
resist. As a consequence, positive resists reveal regions <strong>of</strong> high dark erosion (mouse-bites,<br />
holes, thinning). The contrast enhancement in image reversal resist processing furthermore<br />
promotes a resist pattern strongly revealing spatial exposure intensity irregularities.<br />
The exposure wavelength<br />
The exposure wavelength limits the theoretical resolution<br />
limit: Small transparent features in the photomask act as<br />
slits causing an interference pattern on/in the resist film,<br />
which later transfers into the resist features after development.<br />
As the figure right-hand shows, such a distribution <strong>of</strong> the<br />
light intensity differs from an ideal, sharply bounded rectangular<br />
distribution. Since the dimensions <strong>of</strong> the diffraction<br />
pattern increases with the exposure wavelength,<br />
smaller wavelengths improve the (theoretical) attainable<br />
resolution.<br />
However, two points have to be considered in this context: The theoretical resolution limits<br />
only goes with the square root <strong>of</strong> the wavelengths, so the difference between g-line (435<br />
nm), and i-line (365 nm), is less than 10 % resolution gain. Using smaller wavelength than<br />
i-line for g-/h-/i-line resists is not recommended, since the absorption <strong>of</strong> these resists is not<br />
matched to wavelengths < 340 nm where the resist absorption strongly increases. Therefore,<br />
comparable high exposure doses are required to through-expose a given resist film<br />
which also increases the intensity <strong>of</strong> scattered and diffracted light thus deteriorating the<br />
resolution.<br />
A Gap between Photomask and Resist<br />
A Gap between Photomask and resist surface extends the diffraction pattern and therefore<br />
deteriorates the resolution.<br />
Possible (unintended) reasons for a gap > 0 are:<br />
� Particles in the resist caused by either<br />
insufficient cleanroom conditions, contaminated<br />
substrates, or expired photoresist,<br />
� bubbles in the resist film caused during<br />
dispensing, or an insufficient delay time<br />
after refilling/diluting/moving the resist,<br />
� mask contamination by particles, or re-<br />
sist from previous exposure steps,<br />
� rough, textured, or curved (strained)<br />
substrates,<br />
� an edge bead, or a mask attached upside-down<br />
☺.<br />
The <strong>Exposure</strong> Dose<br />
An optimized exposure dose is another requirement for attaining the maximum resolution <strong>of</strong><br />
a given resist: If the exposure dose is too low, the development time <strong>of</strong> positive resists increases<br />
which increases the total dark erosion, while negative resists show an increased<br />
erosion <strong>of</strong> the exposed areas due too a weak cross-linking.<br />
Too high exposure doses cause an undesired exposure by scattering, diffraction and reflection<br />
<strong>of</strong> the part <strong>of</strong> the resist which should not be exposed. As a consequence, too much (in<br />
case <strong>of</strong> positive resists) or too less (in case <strong>of</strong> negative resists) <strong>of</strong> the resist is cleared dur-<br />
<strong>Photoresists</strong>, developers, remover, adhesion promoters, etchants, and solvents ...<br />
Phone: +49 731 36080-409 www.microchemicals.eu e-Mail: sales@microchemicals.eu<br />
-6-<br />
Cross-section <strong>of</strong> the modelled iline<br />
(365 nm) exposure intensity<br />
distribution in a 1 µm thick resist<br />
film and a 1 µm slit in the photomask.<br />
Cross-section <strong>of</strong> the modelled i-line (365 nm) exposure<br />
intensity distribution in a 2 µm thick resist<br />
film and a 2 µm slit in the photomask with no (top)<br />
and 10 µm (bottom) proximity gap.
<strong>MicroChemicals</strong> GmbH - <strong>Exposure</strong> <strong>of</strong> <strong>Photoresists</strong><br />
ing development.<br />
The section “Determining the Optimum <strong>Exposure</strong> Dose” in this document explains how the<br />
find the optimum value for the exposure dose.<br />
Optical Substrate Properties<br />
Highly UV-reflecting (e. g. metallized) substrates increase<br />
the absorbed light dose in the resist near the substrate, and<br />
thereby reduce the exposure time necessary for through-development.<br />
UV-transmissive substrates (e. g. quartz, glass,<br />
thick SiO 2 on Si, transparent polymers) laterally guide light<br />
along the substrate (fig. left-hand), cause reflections from<br />
the chuck and reduce the lateral resolution (in the latter<br />
case, UV-absorbing films or foils between resist/substrate<br />
and substrate/chuck, respectively, will help).<br />
In both cases (UV-reflecting or/and -transparent substrates),<br />
the usage <strong>of</strong> image reversal resists in image rever-<br />
sal mode will help, since hereby the first exposure does not penetrate the entire resist film,<br />
therefore the sensitivity to the optical behavior <strong>of</strong> the substrate is minimized.<br />
Further Resolution Limits<br />
The document High Resolution Photoresist Processing gives details on further resolution limits<br />
<strong>of</strong> photoresists.<br />
Disclaimer <strong>of</strong> Warranty<br />
All information, process guides, recipes etc. given in this brochure have been added to the<br />
best <strong>of</strong> our knowledge. However, we cannot issue any guarantee concerning the accuracy <strong>of</strong><br />
the information.<br />
We assume no liability for any hazard for staff and equipment which might stem from the<br />
information given in this brochure.<br />
Generally speaking, it is in the responsibility <strong>of</strong> every staff member to inform herself/himself<br />
about the processes to be performed in the appropriate (technical) literature, in order to<br />
minimize any risk to man or machine.<br />
AZ and the AZ logo are registered trademarks <strong>of</strong> AZ Electronic Materials (Germany) GmbH.<br />
<strong>Photoresists</strong>, developers, remover, adhesion promoters, etchants, and solvents ...<br />
Phone: +49 731 36080-409 www.microchemicals.eu e-Mail: sales@microchemicals.eu<br />
-7-<br />
Mask<br />
Unexposed<br />
resist<br />
Exposed<br />
resist<br />
Substrate with transparent<br />
coating