Economics Economic Indicators - Income and Poverty
Economics Economic Indicators - Income and Poverty
Economics Economic Indicators - Income and Poverty

Create successful ePaper yourself
Turn your PDF publications into a flip-book with our unique Google optimized e-Paper software.
E c o n o m i c I n d i c a t o r s - E c o n o m i c V i t a l i t y I n d e x<br />
<strong>Economic</strong> Indicator Index | Life in Hamilton County - Table of Contents | Home<br />
Percentage Net Job Growth<br />
Per Capita Retail Sales<br />
Total Retail Sales<br />
New Privately-Owned Housing Units<br />
Eco n o m i c I n d i c a t o r s - E c o n o m i c V i t a l i t y<br />
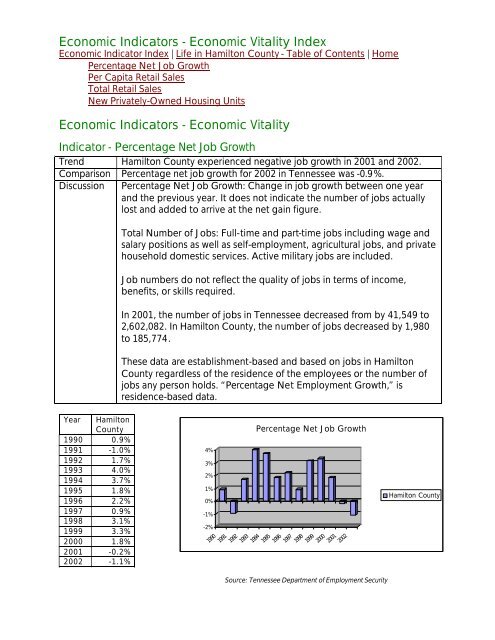
Indicator - Percentage Net Job Growth<br />
Trend Hamilton County experienced negative job growth in 2001 <strong>and</strong> 2002.<br />
Comparison Percentage net job growth for 2002 in Tennessee was -0.9%.<br />
Discussion Percentage Net Job Growth: Change in job growth between one year<br />
<strong>and</strong> the previous year. It does not indicate the number of jobs actually<br />
lost <strong>and</strong> added to arrive at the net gain figure.<br />
Total Number of Jobs: Full-time <strong>and</strong> part-time jobs including wage <strong>and</strong><br />
salary positions as well as self-employment, agricultural jobs, <strong>and</strong> private<br />
household domestic services. Active military jobs are included.<br />
Job numbers do not reflect the quality of jobs in terms of income,<br />
benefits, or skills required.<br />
In 2001, the number of jobs in Tennessee decreased from by 41,549 to<br />
2,602,082. In Hamilton County, the number of jobs decreased by 1,980<br />
to 185,774.<br />
These data are establishment-based <strong>and</strong> based on jobs in Hamilton<br />
County regardless of the residence of the employees or the number of<br />
jobs any person holds. ‘‘Percentage Net Employment Growth,’’ is<br />
residence-based data.<br />
Year Hamilton<br />
County<br />
1990 0.9%<br />
1991 -1.0%<br />
1992 1.7%<br />
1993 4.0%<br />
1994 3.7%<br />
1995 1.8%<br />
1996 2.2%<br />
1997 0.9%<br />
1998 3.1%<br />
1999 3.3%<br />
2000 1.8%<br />
2001 -0.2%<br />
2002 -1.1%<br />
4%<br />
3%<br />
2%<br />
1%<br />
0%<br />
-1%<br />
-2%<br />
1990<br />
1991<br />
1992<br />
1993<br />
1994<br />
1995<br />
Percentage Net Job Growth<br />
1996<br />
1997<br />
1998<br />
1999<br />
2000<br />
2001<br />
2002<br />
Source: Tennessee Department of Employment Security<br />
Hamilton County