Economics Economic Indicators - Income and Poverty
Economics Economic Indicators - Income and Poverty
Economics Economic Indicators - Income and Poverty

You also want an ePaper? Increase the reach of your titles
YUMPU automatically turns print PDFs into web optimized ePapers that Google loves.
<strong><strong>Economic</strong>s</strong><br />
Life in Hamilton County - Table of Contents | Home<br />
<strong>Income</strong> <strong>and</strong> <strong>Poverty</strong><br />
Employment<br />
<strong>Economic</strong> Vitality<br />
E c o n o m i c I n d i c a t o r s - Inc o m e a n d P o v e r t y<br />
<strong>Economic</strong> Indicator Index | Life in Hamilton County - Table of Contents | Home<br />
Per Capita Personal <strong>Income</strong><br />
Average Monthly Over-the-Counter Food Stamp Issuances<br />
Percentage of Public School Students Receiving Free/Reduced Lunches<br />
Average Monthly Count of WIC Recipients<br />
Occupied Public Housing Units in Chattanooga<br />
Unduplicated Annual Count of Homeless Receiving Services As Reported in<br />
Service Point Database<br />
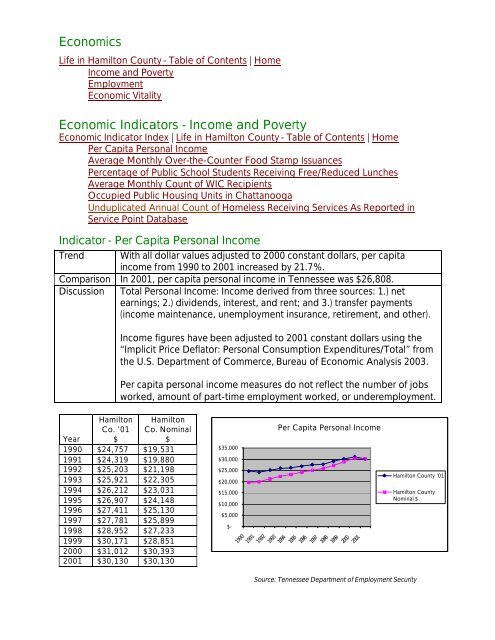
Indicator - Per Capita Personal <strong>Income</strong><br />
Trend With all dollar values adjusted to 2000 constant dollars, per capita<br />
income from 1990 to 2001 increased by 21.7%.<br />
Comparison In 2001, per capita personal income in Tennessee was $26,808.<br />
Discussion Total Personal <strong>Income</strong>: <strong>Income</strong> derived from three sources: 1.) net<br />
earnings; 2.) dividends, interest, <strong>and</strong> rent; <strong>and</strong> 3.) transfer payments<br />
(income maintenance, unemployment insurance, retirement, <strong>and</strong> other).<br />
<strong>Income</strong> figures have been adjusted to 2001 constant dollars using the<br />
‘‘Implicit Price Deflator: Personal Consumption Expenditures/Total’’ from<br />
the U.S. Department of Commerce, Bureau of <strong>Economic</strong> Analysis 2003.<br />
Per capita personal income measures do not reflect the number of jobs<br />
worked, amount of part-time employment worked, or underemployment.<br />
Hamilton<br />
Co. ’01<br />
$<br />
Hamilton<br />
Co. Nominal<br />
$<br />
Year<br />
1990 $24,757 $19,531<br />
1991 $24,319 $19,880<br />
1992 $25,203 $21,198<br />
1993 $25,921 $22,305<br />
1994 $26,212 $23,031<br />
1995 $26,907 $24,148<br />
1996 $27,411 $25,130<br />
1997 $27,781 $25,899<br />
1998 $28,952 $27,233<br />
1999 $30,171 $28,851<br />
2000 $31,012 $30,393<br />
2001 $30,130 $30,130<br />
$35,000<br />
$30,000<br />
$25,000<br />
$20,000<br />
$15,000<br />
$10,000<br />
$5,000<br />
$-<br />
Per Capita Personal <strong>Income</strong><br />
1990<br />
1991<br />
1992<br />
1993<br />
1994<br />
1995<br />
1996<br />
1997<br />
1998<br />
1999<br />
2000<br />
2001<br />
Hamilton County ’01<br />
Hamilton County<br />
Nominal $<br />
Source: Tennessee Department of Employment Security
Indicator - Average Monthly Food Stamp Issuances (Electronics Benefits<br />
Transfer – EBT)<br />
Trend<br />
Since its nine-year low in 1998-99, the average monthly over-the-counter<br />
food stamp issuances have more than doubled. In 2002-03, the average<br />
monthly household participation for Hamilton County food stamps was<br />
16,455, <strong>and</strong> the total program benefit amount was $36,341,153.<br />
Recent increases in over-the-counter food stamp issuances are likely the<br />
result of Tennessee’s welfare reform program, known as Families First. In<br />
Families First, clients who move off welfare receive child-care assistance<br />
<strong>and</strong> TennCare benefits for 18 months while they transition into the work<br />
force. This temporary assistance enables them to move off food stamps.<br />
However, once eligibility for TennCare <strong>and</strong> child care assistance expires,<br />
the resulting new expenses often reduce family income down to food<br />
stamp eligibility levels.<br />
Comparison In 2001-02, the average monthly household participation for Tennessee<br />
food stamps was 255,900, <strong>and</strong> the total program benefit amount was<br />
$551,508,090.<br />
Discussion To receive food stamps, a household must meet nationwide income<br />
eligibility st<strong>and</strong>ards. In 2002-03 for a family of three to be eligible for<br />
food stamps, its gross monthly income could not exceed $1,628. The<br />
U.S. Department of Health <strong>and</strong> Human Services federal poverty<br />
guideline for a family of three in 2002 was $15,260 per year or $1,272<br />
per month.<br />
As of March 2004, a family of three with no income received $371 worth<br />
of food stamps monthly. Families with some income received less.<br />
In February 1999, the Food Stamp Program changed to an Electronic<br />
Benefits Transaction (EBT) system. Paper food coupons were<br />
discontinued.<br />
According to the 2000 Census, 12.1% of the population in Hamilton<br />
County lived in poverty.
Hamilton<br />
County<br />
Year Households<br />
1990-91 9,701<br />
1991-92 10,828<br />
1992-93 12,924<br />
1993-94 14,059<br />
1994-95 13,179<br />
1995-96 16,771<br />
1996-97 10,384<br />
1997-98 8,582<br />
1998-99 7,193<br />
1999-00 11,104<br />
2000-01 11,848<br />
2001-02 12,947<br />
2002-03 15,602<br />
18,000<br />
16,000<br />
14,000<br />
12,000<br />
10,000<br />
8,000<br />
6,000<br />
4,000<br />
2,000<br />
0<br />
1990-91<br />
1991-92<br />
1992-93<br />
Average Monthly Food Stamp Issuances<br />
1993-94<br />
1994-95<br />
1995-96<br />
1996-97<br />
1997-98<br />
1998-99<br />
1999-00<br />
2000-01<br />
2001-02<br />
2002-03<br />
Hamilton County<br />
Households<br />
Source: Tennessee Department of Human Services, USDA
Indicator –Percentage of Public School Students Receiving Free/Reduced<br />
Lunch<br />
Trend<br />
In 1997-98, Hamilton County <strong>and</strong> Chattanooga merged two school<br />
systems into one. Since the 1997-98 school year, the percentage of<br />
students receiving free or reduced school lunch increased by 5.7<br />
percentage points.<br />
Comparison In 2002-03, the percentage for Tennessee was 42.4%.<br />
Discussion<br />
Student eligibility for free or reduced-price meals is determined by<br />
family size <strong>and</strong> income as declared by parents. In 2002-03, the<br />
Tennessee Department of Education began referring to this measure on<br />
the state Report Card as ‘‘economically disadvantaged’’ students.<br />
All public schools participate in the School Lunch Program.<br />
Because students who may be eligible for free or reduced-price meals<br />
may choose not to apply or participate, the number of participants may<br />
not represent total eligible students.<br />
Year<br />
Ham.<br />
County<br />
Chatt.<br />
City<br />
1990-91 19.0% 51.1%<br />
1991-92 16.0% 54.4%<br />
1992-93 17.0% 58.4%<br />
1993-94 19.0% 61.1%<br />
1994-95 20.4% 56.7%<br />
1995-96 19.1% 53.9%<br />
1996-97 19.5% 58.2%<br />
1997-98 36.9%<br />
1998-99 41.8%<br />
1999-00 41.6%<br />
2000-01 46.7%<br />
2001-02 46.0%<br />
2002-03 42.6%<br />
70%<br />
60%<br />
50%<br />
40%<br />
30%<br />
20%<br />
10%<br />
0%<br />
1990-91<br />
1991-92<br />
1992-93<br />
Percentage of Public School Students Receiving<br />
Free or Reduced Lunch<br />
1993-94<br />
1994-95<br />
1995-96<br />
1996-97<br />
1997-98<br />
1998-99<br />
1999-00<br />
2000-01<br />
2001-02<br />
2002-03<br />
Source: Tennessee Department of Education<br />
Hamilton County<br />
Chattanooga
Indicator - Average Monthly Count of WIC Recipients<br />
Trend In the last fourteen years, the number of women on the WIC program in<br />
Hamilton County has increased by 71.9%. The number of children on the<br />
program has risen by 22.4% in the same period.<br />
Comparison In 2003, the state had a monthly average of 39,611 women <strong>and</strong> 112,872<br />
children in the WIC program.<br />
Discussion WIC: Women, Infants, <strong>and</strong> Children.<br />
The WIC program provides food assistance <strong>and</strong> nutritional screening to<br />
low-income pregnant <strong>and</strong> postpartum women <strong>and</strong> their infants, as well<br />
as to low-income children up to age 5. Participants in the program must<br />
have incomes at or below 185% of poverty <strong>and</strong> must be nutritionally at<br />
risk. As of March 2004, a family of three with a household income of<br />
$28,231 or less would qualify for the WIC program. Nutritional risk is<br />
defined as detectable abnormal nutritional conditions, documented<br />
nutritionally-related medical conditions, health impairing dietary<br />
deficiencies, or conditions that predispose people to inadequate<br />
nutrition or nutritionally related medical problems.<br />
Food available through the WIC program includes those high in iron,<br />
vitamin A, <strong>and</strong> Vitamin C such as milk, cheese, peanut butter, fruit juices,<br />
tuna, cereals, dried beans, carrots, <strong>and</strong> certain baby formulas.<br />
While the percentage of children on WIC has increased at a lower rate<br />
than the percentage of women on WIC, the total number of children on<br />
WIC is greater than that of women.<br />
Year Women Children<br />
1990 1,049 4,549<br />
1991 1,351 5,226<br />
1992 1,325 4,971<br />
1993 1,619 5,551<br />
1994 1,674 5,705<br />
1995 1,618 5,485<br />
1996 1,642 5,528<br />
1997 1,598 5,502<br />
1998 NA NA<br />
1999 NA NA<br />
2000 1,531 5,033<br />
2001 1,817 5,276<br />
2002 1,822 5,481<br />
2003 1,803 5,568<br />
8,000<br />
7,000<br />
6,000<br />
5,000<br />
4,000<br />
3,000<br />
2,000<br />
1,000<br />
0<br />
1990<br />
Average Monthly Count of WIC Recipients<br />
Source: Chattanooga-Hamilton County Health Department<br />
1991<br />
1992<br />
1993<br />
1994<br />
1995<br />
1996<br />
1997<br />
1998<br />
1999<br />
2000<br />
2001<br />
2002<br />
2003<br />
Children<br />
Women
Indicator - Occupied Public Housing Units in Chattanooga<br />
Trend The decline in occupied public housing is generally due to the reduction<br />
in the number of available units while the McCallie Homes site is<br />
redeveloped.<br />
Comparison McCallie Homes, originally a 578 unit family complex, has relocated its<br />
residents out of the development. The development has been<br />
demolished, <strong>and</strong> a new mixed income development will be built on the<br />
site. The new development is part of a $35 million grant awarded in July<br />
2000 to the city by the U.S. Department of Housing <strong>and</strong> Urban<br />
Development (HUD). In addition, Poss Homes (188 units) <strong>and</strong> Reverend<br />
H.J. Johnson (31 units) have been approved by HUD to be demolished<br />
due to structural problems.<br />
Discussion Public housing includes both permanent <strong>and</strong> transitional types of<br />
housing. It is available on a sliding rental scale with a minimum<br />
requirement of $25 per unit.<br />
Housing is available only to families with household income that is 30%<br />
or less of the median income for the Chattanooga area. Preferences are<br />
given to families in the following order: 1) Displaced person (displaced<br />
by government, natural disaster, domestic violence, <strong>and</strong> hate crimes); 2)<br />
Those whose current rent is more than 50% of gross monthly income; 3)<br />
Working families, or elderly or disabled; 4) St<strong>and</strong>ard applicants.<br />
Currently, Chattanooga has 9 developments <strong>and</strong> 8 scattered sites.<br />
Year Chattanooga<br />
1990 3,077<br />
1991 3,501<br />
1992 3,008<br />
1993 3,151<br />
1994 3,128<br />
1995 3,382<br />
1996 3,417<br />
1997 3,414<br />
1998 3,363<br />
1999 3,421<br />
2000 3,163<br />
2001 3,035<br />
2002 2,830<br />
2003 2,696<br />
4,000<br />
3,500<br />
3,000<br />
2,500<br />
2,000<br />
1,500<br />
1,000<br />
500<br />
0<br />
Occupied Public Housing Units in Chattanooga<br />
1990 1991 1992 1993 1994 1995 1996 1997 1998 1999 2000 2001 2002 2003<br />
Source: Chattanooga Housing Authority
Indicator – Unduplicated Count of Homeless Receiving Services As<br />
Reported in Service Point Database<br />
Trend<br />
In 2003, 3,077 different homeless individuals received services from nonprofit,<br />
faith-based, <strong>and</strong> government agencies <strong>and</strong> organizations<br />
reporting to the Service Point database.<br />
Comparison None available<br />
Discussion<br />
While the Chattanooga Regional Homeless coalition has operated the<br />
Service Point homeless management information system since 2000, the<br />
system was still in the developmental stages, <strong>and</strong> data from previous<br />
years are not comparable. The Service Point Homeless Management<br />
Information in an integrated database system that collects information<br />
from a majority of Hamilton County’s nonprofit, government, <strong>and</strong> faithbased<br />
service providers serving homeless people. At this time, Service<br />
Point does not collect data from youth shelters, some domestic violence<br />
shelters, <strong>and</strong> four relatively large faith-based shelters. It is anticipated<br />
that additional providers will join the Service Point system in 2004.<br />
Year Hamilton<br />
County<br />
2003 3,077<br />
Count of Homeless People Receiving Services<br />
From Agencies Reporting to the Service Point<br />
Database<br />
4,000<br />
3,000<br />
2,000<br />
1,000<br />
0<br />
2003<br />
Source: The Chattanooga Homeless Coalition
E c o n o m i c I n d i c a t o r s - E m p l o y m e n t<br />
<strong>Economic</strong> Indicator Index | Life in Hamilton County - Table of Contents | Home<br />
Percentage Net Employment Growth<br />
Percentage Unemployment<br />
Indicator - Percentage Net Employment Growth<br />
Trend In the last 14 years, net employment growth has fluctuated from -1.8%<br />
to 3.7%.<br />
Comparison From 2001 to 2002, employment in Tennessee increased 43,000 to<br />
2,776,400. In Hamilton County, employment in 2002 was 151,950, an<br />
Discussion<br />
increase of 1,660 over 2001.<br />
Net Employment Growth: Difference between a year’s total employment<br />
<strong>and</strong> the previous year’s total.<br />
Total Employment: Annual average of the number of persons who reside<br />
in a jurisdiction <strong>and</strong> are employed full-time or part-time.<br />
Counted as employed are those workers involved in labor management<br />
disputes. Adjustments have been made for multiple job holding. Jobs<br />
performed on an informal basis <strong>and</strong> not reported to any government<br />
agency are not included.<br />
The data are residence-based. The employment status of persons who<br />
live in Hamilton County regardless of where they work. ‘‘Percentage Net<br />
Job Growth’’ is establishment-based data.<br />
Ham.<br />
Year County<br />
1990 -1.8%<br />
1991 -0.6%<br />
1992 0.0%<br />
1993 2.6%<br />
1994 4.3%<br />
1995 -1.2%<br />
1996 1.4%<br />
1997 -3.6%<br />
1998 1.5%<br />
1999 3.7%<br />
2000 3.2%<br />
2001 1.0%<br />
2002 1.1%<br />
5%<br />
4%<br />
3%<br />
2%<br />
1%<br />
0%<br />
-1%<br />
-2%<br />
-3%<br />
-4%<br />
Percentage Net Employment Growth<br />
1990<br />
1991<br />
1992<br />
1993<br />
1994<br />
1995<br />
Hamilton County<br />
1996<br />
1997<br />
1998<br />
1999<br />
2000<br />
2001<br />
2002<br />
Source: Tennessee Department of Employment Security
Indicator - Percentage Unemployment<br />
Trend The unemployment rate for Hamilton County increased 1.3 percentage<br />
points since 2000, but at 4.1% still may be considered full employment<br />
(see below). Hamilton County has hovered at full employment for the<br />
last fourteen years.<br />
Comparison In 2003, statewide unemployment was 5.8% <strong>and</strong> nationwide<br />
unemployment was 6.0%.<br />
Discussion Unemployment numbers only include those persons who are actively<br />
seeking employment. People who have stopped looking for work are not<br />
included.<br />
Unemployment rates do not take into account persons who are<br />
underemployed working at jobs below their skill <strong>and</strong> experience levels or<br />
working part-time when they desire to work full-time.<br />
Any unemployment rate between 4% <strong>and</strong> 6% is generally considered to<br />
reflect full employment. Fluctuations within this level are considered<br />
normal. With these parameters, Hamilton County has experienced full<br />
employment for the last twelve years.<br />
Year County<br />
1990 4.2%<br />
1991 6.0%<br />
1992 5.5%<br />
1993 4.8%<br />
1994 4.2%<br />
1995 4.6%<br />
1996 4.3%<br />
1997 4.9%<br />
1998 3.7%<br />
1999 3.3%<br />
2000 2.8%<br />
2001 3.1%<br />
2002 3.8%<br />
2003 4.1%<br />
7%<br />
6%<br />
5%<br />
4%<br />
3%<br />
2%<br />
1%<br />
0%<br />
1990<br />
1991<br />
1992<br />
1993<br />
Percentage Unemployment<br />
1994<br />
1995<br />
1996<br />
1997<br />
1998<br />
1999<br />
Hamilton County<br />
2000<br />
2001<br />
2002<br />
2003<br />
Source: Tennessee Department of Employment Security
E c o n o m i c I n d i c a t o r s - E c o n o m i c V i t a l i t y I n d e x<br />
<strong>Economic</strong> Indicator Index | Life in Hamilton County - Table of Contents | Home<br />
Percentage Net Job Growth<br />
Per Capita Retail Sales<br />
Total Retail Sales<br />
New Privately-Owned Housing Units<br />
Eco n o m i c I n d i c a t o r s - E c o n o m i c V i t a l i t y<br />
Indicator - Percentage Net Job Growth<br />
Trend Hamilton County experienced negative job growth in 2001 <strong>and</strong> 2002.<br />
Comparison Percentage net job growth for 2002 in Tennessee was -0.9%.<br />
Discussion Percentage Net Job Growth: Change in job growth between one year<br />
<strong>and</strong> the previous year. It does not indicate the number of jobs actually<br />
lost <strong>and</strong> added to arrive at the net gain figure.<br />
Total Number of Jobs: Full-time <strong>and</strong> part-time jobs including wage <strong>and</strong><br />
salary positions as well as self-employment, agricultural jobs, <strong>and</strong> private<br />
household domestic services. Active military jobs are included.<br />
Job numbers do not reflect the quality of jobs in terms of income,<br />
benefits, or skills required.<br />
In 2001, the number of jobs in Tennessee decreased from by 41,549 to<br />
2,602,082. In Hamilton County, the number of jobs decreased by 1,980<br />
to 185,774.<br />
These data are establishment-based <strong>and</strong> based on jobs in Hamilton<br />
County regardless of the residence of the employees or the number of<br />
jobs any person holds. ‘‘Percentage Net Employment Growth,’’ is<br />
residence-based data.<br />
Year Hamilton<br />
County<br />
1990 0.9%<br />
1991 -1.0%<br />
1992 1.7%<br />
1993 4.0%<br />
1994 3.7%<br />
1995 1.8%<br />
1996 2.2%<br />
1997 0.9%<br />
1998 3.1%<br />
1999 3.3%<br />
2000 1.8%<br />
2001 -0.2%<br />
2002 -1.1%<br />
4%<br />
3%<br />
2%<br />
1%<br />
0%<br />
-1%<br />
-2%<br />
1990<br />
1991<br />
1992<br />
1993<br />
1994<br />
1995<br />
Percentage Net Job Growth<br />
1996<br />
1997<br />
1998<br />
1999<br />
2000<br />
2001<br />
2002<br />
Source: Tennessee Department of Employment Security<br />
Hamilton County
Indicator - Per Capita Retail Sales<br />
Trend From 1990 to 2002, per capita retail sales increased by 51.3%.<br />
Comparison Per capita retail sales in Tennessee were $13,449 for 2002. In 2002<br />
Discussion<br />
dollars, this represents a 1.2% increase over 2001.<br />
Retail Sales: Estimated net sales for all establishments primarily engaged<br />
in retail trade excluding those of wholesale <strong>and</strong> service establishments.<br />
The total retail sales figures used to calculate this variable are as<br />
reported in Sales <strong>and</strong> Marketing Management’s annual Survey of Buying<br />
Power. Population figures are as reported by the U.S. Census.<br />
Sales figures are establishment-based <strong>and</strong> include purchases by persons<br />
living outside of Hamilton County. Figures have been adjusted to 2002<br />
constant dollars using the ‘‘Implicit Price Deflator: Personal Consumption<br />
Expenditures/Total.’’<br />
Ham.<br />
County<br />
2002<br />
$<br />
Ham.<br />
County<br />
Nominal<br />
$<br />
Year<br />
1990 $10,041 $ 7,683<br />
1991 $10,346 $ 8,203<br />
1992 $ 9,944 $ 8,112<br />
1993 $11,284 $ 9,418<br />
1994 $12,086 $10,299<br />
1995 $12,281 $10,690<br />
1996 $12,869 $11,443<br />
1997 $13,199 $11,934<br />
1998 $13,591 $12,399<br />
1999 $14,041 $13,023<br />
2000 $15,034 $14,290<br />
2001 $15,618 $15,148<br />
2002 $15,198 $15,198<br />
Per Capita Retail Sales<br />
$20,000<br />
$15,000<br />
$10,000<br />
$5,000<br />
$-<br />
1990 1991 1992 1993 1994 1995 1996 1997 1998 1999 2000<br />
Ham. Cty 2002 $ Ham. Cty. Nominal $<br />
Source: Sales <strong>and</strong> Marketing Management Survey of Buying Power <strong>and</strong> U.S. Census
Indicator – Total Retail Sales<br />
Trend From 1990 to 2002, total retail sales increased by 64.0%.<br />
Comparison Per capita retail sales in Tennessee were $13,449 for 2002. In 2002<br />
Discussion<br />
dollars, this represents a 1.2% increase over 2001.<br />
Retail Sales: Estimated net sales for all establishments primarily engaged<br />
in retail trade excluding those of wholesale <strong>and</strong> service establishments.<br />
The total retail sales figures are as reported in Sales <strong>and</strong> Marketing<br />
Management’s annual Survey of Buying Power. Sales figures are<br />
establishment-based <strong>and</strong> include purchases by persons living outside of<br />
Hamilton County. Figures have been adjusted to 2002 constant dollars<br />
using the ‘‘Implicit Price Deflator: Personal Consumption<br />
Expenditures/Total.’’<br />
Year<br />
Total Retail<br />
Sales<br />
2002 $<br />
Total Retail<br />
Sales<br />
Nominal $<br />
1990 $2,866,786 $2,193,484<br />
1991 $2,971,450 $2,355,926<br />
1992 $2,971,823 $2,424,327<br />
1993 $3,282,628 $2,739,684<br />
1994 $3,537,343 $3,014,438<br />
1995 $3,603,553 $3,136,693<br />
1996 $3,801,635 $3,380,335<br />
1997 $3,889,656 $3,516,906<br />
1998 $4,002,656 $3,651,607<br />
1999 $4,137,919 $3,837,780<br />
2000 $4,628,909 $4,399,853<br />
2001 $4,801,007 $4,656,437<br />
2002 $4,700,747 $4,700,747<br />
Total Retail Sales<br />
$6,000,000<br />
$5,000,000<br />
$4,000,000<br />
$3,000,000<br />
$2,000,000<br />
$1,000,000<br />
$-<br />
1990 1991 1992 1993 1994 1995 1996 1997 1998 1999 2000 2001 2002<br />
Total Retail Sales 2002 $ Total Retail Sales Nominal $<br />
Source: Sales <strong>and</strong> Marketing Management Survey of Buying Power
Indicator - New Privately Owned Housing Units<br />
Trend After declining 1996 to 2000, total annual new housing stock has since<br />
increased by 60.5%.<br />
Comparison The total value of all construction permits in 2003 was $102,710,858 for<br />
single family dwellings <strong>and</strong> $53,372,128 for multi-family dwellings.<br />
Discussion New Privately-Owned Housing Units: Privately-owned units for which a<br />
building permit was issued.<br />
These numbers do not measure the net increase in the housing stock<br />
since some existing units are removed from residential use. Nor do the<br />
measure the quality or affordability of the new housing being<br />
constructed.<br />
Year<br />
Single<br />
Family Multifamily<br />
1990 957 75<br />
1991 1,034 124<br />
1992 1,214 106<br />
1993 1,335 147<br />
1994 1,383 36<br />
1995 1,392 134<br />
1996 1,557 104<br />
1997 1,373 60<br />
1998 1,483 41<br />
1999 1,409 40<br />
2000 1,047 20<br />
2001 1,159 34<br />
2002 1,336 41<br />
2003 1,603 110<br />
1800<br />
1600<br />
1400<br />
1200<br />
1000<br />
800<br />
600<br />
400<br />
200<br />
0<br />
1990<br />
1991<br />
New Privately Owned Housing Units<br />
1992<br />
1993<br />
1994<br />
1995<br />
1996<br />
1997<br />
1998<br />
1999<br />
2000<br />
2001<br />
2002<br />
2003<br />
Source: Tennessee Housing Development Agency<br />
Multifamily<br />
Single Family