Economics Economic Indicators - Income and Poverty
Economics Economic Indicators - Income and Poverty
Economics Economic Indicators - Income and Poverty

Create successful ePaper yourself
Turn your PDF publications into a flip-book with our unique Google optimized e-Paper software.
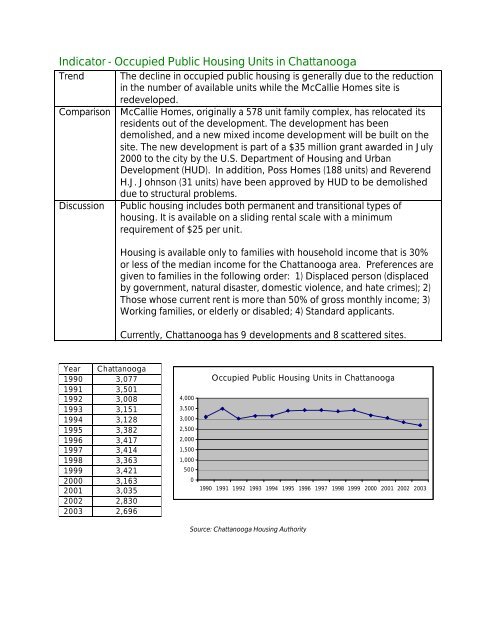
Indicator - Occupied Public Housing Units in Chattanooga<br />
Trend The decline in occupied public housing is generally due to the reduction<br />
in the number of available units while the McCallie Homes site is<br />
redeveloped.<br />
Comparison McCallie Homes, originally a 578 unit family complex, has relocated its<br />
residents out of the development. The development has been<br />
demolished, <strong>and</strong> a new mixed income development will be built on the<br />
site. The new development is part of a $35 million grant awarded in July<br />
2000 to the city by the U.S. Department of Housing <strong>and</strong> Urban<br />
Development (HUD). In addition, Poss Homes (188 units) <strong>and</strong> Reverend<br />
H.J. Johnson (31 units) have been approved by HUD to be demolished<br />
due to structural problems.<br />
Discussion Public housing includes both permanent <strong>and</strong> transitional types of<br />
housing. It is available on a sliding rental scale with a minimum<br />
requirement of $25 per unit.<br />
Housing is available only to families with household income that is 30%<br />
or less of the median income for the Chattanooga area. Preferences are<br />
given to families in the following order: 1) Displaced person (displaced<br />
by government, natural disaster, domestic violence, <strong>and</strong> hate crimes); 2)<br />
Those whose current rent is more than 50% of gross monthly income; 3)<br />
Working families, or elderly or disabled; 4) St<strong>and</strong>ard applicants.<br />
Currently, Chattanooga has 9 developments <strong>and</strong> 8 scattered sites.<br />
Year Chattanooga<br />
1990 3,077<br />
1991 3,501<br />
1992 3,008<br />
1993 3,151<br />
1994 3,128<br />
1995 3,382<br />
1996 3,417<br />
1997 3,414<br />
1998 3,363<br />
1999 3,421<br />
2000 3,163<br />
2001 3,035<br />
2002 2,830<br />
2003 2,696<br />
4,000<br />
3,500<br />
3,000<br />
2,500<br />
2,000<br />
1,500<br />
1,000<br />
500<br />
0<br />
Occupied Public Housing Units in Chattanooga<br />
1990 1991 1992 1993 1994 1995 1996 1997 1998 1999 2000 2001 2002 2003<br />
Source: Chattanooga Housing Authority