Economics Economic Indicators - Income and Poverty
Economics Economic Indicators - Income and Poverty
Economics Economic Indicators - Income and Poverty

Create successful ePaper yourself
Turn your PDF publications into a flip-book with our unique Google optimized e-Paper software.
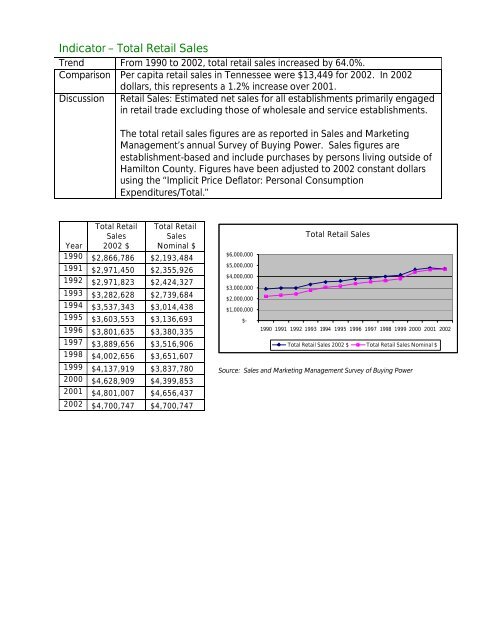
Indicator – Total Retail Sales<br />
Trend From 1990 to 2002, total retail sales increased by 64.0%.<br />
Comparison Per capita retail sales in Tennessee were $13,449 for 2002. In 2002<br />
Discussion<br />
dollars, this represents a 1.2% increase over 2001.<br />
Retail Sales: Estimated net sales for all establishments primarily engaged<br />
in retail trade excluding those of wholesale <strong>and</strong> service establishments.<br />
The total retail sales figures are as reported in Sales <strong>and</strong> Marketing<br />
Management’s annual Survey of Buying Power. Sales figures are<br />
establishment-based <strong>and</strong> include purchases by persons living outside of<br />
Hamilton County. Figures have been adjusted to 2002 constant dollars<br />
using the ‘‘Implicit Price Deflator: Personal Consumption<br />
Expenditures/Total.’’<br />
Year<br />
Total Retail<br />
Sales<br />
2002 $<br />
Total Retail<br />
Sales<br />
Nominal $<br />
1990 $2,866,786 $2,193,484<br />
1991 $2,971,450 $2,355,926<br />
1992 $2,971,823 $2,424,327<br />
1993 $3,282,628 $2,739,684<br />
1994 $3,537,343 $3,014,438<br />
1995 $3,603,553 $3,136,693<br />
1996 $3,801,635 $3,380,335<br />
1997 $3,889,656 $3,516,906<br />
1998 $4,002,656 $3,651,607<br />
1999 $4,137,919 $3,837,780<br />
2000 $4,628,909 $4,399,853<br />
2001 $4,801,007 $4,656,437<br />
2002 $4,700,747 $4,700,747<br />
Total Retail Sales<br />
$6,000,000<br />
$5,000,000<br />
$4,000,000<br />
$3,000,000<br />
$2,000,000<br />
$1,000,000<br />
$-<br />
1990 1991 1992 1993 1994 1995 1996 1997 1998 1999 2000 2001 2002<br />
Total Retail Sales 2002 $ Total Retail Sales Nominal $<br />
Source: Sales <strong>and</strong> Marketing Management Survey of Buying Power