Nitrogen Benefits of Cover Crops - Cornell University Nutrient ...
Nitrogen Benefits of Cover Crops - Cornell University Nutrient ...
Nitrogen Benefits of Cover Crops - Cornell University Nutrient ...

You also want an ePaper? Increase the reach of your titles
YUMPU automatically turns print PDFs into web optimized ePapers that Google loves.
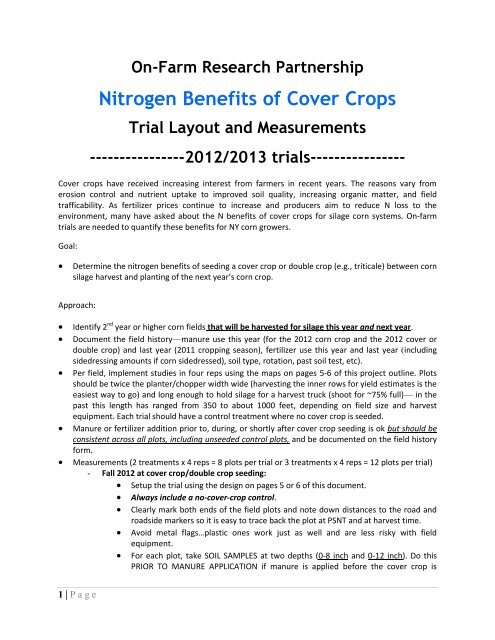
On-Farm Research Partnership<br />
<strong>Nitrogen</strong> <strong>Benefits</strong> <strong>of</strong> <strong>Cover</strong> <strong>Crops</strong><br />
Trial Layout and Measurements<br />
----------------2012/2013 trials----------------<br />
<strong>Cover</strong> crops have received increasing interest from farmers in recent years. The reasons vary from<br />
erosion control and nutrient uptake to improved soil quality, increasing organic matter, and field<br />
trafficability. As fertilizer prices continue to increase and producers aim to reduce N loss to the<br />
environment, many have asked about the N benefits <strong>of</strong> cover crops for silage corn systems. On-farm<br />
trials are needed to quantify these benefits for NY corn growers.<br />
Goal:<br />
<br />
Determine the nitrogen benefits <strong>of</strong> seeding a cover crop or double crop (e.g., triticale) between corn<br />
silage harvest and planting <strong>of</strong> the next year’s corn crop.<br />
Approach:<br />
<br />
<br />
<br />
<br />
<br />
Identify 2 nd year or higher corn fields that will be harvested for silage this year and next year.<br />
Document the field history—manure use this year (for the 2012 corn crop and the 2012 cover or<br />
double crop) and last year (2011 cropping season), fertilizer use this year and last year (including<br />
sidedressing amounts if corn sidedressed), soil type, rotation, past soil test, etc).<br />
Per field, implement studies in four reps using the maps on pages 5-6 <strong>of</strong> this project outline. Plots<br />
should be twice the planter/chopper width wide (harvesting the inner rows for yield estimates is the<br />
easiest way to go) and long enough to hold silage for a harvest truck (shoot for ~75% full)— in the<br />
past this length has ranged from 350 to about 1000 feet, depending on field size and harvest<br />
equipment. Each trial should have a control treatment where no cover crop is seeded.<br />
Manure or fertilizer addition prior to, during, or shortly after cover crop seeding is ok but should be<br />
consistent across all plots, including unseeded control plots, and be documented on the field history<br />
form.<br />
Measurements (2 treatments x 4 reps = 8 plots per trial or 3 treatments x 4 reps = 12 plots per trial)<br />
- Fall 2012 at cover crop/double crop seeding:<br />
Setup the trial using the design on pages 5 or 6 <strong>of</strong> this document.<br />
Always include a no-cover-crop control.<br />
Clearly mark both ends <strong>of</strong> the field plots and note down distances to the road and<br />
roadside markers so it is easy to trace back the plot at PSNT and at harvest time.<br />
Avoid metal flags…plastic ones work just as well and are less risky with field<br />
equipment.<br />
For each plot, take SOIL SAMPLES at two depths (0-8 inch and 0-12 inch). Do this<br />
PRIOR TO MANURE APPLICATION if manure is applied before the cover crop is<br />
1 | P a g e
seeded. In EACH PLOT, take 15 soil cores each for the two depths (take side-byside);<br />
mix the 15 cores well to make composite samples for each depth. One cup <strong>of</strong><br />
composite sample for each depth is needed per plot. Clearly label the samples with<br />
farm name, field ID/plot #, and sampling depth.<br />
Mail the 8” and 12” soil samples to Quirine Ketterings (323 Morrison Hall,<br />
Department <strong>of</strong> Animal Science, <strong>Cornell</strong> <strong>University</strong>, Ithaca, NY 14853).<br />
• We will analyze the samples for standard fertility (<strong>Cornell</strong> Morgan) and ISNT<br />
(0-8 inch samples) and PSNT (0-12 inch samples).<br />
- Spring 2012: at cover crop termination or double crop harvest time:<br />
For each plot, take SOIL SAMPLES (0-8 inch and 0-12 inch samples). Do this PRIOR<br />
TO MANURE APPLICATION if manure is applied before the corn crop is seeded; 15<br />
soil cores per plot for each depth, taken side-by-side. Mix the 15 cores well, one cup<br />
<strong>of</strong> composite sample is needed per depth per plot. Samples should be taken in the<br />
area that will be harvested (so inner 6 rows <strong>of</strong> a 12 row plot or inner 4 rows <strong>of</strong> an 8<br />
row plot, etc.).<br />
Harvest the cover crop: Use a 2 square foot frame at three locations in each plot to<br />
cut the cover crop at the soil level without soil contamination <strong>of</strong> the cover crop.<br />
Combine in the same bag. Fold over the top <strong>of</strong> the sample bag and write farm name,<br />
field ID number (plot number), and sampling date on bag before leaving the field. In<br />
total, each bag should contain the harvest <strong>of</strong> three 2-square foot areas.<br />
Bagged samples and data sheet go to NMSP at <strong>Cornell</strong> for processing and analysis.<br />
Take pictures <strong>of</strong> each <strong>of</strong> the 8 (or 12) plots so we have a record <strong>of</strong> visual differences<br />
or the lack there<strong>of</strong>.<br />
Mail samples and data sheets to Quirine Ketterings (323 Morrison Hall, Department<br />
<strong>of</strong> Animal Science, <strong>Cornell</strong> <strong>University</strong>, Ithaca, NY 14853). Email photos <strong>of</strong> plots (with<br />
identification information) to Quirine Ketterings at qmk2@cornell.edu<br />
• We will analyze the soil samples for standard fertility (<strong>Cornell</strong> Morgan) and<br />
ISNT (0-8 inch samples) and PSNT (0-12 inch samples).<br />
• We will determine the above ground biomass and analyze the harvest<br />
samples for C and N content, then calculate total amounts <strong>of</strong> C and N and<br />
the C:N ratio.<br />
- June 2013 (PSNT time):<br />
Sample soils for EACH PLOT at two depths: 0-8 inches and 0-12 inches (take cores<br />
next to each other) within the area to be harvested in fall; each sample should be a<br />
composite <strong>of</strong> 15 cores taken between corn rows (inner 6 rows <strong>of</strong> a 12 row plot or<br />
inner 4 rows <strong>of</strong> an 8 row plot, etc.). Be sure samples are clearly labeled with farm<br />
name, field ID/plot #, and sampling depth.<br />
Mail soil samples to Quirine Ketterings (323 Morrison Hall, Department <strong>of</strong> Animal<br />
Science, <strong>Cornell</strong> <strong>University</strong>, Ithaca, NY 14853).<br />
• We will analyze the samples for standard fertility (<strong>Cornell</strong> Morgan) and ISNT<br />
(0-8 inch samples) and PSNT (0-12 inch samples).<br />
On the same day you take soil samples, also determine stand density (set out 40<br />
feet <strong>of</strong> tape and count corn plants on the left and the right <strong>of</strong> the tape (2 readings<br />
per plot).<br />
Take pictures <strong>of</strong> each <strong>of</strong> the 8 (or 12) plots so we have a record <strong>of</strong> visual differences<br />
or the lack there<strong>of</strong>. Email with plot IDs to Quirine Ketterings at qmk2@cornell.edu<br />
2 | P a g e
- 2013 corn harvest time:<br />
Work with the producer to remove the headlands.<br />
Select rows to be harvested and direct the chopper and trucks to these rows.<br />
Determine yield for EACH PLOT (yield monitor, truck scales in the field, or scales at<br />
the farm; if doing the latter, give the driver an index card with the plot number and<br />
instructions to write down the empty truck weight and the weight after plot<br />
harvest).<br />
Subsample the chopped corn from EACH PLOT so we can obtain moisture and<br />
forage quality analysis (1 gallon bag per plot). Subsamples can be collected at the<br />
bunk (requires someone at the bunk) or in the field, depending on what is easiest to<br />
do. Make sure the sample is representative <strong>of</strong> the plot (so if samples are taken at<br />
the bunk, walk around the pile and take handfuls from different portions in the<br />
pile).<br />
After the crop is removed and weighed, walk the field with a measuring wheel to<br />
measure the length <strong>of</strong> the harvested area. Measure row width (chopper width) and<br />
multiply by row length to determine yield for each plot individually.<br />
Take corn stalk nitrate test samples at harvest from rows immediately left and right<br />
<strong>of</strong> the chopped plot. Alternatively, can take stalk samples from within area to be<br />
harvested before chopping. Precisely sample the 8 inch section <strong>of</strong> stalk that is<br />
between 6 and 14 inches <strong>of</strong>f the ground. Take 15 stalks per plot; split samples into<br />
quarters (lengthwise) and mail in 15 quarter-stalks per plot). This is most easily done<br />
by having the chopper harvest the inner rows and then taking CSNT samples from<br />
the adjacent rows in the plot that did not get harvested but still got the same<br />
treatment. For a slide set on CSNT, see<br />
http://nmsp.cals.cornell.edu/projects/nitrogenforcorn/StalkNtest.pdf.<br />
Promptly mail the bagged corn samples, stalk samples, and data sheets to Quirine<br />
Ketterings (323 Morrison Hall, Department <strong>of</strong> Animal Science, <strong>Cornell</strong> <strong>University</strong>,<br />
Ithaca, NY 14853).<br />
• We will analyze the stalks for CSNT and the forage samples for dry matter<br />
and forage quality<br />
If your planter width is not a multiple <strong>of</strong> the harvest width, call us to discuss plot setup.<br />
If you have a site identified, please let us know so we can send you pre-labeled samplingcontainers/bags<br />
for the soil sampling rounds and the forage quality samples and CSNTs.<br />
No samples can be processed without a completed field history form and commitment to participate<br />
from cover crop seeding through the harvest <strong>of</strong> the following year’s corn silage crop.<br />
Quirine Ketterings at qmk2@cornell.edu or 607 255 3061 (<strong>of</strong>fice) or 607 229 0120 (cell) Greg Godwin at<br />
gsg6@cornell.edu or 607-279-4627 (cell)<br />
3 | P a g e
BY BEING AN ON-FARM RESEARCH PARTNER, YOUR FARM DATA BECOME PART OF A STATEWIDE<br />
DATASET THAT BENEFITS THE AGRICULTURAL INDUSTRY. SUCH A DATASET IS ESSENTIAL FOR FINE<br />
TUNING OF OUR LAND GRANT UNIVERSITY GUIDELINES.<br />
New York On-Farm Research Partnership<br />
http://nmsp.cals.cornell.edu/NYOnFarmResearchPartnership<br />
There is great power from research information when<br />
field data are generated through well designed, repeated<br />
and widely implemented trials, with proper data<br />
collection and statistically valid analyses.<br />
Consider being an on-farm research partner!<br />
Relevant Questions and Sound Science for Agricultural<br />
Pr<strong>of</strong>itability and Protection <strong>of</strong> the Environment<br />
4 | P a g e<br />
For further information or questions:<br />
On-Farm Research Partnership<br />
c/o Quirine M. Ketterings<br />
323 Morrison Hall, <strong>Cornell</strong> <strong>University</strong>, Ithaca, NY 14853<br />
http://nmsp.cals.cornell.edu/NYOnFarmResearchPartnership<br />
Email: qmk2@cornell.edu
With and Without <strong>Cover</strong> Crop Comparison<br />
One cover crop only<br />
Harvestable strips are a corn chopper width times two and then field length long enough to get ¾ <strong>of</strong> a<br />
truck load that can be weighed. If the entire field is seeded with the cover crop, just leave four strips<br />
without cover. An example is listed below (4 replications). All measurements are taken per plot (width <strong>of</strong><br />
chopper times 2; harvest inner rows; length: 350-1000 feet depending on field size, truck weights, and<br />
expected yield).<br />
Per field (width <strong>of</strong> chopper times two):<br />
Field<br />
Plot 1<br />
Plot 2<br />
Plot 3<br />
Plot 4<br />
Plot 5<br />
Plot 6<br />
Plot 7<br />
Plot 8<br />
<strong>Cover</strong><br />
crop<br />
No<br />
cover<br />
crop<br />
No<br />
cover<br />
crop<br />
<strong>Cover</strong><br />
crop<br />
No<br />
cover<br />
crop<br />
<strong>Cover</strong><br />
crop<br />
<strong>Cover</strong><br />
crop<br />
No<br />
cover<br />
crop<br />
Block 1 Block 2 Block 3 Block 4<br />
5 | P a g e
Two <strong>Cover</strong> Crop Species and Control Comparison<br />
Two cover crop species and a control<br />
Harvestable strips are a corn chopper width times two and then field length long enough to get ¾ <strong>of</strong> a<br />
truck load that can be weighed. If the entire field is seeded with the cover crop, just leave four strips<br />
without cover. An example is listed below (4 replications). All measurements are taken per plot (width <strong>of</strong><br />
chopper times 2; harvest inner rows; length: 350-1000 feet depending on field size, truck weights, and<br />
expected yield).<br />
Per field (width <strong>of</strong> chopper times two):<br />
Field (<strong>Cover</strong> crop A as planned)<br />
Plot 1<br />
Plot<br />
2<br />
Plot 3<br />
Plot 4<br />
Plot 5<br />
Plot 6<br />
Plot<br />
7<br />
Plot 8<br />
Plot 9<br />
Plot<br />
10<br />
Plot<br />
11<br />
Plot<br />
12<br />
<strong>Cover</strong><br />
crop<br />
A<br />
No<br />
cover<br />
crop<br />
<strong>Cover</strong><br />
crop<br />
B<br />
No<br />
<strong>Cover</strong><br />
crop<br />
<strong>Cover</strong><br />
crop<br />
A<br />
<strong>Cover</strong><br />
crop<br />
B<br />
No<br />
cover<br />
crop<br />
<strong>Cover</strong><br />
crop<br />
A<br />
<strong>Cover</strong><br />
crop<br />
B<br />
<strong>Cover</strong><br />
crop<br />
A<br />
No<br />
cover<br />
crop<br />
<strong>Cover</strong><br />
crop<br />
B<br />
Block 1 Block 2 Block 3 Block 4<br />
6 | P a g e
<strong>Nutrient</strong> Management Spear Program<br />
<strong>Cover</strong> Crop Project<br />
General Information Page<br />
2012/2013<br />
Collaborator:<br />
Name<br />
Address<br />
Home Phone ( )<br />
Cell Phone ( )<br />
Email<br />
Producer:<br />
Name<br />
Company<br />
Address<br />
Phone ( )<br />
Email<br />
7 | P a g e
Field Activities Record 2012/2013<br />
Location:<br />
Experiment:<br />
NMSP <strong>Cover</strong> Crop Project<br />
Date Activity/Notes (For each site visit, describe what was done, list participants,<br />
observations made, and any problems encountered or field<br />
information received that may help in interpretation <strong>of</strong> trial results.)<br />
8 | P a g e
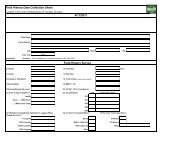
2013 PSNT Time Data Form<br />
Experiment:<br />
NMSP <strong>Cover</strong> Crop Project<br />
Location:<br />
PSNT Sampling Date:<br />
Recorded By:<br />
Plot<br />
1<br />
Length<br />
(40 ft)<br />
Count<br />
Row 1<br />
Count<br />
Row 2<br />
Leaf count<br />
per plant<br />
(est ave)<br />
Estimate <strong>of</strong> corn height to<br />
highest point <strong>of</strong> last leaf<br />
Units: ______________________<br />
(inches, ft, or cm?)<br />
2<br />
3<br />
4<br />
5<br />
6<br />
7<br />
8<br />
9<br />
10<br />
11<br />
12<br />
Checklist<br />
Soil 8" and 12" (15 cores per plot sample for each<br />
depth)<br />
Stand count<br />
Corn height<br />
Pictures <strong>of</strong> all plots<br />
Field Map and notes<br />
Field History<br />
NOTES:<br />
9 | P a g e
2013 Harvest Time Data Form –Plot lengths<br />
Experiment:<br />
NMSP <strong>Cover</strong> Crop Project<br />
Location:<br />
Harvest Date:<br />
Recorded By:<br />
Plot<br />
1<br />
2<br />
3<br />
4<br />
5<br />
6<br />
7<br />
8<br />
9<br />
10<br />
11<br />
12<br />
Harvested Plot<br />
Length (ft)<br />
# Rows<br />
Harvested<br />
Checklist<br />
Silage subsamples from each plot<br />
Harvested plot lengths<br />
Corn stalk nitrate samples from each plot<br />
NOTES:<br />
10 | P a g e
2013 Machine Harvest Data Form - for use with single-weigh truck scale<br />
NMSP <strong>Cover</strong> Crop Project<br />
Experiment:<br />
Location:<br />
Harvest Date:<br />
Recorded By:<br />
Entered By:<br />
Checked By:<br />
Chopper width: rows ___________ measured ___________________ (indicate inches or feet)<br />
Row length units (ft or meters?)____________<br />
Weight units (lb, tons, or metric unit?)_________<br />
Plot<br />
Truck ID<br />
Truck weight<br />
(initial)<br />
Truck weight<br />
(full)<br />
Silage weight (full wt<br />
minus initial wt)<br />
1<br />
2<br />
3<br />
4<br />
5<br />
6<br />
7<br />
8<br />
9<br />
10<br />
11<br />
12<br />
11 | P a g e
2013 Machine Harvest Data Form - for use with multiple trouper scales<br />
A. Empty weight calibration<br />
Experiment: NMSP <strong>Cover</strong> Crop Project Recorded by<br />
Location:<br />
Harvest Date:<br />
Entered by<br />
Checked by<br />
Chopper width: #rows ___________ width in inches or feet ___________________<br />
Row spacing (e.g., 15 inches or 30 inches)<br />
____________________<br />
Row length units (ft or meters?)____________<br />
Weight units (lb, tons, or metric unit?)_________<br />
Calibration<br />
Empty Truck<br />
Weights Truck ID Scale 1 wt Scale 2 wt Scale 3 wt Scale 4 wt Scale 5 wt Scale 6 wt<br />
Truck/wagon 1<br />
Truck/wagon 1<br />
Ave wt Truck 1<br />
Weight<br />
empty truck/wagon<br />
(sum <strong>of</strong> Scale wts)<br />
Scale location<br />
diagram<br />
Truck/wagon 2<br />
Truck/wagon 2<br />
Ave wt Truck 2<br />
Truck/wagon 3<br />
Truck/wagon 3<br />
Ave wt Truck 3<br />
12 | P a g e
Calibration<br />
Empty Truck<br />
Weights Truck ID Scale 1 wt Scale 2 wt Scale 3 wt Scale 4 wt Scale 5 wt Scale 6 wt<br />
Truck/wagon 4<br />
Ave wt Truck 4<br />
Truck/wagon 5<br />
Truck/wagon 5<br />
Ave wt Truck 5<br />
Weight<br />
empty truck/wagon<br />
(sum <strong>of</strong> Scale wts)<br />
Scale location<br />
diagram<br />
13 | P a g e
2013 Machine Harvest Data Form - for use with multiple trouper scales<br />
B. Weight <strong>of</strong> harvested silage<br />
Experiment: NMSP <strong>Cover</strong> Crop Project Recorded by<br />
Location:<br />
Harvest Date:<br />
Harvest Weights<br />
Plot Truck ID Scale 1 wt Scale 2 wt Scale 3 wt Scale 4 wt Scale 5 wt Scale 6 wt<br />
1<br />
2<br />
3<br />
4<br />
5<br />
6<br />
7<br />
8<br />
9<br />
10<br />
11<br />
12<br />
Entered by<br />
Checked by<br />
Weight<br />
empty<br />
truck/wagon<br />
Truck weight with<br />
silage<br />
(sum <strong>of</strong> Scale wts)<br />
14 | P a g e