Phosphorus Soil Testing Methods - Cornell University Nutrient ...
Phosphorus Soil Testing Methods - Cornell University Nutrient ...
Phosphorus Soil Testing Methods - Cornell University Nutrient ...

You also want an ePaper? Increase the reach of your titles
YUMPU automatically turns print PDFs into web optimized ePapers that Google loves.
Agronomy Fact Sheet Series<br />
Fact Sheet 15<br />
<strong>Phosphorus</strong> <strong>Soil</strong> <strong>Testing</strong> <strong>Methods</strong><br />
<strong>Cornell</strong> <strong>University</strong> annually publishes the<br />
“<strong>Cornell</strong> Guide for Integrated Field Crops<br />
Management”. This document includes<br />
phosphorus (P) fertilizer guidelines for a large<br />
number of field crops grown in New York. The<br />
guidelines are based on field research in New<br />
York that shows that the Morgan soil test, the<br />
agronomic soil test used at <strong>Cornell</strong> <strong>University</strong>,<br />
can be used to predict likeliness of a yield<br />
response to additional P for crops grown under<br />
New York growing conditions.<br />
What is an agronomic soil test<br />
The agronomic P soil test is an index of P<br />
availability which means that we can use the<br />
soil test to determine likeliness of a response<br />
to additional P. An agronomic soil test extracts<br />
only a small portion of the total amount of P in<br />
the soil as not all of that P is available for crop<br />
growth. Agronomic soil test results are<br />
classified as low, medium, high or very high<br />
based on crop response to additional P; crops<br />
grown on soils that are already high or very<br />
high in P are not likely to respond with a yield<br />
increase if additional P fertilizer is added. On<br />
the other hand, soils that are low or medium in<br />
P will likely show higher yields if extra P is<br />
added. For more information on P fertilizer use<br />
for corn, see Agronomy Fact Sheet 8: Starter<br />
<strong>Phosphorus</strong> Fertilizer for Corn.<br />
(Modified) Morgan soil test method<br />
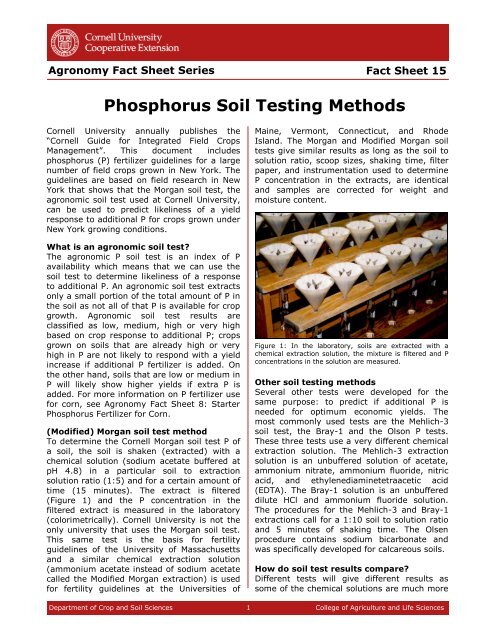
To determine the <strong>Cornell</strong> Morgan soil test P of<br />
a soil, the soil is shaken (extracted) with a<br />
chemical solution (sodium acetate buffered at<br />
pH 4.8) in a particular soil to extraction<br />
solution ratio (1:5) and for a certain amount of<br />
time (15 minutes). The extract is filtered<br />
(Figure 1) and the P concentration in the<br />
filtered extract is measured in the laboratory<br />
(colorimetrically). <strong>Cornell</strong> <strong>University</strong> is not the<br />
only university that uses the Morgan soil test.<br />
This same test is the basis for fertility<br />
guidelines of the <strong>University</strong> of Massachusetts<br />
and a similar chemical extraction solution<br />
(ammonium acetate instead of sodium acetate<br />
called the Modified Morgan extraction) is used<br />
for fertility guidelines at the Universities of<br />
Maine, Vermont, Connecticut, and Rhode<br />
Island. The Morgan and Modified Morgan soil<br />
tests give similar results as long as the soil to<br />
solution ratio, scoop sizes, shaking time, filter<br />
paper, and instrumentation used to determine<br />
P concentration in the extracts, are identical<br />
and samples are corrected for weight and<br />
moisture content.<br />
Figure 1: In the laboratory, soils are extracted with a<br />
chemical extraction solution, the mixture is filtered and P<br />
concentrations in the solution are measured.<br />
Other soil testing methods<br />
Several other tests were developed for the<br />
same purpose: to predict if additional P is<br />
needed for optimum economic yields. The<br />
most commonly used tests are the Mehlich-3<br />
soil test, the Bray-1 and the Olson P tests.<br />
These three tests use a very different chemical<br />
extraction solution. The Mehlich-3 extraction<br />
solution is an unbuffered solution of acetate,<br />
ammonium nitrate, ammonium fluoride, nitric<br />
acid, and ethylenediaminetetraacetic acid<br />
(EDTA). The Bray-1 solution is an unbuffered<br />
dilute HCl and ammonium fluoride solution.<br />
The procedures for the Mehlich-3 and Bray-1<br />
extractions call for a 1:10 soil to solution ratio<br />
and 5 minutes of shaking time. The Olsen<br />
procedure contains sodium bicarbonate and<br />
was specifically developed for calcareous soils.<br />
How do soil test results compare<br />
Different tests will give different results as<br />
some of the chemical solutions are much more<br />
Department of Crop and <strong>Soil</strong> Sciences 1 College of Agriculture and Life Sciences
Morgan P (ppm)<br />
Morgan P (ppm)<br />
aggressive in extracting P from the soil than<br />
others. The Mehlich-3 solution is the most<br />
aggressive and that results in the highest soil<br />
test values. The Bray-1 solution usually results<br />
in slightly lower values that the Mehlich-3<br />
analyses (usually between 70-85% of the<br />
value of the Mehlich-3 test). The Olsen and<br />
(Modified) Morgan tests are weaker with the<br />
Morgan test extracting the smallest amounts of<br />
P. The test results from one method are not<br />
always directly comparable to those of another<br />
method. Figure 2 shows that depending on the<br />
soil, the Mehlich-3 test can extract anywhere<br />
between 3 and 30 times as much P as the<br />
Morgan test!<br />
100<br />
80<br />
Laboratory to laboratory differences<br />
Slight differences in laboratory procedures<br />
(e.g. different soil to solution ratios, shaking<br />
times, filter paper, etc.) will lead to differences<br />
in the soil test results. This can be seen in<br />
Table 2 for four random soil samples. Thus,<br />
laboratory specific conversions need to be used<br />
to derive <strong>Cornell</strong> Morgan soil test estimates<br />
from Mehlich-3 data.<br />
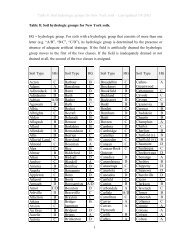
Table 2: Laboratories differ in the methods used to<br />
determine agronomic soil test P levels. In this example<br />
four samples were analyzed by five laboratories that all<br />
use the Mehlich-3 extraction.<br />
Mehlich-3 soil test P results (ppm)<br />
Lab A Lab B Lab C Lab D Lab E<br />
Sample 1 49 37 41 49 43<br />
Sample 2 56 42 42 43 46<br />
Sample 3 145 106 107 108 107<br />
Sample 4 220 202 199 216 205<br />
60<br />
40<br />
20<br />
R 2 = 0.35<br />
0<br />
0 100 200 300 400 500 600 700<br />
Mehlich-III P (ppm)<br />
Figure 2: We cannot use a Mehlich-3 P test to determine<br />
fertility guidelines in New York as the Mehlich-3 test<br />
results are very poorly related to the Morgan soil test upon<br />
which all fertility guidelines are based in New York.<br />
Conversion models<br />
If the pH of the soil and the amount of<br />
Mehlich-3 extractable P, Ca and Al are known,<br />
an estimate of the Morgan soil test P value can<br />
be derived. These conversions will not be<br />
totally accurate for all soils and require<br />
sampling in the fall at a 2-3 sample per acre<br />
density for greatest accuracy (see Figure 3).<br />
100<br />
80<br />
<strong>Soil</strong> test conversion tools<br />
A stand-alone excel conversion tool is available<br />
from the <strong>Nutrient</strong> Management Spear Program<br />
website: http://nmsp.css.cornell.edu/software/<br />
morganequivalents.asp. When you use this<br />
conversion tool, make sure to correctly identify<br />
(1) the laboratory that generated the Mehlich-<br />
3 data, and (2) the units (ppm versus<br />
lbs/acre)! Input data needed for the<br />
conversion from Mehlihc-3 data to Morgan<br />
equivalents are: soil pH, Mehlich-3 extractable<br />
P, Ca and Al. Keep in mind that not all soils<br />
give reliable conversions; always check field<br />
histories to make sure the results make sense!<br />
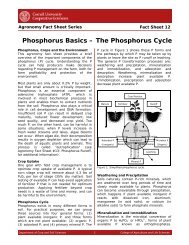
Additional resources:<br />
o <strong>Cornell</strong> <strong>University</strong> Agronomy Fact Sheet #8 (Starter<br />
<strong>Phosphorus</strong> Fertilizer for corn), Fact Sheet #12:<br />
(<strong>Phosphorus</strong> Basics – The phosphorus Cycle):<br />
nmsp.cals.cornell.edu/publications/factsheets.asp.<br />
o <strong>Nutrient</strong> Management Spear Program soil test<br />
conversion website: http://nmsp.cals.cornell.edu/<br />
software/morganequivalents.asp.<br />
For more information<br />
60<br />
40<br />
20<br />
R 2 = 0.88<br />
0<br />
0 20 40 60 80 100<br />
Predicted Morgan P (ppm)<br />
Figure 3: Morgan soil test estimates can be derived based<br />
on Mehlich-3 Ca, P, Al, and soil pH (predicted Morgan P)<br />
but the conversions are not 100% accurate for all soils.<br />
<strong>Nutrient</strong> Management Spear Program<br />
http://nmsp.cals.cornell.edu<br />
Quirine M. Ketterings and Pete Barney<br />
2010 (first released in 2006)<br />
Department of Crop and <strong>Soil</strong> Sciences 2 College of Agriculture and Life Sciences