- Page 1 and 2: MAN B&W S50ME-B8-TII Project Guide
- Page 3: MAN B&W Engine Design .............
- Page 6 and 7: MAN B&W Contents Chapter Section 5
- Page 8 and 9: MAN B&W Contents Chapter Section 13
- Page 11 and 12: MAN B&W Index Subject Section Subje
- Page 13 and 14: MAN B&W Index Subject Section Subje
- Page 15 and 16: MAN B&W Index Subject Section Subje
- Page 17: MAN B&W Index Subject Section Subje
- Page 21 and 22: MAN B&W 1.01 The ME-B Tier II Engin
- Page 23 and 24: MAN B&W 1.02 Engine Type Designatio
- Page 25 and 26: MAN B&W 1.04 Engine Power Range and
- Page 27 and 28: MAN B&W 1.06 ME-B Mark 8 Engine Des
- Page 29 and 30: MAN B&W 1.06 For functional check o
- Page 31 and 32: MAN B&W 1.06 Hydraulic Cylinder Uni
- Page 33 and 34: MAN B&W 1.06 Gallery Arrangement Th
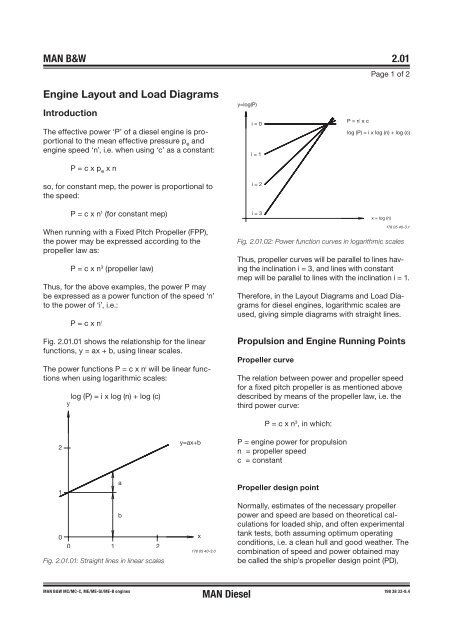
- Page 35: MAN B&W Engine Layout and Load Diag
- Page 39 and 40: MAN B&W 2.02 Propeller diameter and
- Page 41 and 42: MAN B&W 2.03 Layout Diagram Sizes P
- Page 43 and 44: MAN B&W 2.04 Engine Load Diagram De
- Page 45 and 46: MAN B&W 2.04 MAN Diesel Page 4 of 1
- Page 47 and 48: MAN B&W 2.04 Example 1: Normal runn
- Page 49 and 50: MAN B&W 2.04 Example 3: Normal runn
- Page 51 and 52: MAN B&W 2.04 MAN B&W ME/ME-C/ME-GI/
- Page 53: MAN B&W 2.06 Specific Fuel Oil Cons
- Page 56 and 57: MAN B&W 2.08 SFOC reference conditi
- Page 58 and 59: MAN B&W 2.09 SFOC Calculations for
- Page 60 and 61: MAN B&W 2.10 SFOC calculations, exa
- Page 62 and 63: MAN B&W 2.11 Fuel Consumption at an
- Page 65: MAN B&W Turbocharger Selection & Ex
- Page 68 and 69: MAN B&W 3.02 Exhaust Gas By�pass
- Page 70 and 71: MAN B&W 3.03 NOx Reduction by SCR T
- Page 73: MAN B&W MAN Diesel Electricity Prod
- Page 76 and 77: MAN B&W 4.01 MAN Diesel Page 2 of 6
- Page 78 and 79: MAN B&W 4.01 PTO/RCF Side mounted g
- Page 80 and 81: MAN B&W 4.01 Yard deliveries are: 1
- Page 82 and 83: MAN B&W 4.03 Engine preparations fo
- Page 84 and 85: MAN B&W 4.03 MAN B&W K98MC/MC-C/ME/
- Page 86 and 87:
MAN B&W 4.03 Air cooler Pole wheel
- Page 88 and 89:
MAN B&W 4.04 PTO type: BW II/GCR Po
- Page 90 and 91:
MAN B&W 4.04 Auxiliary Propulsion S
- Page 92 and 93:
MAN Diesel 4.06 L16/24 GenSet Data
- Page 94 and 95:
MAN Diesel 4.06 L16/24 GenSet Data
- Page 96 and 97:
MAN Diesel 4.07 L21/31 GenSet Data
- Page 98 and 99:
MAN Diesel 4.08 L23/30H GenSet Data
- Page 100 and 101:
MAN Diesel 4.08 L23/30H GenSet Data
- Page 102 and 103:
MAN Diesel 4.09 L27/38 GenSet Data
- Page 104 and 105:
MAN Diesel 4.10 L28/32H GenSet Data
- Page 107:
MAN B&W MAN Diesel Installation Asp
- Page 110 and 111:
MAN B&W 5.02 Space Requirement Free
- Page 112 and 113:
MAN B&W 5.03 Crane beam for overhau
- Page 114 and 115:
MAN B&W 5.03 Crane beam for overhau
- Page 116 and 117:
MAN B&W 5.04 Engine room crane The
- Page 118 and 119:
MAN B&W 5.04 MAN B&W Double�Jib C
- Page 120 and 121:
MAN B&W 5.06 Engine and Gallery Out
- Page 122 and 123:
MAN B&W 5.06 5,110 4,600 0 Fig. 5.0
- Page 124 and 125:
MAN B&W 5.06 Fig. 5.06.02a: Engine
- Page 126 and 127:
MAN B&W 5.06 4,600 2,990 0 MAN B&W
- Page 128 and 129:
MAN B&W 5.07 Centre of Gravity Fig.
- Page 130 and 131:
MAN B&W 5.09 Engine Pipe Connection
- Page 132 and 133:
MAN B&W 5.09 AE S1 1,373 1,195 AH 6
- Page 134 and 135:
MAN B&W 5.10 Counterflanges ��
- Page 136 and 137:
MAN B&W 5.10 Counterflanges, Connec
- Page 138 and 139:
MAN B&W 5.10 MHI Type MET Fig. 5.10
- Page 140 and 141:
TCA MAN B&W 5.10 ABB Type TPL TPL T
- Page 142 and 143:
MAN B&W 5.11 Engine Seating and Hol
- Page 144 and 145:
MAN B&W 5.12 Engine Seating Profile
- Page 146 and 147:
MAN B&W 5.12 �������
- Page 148 and 149:
MAN B&W 5.13 The mechanical top bra
- Page 150 and 151:
MAN B&W 5.15 Hydraulic Top Bracing
- Page 152 and 153:
MAN B&W 5.16 MOP (Main Operating Pa
- Page 154 and 155:
MAN B&W 5.16 PC parts for PMI/CoCoS
- Page 156 and 157:
MAN B&W 5.17 Brush holder arrangeme
- Page 158 and 159:
MAN B&W 5.18 MAN Diesel Page 1 of 8
- Page 160 and 161:
MAN B&W 5.18 Main Dimensions MAN B&
- Page 162 and 163:
MAN B&W 5.18 Hydraulic Power Unit f
- Page 164 and 165:
MAN B&W 5.18 Propulsion control sta
- Page 167:
MAN B&W MAN Diesel List of Capaciti
- Page 170 and 171:
MAN B&W 6.02 List of Capacities and
- Page 172 and 173:
MAN B&W 6.03 List of Capacities for
- Page 174 and 175:
MAN B&W 6.03 List of Capacities for
- Page 176 and 177:
MAN B&W 6.04 Auxiliary Machinery Ca
- Page 178 and 179:
MAN B&W 6.04 Calculation of List of
- Page 180 and 181:
MAN B&W 6.04 Freshwater Generator I
- Page 182 and 183:
MAN B&W 6.04 Calculation of Freshwa
- Page 184 and 185:
MAN B&W 6.04 ∆m M% = 14 x ln (P M
- Page 186 and 187:
MAN B&W 6.04 Calculation of Exhaust
- Page 189:
MAN B&W MAN Diesel Fuel 7
- Page 192 and 193:
MAN B&W 7.01 Fuel Oil System To dra
- Page 194 and 195:
MAN B&W 7.02 Fuel Oils Marine diese
- Page 196 and 197:
MAN B&W 7.04 Fuel Oil Pipe Insulati
- Page 198 and 199:
MAN B&W 7.04 Fuel Oil Pipe Heat Tra
- Page 200 and 201:
MAN B&W 7.05 Fuel Oil Heater The he
- Page 202 and 203:
MAN B&W 7.06 Water In Fuel Emulsifi
- Page 205:
MAN B&W MAN Diesel Lubricating Oil
- Page 208 and 209:
MAN B&W 8.02 Hydraulic Power Supply
- Page 210 and 211:
MAN B&W 8.02 Hydraulic Pumps for th
- Page 212 and 213:
MAN B&W 8.03 MAN B&W MC/MC�C, ME/
- Page 214 and 215:
MAN B&W 8.05 Components for Lubrica
- Page 216 and 217:
MAN B&W 8.05 Lubricating oil outlet
- Page 218 and 219:
MAN B&W 8.06 Note: When calculating
- Page 220 and 221:
MAN B&W 8.08 Hydraulic Oil Back�f
- Page 223:
MAN B&W MAN Diesel Cylinder Lubrica
- Page 226 and 227:
MAN B&W 9.02 MAN B&W Alpha Cylinder
- Page 228 and 229:
MAN B&W 9.02 Cylinder Oil Pipe Heat
- Page 230 and 231:
MAN B&W 9.02 AC 46/40/35ME-B 60/50M
- Page 233:
MAN B&W MAN Diesel Piston Rod Stuff
- Page 237:
MAN B&W MAN Diesel Central Cooling
- Page 240 and 241:
MAN B&W 11.02 Central Cooling Water
- Page 242 and 243:
MAN B&W 11.03 Jacket water system D
- Page 245 and 246:
MAN B&W 12.01 Seawater Systems The
- Page 247 and 248:
MAN B&W 12.03 Seawater Cooling Pipe
- Page 249 and 250:
MAN B&W 12.05 Jacket Cooling Water
- Page 251 and 252:
MAN B&W 12.07 Components for Jacket
- Page 253:
MAN B&W 12.08 Temperature at Start
- Page 257 and 258:
MAN B&W 13.01 Starting and Control
- Page 259 and 260:
MAN B&W 13.03 Starting and Control
- Page 261:
MAN B&W 13.04 Electric Motor for Tu
- Page 265 and 266:
MAN B&W 14.01 Scavenge Air System S
- Page 267 and 268:
MAN B&W 14.02 Control of the Auxili
- Page 269 and 270:
MAN B&W 14.03 Scavenge Air Pipes PI
- Page 271 and 272:
MAN B&W 14.05 Scavenge Air Cooler C
- Page 273 and 274:
MAN B&W 14.06 Scavenge Air Box Drai
- Page 275:
MAN B&W 14.07 Fire Extinguishing Pi
- Page 279 and 280:
MAN B&W 15.01 Exhaust Gas System Th
- Page 281 and 282:
MAN B&W 15.02 Cleaning Systems Fig.
- Page 283 and 284:
MAN B&W 15.04 Components of the Exh
- Page 285 and 286:
MAN B&W 15.05 Calculation of Exhaus
- Page 287 and 288:
MAN B&W 15.05 Pressure losses and c
- Page 289 and 290:
MAN B&W 15.06 One turbocharger loca
- Page 291:
MAN B&W 15.07 Diameter of Exhaust G
- Page 295 and 296:
MAN B&W 16.01 Engine Control System
- Page 297 and 298:
MAN B&W 16.01 Mechanical�hydrauli
- Page 299 and 300:
MAN B&W 16.01 Auxiliary equipment s
- Page 301:
MAN B&W 16.01 Pneumatic Manoeuvring
- Page 305 and 306:
MAN B&W 17.01 Vibration Aspects The
- Page 307 and 308:
MAN B&W 17.02 Preparation for compe
- Page 309 and 310:
MAN B&W 17.03 Electrically Driven M
- Page 311 and 312:
MAN B&W 17.04 Power Related Unbalan
- Page 313 and 314:
MAN B&W 17.05 Vibration Limits Vali
- Page 315 and 316:
MAN B&W 17.06 Axial Vibrations When
- Page 317:
MAN B&W 17.07 External Forces and M
- Page 321 and 322:
MAN B&W 18.01 Monitoring Systems an
- Page 323 and 324:
MAN B&W 18.02 PMI System, Type On
- Page 325 and 326:
MAN B&W 18.03 CoCoS�EDS Sensor Li
- Page 327 and 328:
MAN B&W 18.04 General outline of th
- Page 329 and 330:
MAN B&W 18.04 Alarms for UMS - Clas
- Page 331 and 332:
MAN B&W 18.04 Slow down for UMS - C
- Page 333 and 334:
MAN B&W 18.05 Local Instruments Pag
- Page 335 and 336:
MAN B&W 18.05 Local instruments Rem
- Page 337 and 338:
MAN B&W 18.06 Fig. 18.06.01a: Oil m
- Page 339 and 340:
MAN B&W 18.06 Water In Oil Monitori
- Page 341:
MAN B&W 18.07 Identification of Ins
- Page 345 and 346:
MAN B&W 19.01 Dispatch Pattern, Tes
- Page 347 and 348:
MAN B&W 19.02 Specification for pai
- Page 349 and 350:
MAN B&W Dispatch Pattern, List of M
- Page 351 and 352:
MAN B&W 19.06 List of Spare Parts,
- Page 353 and 354:
MAN B&W 19.07 Additional Spares Pag
- Page 355 and 356:
MAN B&W 19.08 Wearing parts The wea
- Page 357 and 358:
MAN B&W 19.09 Large spare parts, di
- Page 359:
MAN B&W 19.11 Tool Panels Pos. Sect
- Page 363 and 364:
MAN B&W 20.01 Project Support and D
- Page 365 and 366:
MAN B&W 20.03 Extent of Delivery Th
- Page 367 and 368:
MAN B&W 20.04 Installation Document
- Page 369 and 370:
MAN B&W 20.04 Main Section 917 Engi
- Page 371:
MAN B&W MAN Diesel Appendix A
- Page 374 and 375:
MAN B&W Appendix A No. Symbol Symbo