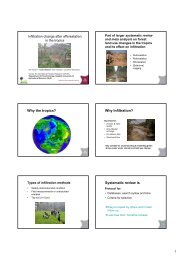
An overview of the economics of plantations in Canada
An overview of the economics of plantations in Canada
An overview of the economics of plantations in Canada

Create successful ePaper yourself
Turn your PDF publications into a flip-book with our unique Google optimized e-Paper software.
Input examples<br />
Growth rate assumptions: Hybrid poplar<br />
(MAI), m 3 /ha/year (CFS-Edmonton)<br />
list ccsuid<br />
ROI, (%) – real rate <strong>of</strong> return yield<strong>in</strong>g NPV = 0<br />
Output Metrics <strong>of</strong> Interest<br />
Break-even carbon value, ($/t CO 2-e ) – <strong>the</strong> carbon unit price yield<strong>in</strong>g NPV = 0<br />
(Carbon price is 0 when NPV is positive)<br />
Physical carbon, (t/ha) – total ecosystem carbon sequestered over a project life<br />
(m<strong>in</strong>us carbon <strong>in</strong> harvested biomass and decay emissions)<br />
USA<br />
Geographical variation <strong>of</strong> <strong>the</strong> output metrics<br />
(helps to identify economically attractive areas for afforestation)<br />
150 0 300 600 900<br />
Km<br />
O<strong>the</strong>r metrics <strong>in</strong>clude Present Values and break-even wood prices<br />
Urban areas MAI, m3/ha/year<br />
< 4<br />
4 - 6<br />
6 - 8<br />
8 - 9<br />
9 - 10<br />
10 - 11<br />
11 - 12<br />
12 - 13<br />
13 - 14<br />
14 - 15<br />
15 - 16<br />
16 - 17<br />
17 - 18<br />
18 - 19<br />
19 - 20<br />
20 - 21<br />
21 - 22<br />
22 - 23<br />
23 - 24<br />
Results: ROI<br />
Returns on <strong>in</strong>vestment, % (real rate)<br />
Afforestation scenarios (~70-75 years time horizon)<br />
“Best” Red Norway Black<br />
area, ha * p<strong>in</strong>e spruce walnut<br />
Hybrid poplar<br />
Fibre only scenario<br />
Max.value 4.6 3.6 3.7 2.8<br />
10k 4.3 3.4 3.5 2.5<br />
100k 4.1 3.3 3.3 2.3<br />
500k 3.8 3.1 2.9 2.1<br />
Fibre + carbon scenario – Carbon at $3.4/t CO2<br />
Max.value 5.2 4.3 4.1 5.1 [6.0] **<br />
10k 4.8 4.1 3.9 4.7 [5.7]<br />
100k 4.5 3.9 3.7 4.2 [5.2]<br />
500k 4.2 3.6 3.2 3.9 [4.9]<br />
* The regions with <strong>the</strong> highest NPV values<br />
** ROI from a s<strong>in</strong>gle rotation (25 years) – shown <strong>in</strong> brackets<br />
Hybrid poplar –75-year horizon (3 x 25-year rotations)<br />
O<strong>the</strong>r species – 70-year horizon (1 x 70-year rotation)<br />
150 0 300 600 900<br />
Km<br />
Int.rate <strong>of</strong> return<br />
0<br />
USA<br />
< 1%<br />
1 - 2%<br />
2 - 3%<br />
3 - 4%<br />
Results: ROI<br />
Geographical Variation<br />
Hybrid Poplar: Return on Investment (%)<br />
(fibre + carbon at $10/tonne CO 2-e )<br />
4 - 5%<br />
5 - 6%<br />
6 - 7%<br />
7 - 8%<br />
8 - 9%<br />
9 - 10%<br />
10 - 11%<br />
11 - 12%<br />
Urban areas<br />
Results: Carbon<br />
Break-even carbon price ($/t CO 2-e )<br />
and physical carbon accumulation (t/ha):<br />
“Best” Break-carbon even price, $/t CO 2-e Total ecosystem carbon, t C/ ha **<br />
area, ha * Red p<strong>in</strong>e N.spruce B.walnut H.poplar Red p<strong>in</strong>e N.spruce B.walnut H.poplar<br />
Max.value 0 *** 2.3 3.1 2.0 109 98 109 159<br />
10k 0 3.3 4.8 2.7 100 98 109 148<br />
100k 0 4.0 6.6 3.0 96 98 106 139<br />
500k 2.1 5.7 10.2 3.5 91 88 100 132<br />
* Areas with <strong>the</strong> highest NPV values<br />
** Above- and belowground ecosystem pools m<strong>in</strong>us harvested wood and biomass decay<br />
(IPCC method)<br />
*** Zero carbon price means positive NPV for a 4% discount rate<br />
Hybrid poplar –75-year horizon (3 x 25-year rotations)<br />
O<strong>the</strong>r species – 70-year horizon (1 x 70-year rotation)<br />
Conclusions<br />
• Returns from fibre approach 4% on average – not likely to <strong>in</strong>duce large<br />
scale <strong>in</strong>dustry <strong>in</strong>vestments (7-9% needed?)<br />
• Ma<strong>in</strong> challenges <strong>in</strong>clude low growth rates, high costs <strong>of</strong> land use<br />
conversion and silviculture and low value <strong>of</strong> fibre<br />
• Some native species (Red p<strong>in</strong>e) have better economic potential than<br />
hybrid poplar <strong>in</strong> selected regions (Ontario)<br />
• Carbon <strong>in</strong>centives boost ROI, however <strong>the</strong> effect is highly dependent on<br />
<strong>the</strong> carbon price assumptions:<br />
- 0.7-2% ROI <strong>in</strong>crease for current N. American carbon prices (CCX)<br />
- 3-4% <strong>in</strong>crease assum<strong>in</strong>g $10/t CO 2-e price expectations<br />
• O<strong>the</strong>r benefits may be required to improve a competitiveness <strong>of</strong><br />
afforestation projects and achieve <strong>in</strong>dustry-level rates <strong>of</strong> return<br />
2