An overview of the economics of plantations in Canada
An overview of the economics of plantations in Canada
An overview of the economics of plantations in Canada

Create successful ePaper yourself
Turn your PDF publications into a flip-book with our unique Google optimized e-Paper software.
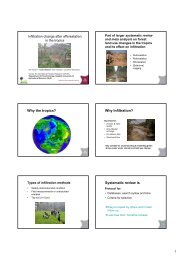
Background<br />
AN OVERVIEW OF THE ECONOMICS<br />
OF PLANTATIONS IN CANADA<br />
Dan McKenney 1 , Denys Yemshanov 1 , and Terry Hatton 2<br />
Canadian Forest Service,<br />
1 Great Lakes Forestry Centre, Sault Ste. Marie, ON<br />
2 Industry and Economics Branch, Ottawa, ON, <strong>Canada</strong><br />
• Plantation establishment is driven by a mix <strong>of</strong> objectives,<br />
watershed protection, fibre production and site rehabilitation.<br />
• Carbon markets change <strong>the</strong> decision calculus!<br />
• With ris<strong>in</strong>g energy costs <strong>the</strong>re is a need to (re)assess <strong>the</strong><br />
<strong>in</strong>vestment potential <strong>of</strong> <strong>plantations</strong><br />
• A 3-year Federal “Forest-2020” program was established to<br />
help assess afforestation strategies – i.e. <strong>plantations</strong> on<br />
agricultural land<br />
• This talk : F2020, Data needs, Economic model, Results<br />
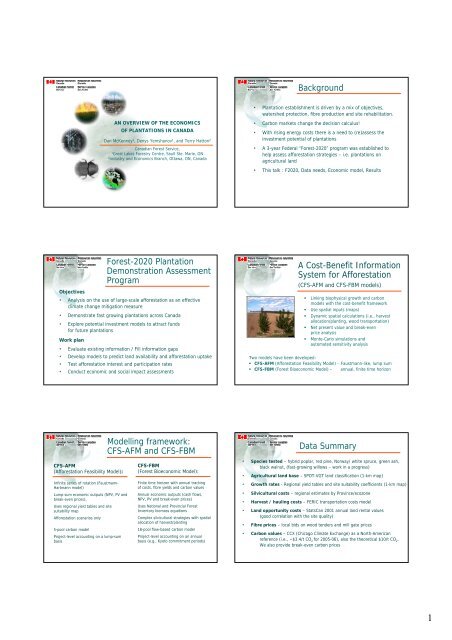
Forest-2020 Plantation<br />
Demonstration Assessment<br />
Program<br />
Objectives<br />
• <strong>An</strong>alysis on <strong>the</strong> use <strong>of</strong> large-scale afforestation as an effective<br />
climate change mitigation measure<br />
• Demonstrate fast grow<strong>in</strong>g <strong>plantations</strong> across <strong>Canada</strong><br />
• Explore potential <strong>in</strong>vestment models to attract funds<br />
for future <strong>plantations</strong><br />
Work plan<br />
• Evaluate exist<strong>in</strong>g <strong>in</strong>formation / Fill <strong>in</strong>formation gaps<br />
• Develop models to predict land availability and afforestation uptake<br />
• Test afforestation <strong>in</strong>terest and participation rates<br />
• Conduct economic and social impact assessments<br />
A Cost-Benefit Information<br />
System for Afforestation<br />
(CFS-AFM and CFS-FBM models)<br />
• L<strong>in</strong>k<strong>in</strong>g biophysical growth and carbon<br />
models with <strong>the</strong> cost-benefit framework<br />
• Use spatial <strong>in</strong>puts (maps)<br />
• Dynamic spatial calculations (i.e., harvest<br />
allocation/plant<strong>in</strong>g, wood transportation)<br />
• Net present value and break-even<br />
price analysis<br />
• Monte-Carlo simulations and<br />
automated sensitivity analysis<br />
Two models have been developed:<br />
• CFS-AFM (Afforestation Feasibility Model) – Faustmann-like, lump sum<br />
• CFS-FBM (Forest Bioeconomic Model) – annual, f<strong>in</strong>ite time horizon<br />
CFS-AFM<br />
(Afforestation Feasibility Model):<br />
Inf<strong>in</strong>ite series <strong>of</strong> rotation (Faustmann-<br />
Hartmann model)<br />
Lump-sum economic outputs (NPV, PV and<br />
break-even prices),<br />
Uses regional yield tables and site<br />
suitability map<br />
Afforestation scenarios only<br />
5-pool carbon model<br />
Project-level account<strong>in</strong>g on a lump-sum<br />
basis<br />
Modell<strong>in</strong>g framework:<br />
CFS-AFM and CFS-FBM<br />
CFS-FBM<br />
(Forest Bioeconomic Model):<br />
F<strong>in</strong>ite time horizon with annual track<strong>in</strong>g<br />
<strong>of</strong> costs, fibre yields and carbon values<br />
<strong>An</strong>nual economic outputs (cash flows,<br />
NPV, PV and break-even prices)<br />
Uses National and Prov<strong>in</strong>cial Forest<br />
Inventory biomass equations<br />
Complex silvicultural strategies with spatial<br />
allocation <strong>of</strong> harvest/plant<strong>in</strong>g<br />
18-pool flow-based carbon model<br />
Project-level account<strong>in</strong>g on an annual<br />
basis (e.g., Kyoto commitment periods)<br />
Data Summary<br />
• Species tested – hybrid poplar, red p<strong>in</strong>e, Norway/ white spruce, green ash,<br />
black walnut, (fast-grow<strong>in</strong>g willows – work <strong>in</strong> a progress)<br />
• Agricultural land base – SPOT-VGT land classification (1-km map)<br />
• Growth rates - Regional yield tables and site suitability coefficients (1-km map)<br />
• Silvicultural costs – regional estimates by Prov<strong>in</strong>ce/ecozone<br />
• Harvest / haul<strong>in</strong>g costs – FERIC transportation costs model<br />
• Land opportunity costs – StatsCan 2001 annual land rental values<br />
(good correlation with <strong>the</strong> site quality)<br />
• Fibre prices – local bids on wood tenders and mill gate prices<br />
• Carbon values – CCX (Chicago Climate Exchange) as a North-American<br />
reference (i.e., ~$3.4/t CO 2 for 2005-06), also <strong>the</strong> <strong>the</strong>oretical $10/t CO 2 .<br />
We also provide break-even carbon prices<br />
1
Input examples<br />
Growth rate assumptions: Hybrid poplar<br />
(MAI), m 3 /ha/year (CFS-Edmonton)<br />
list ccsuid<br />
ROI, (%) – real rate <strong>of</strong> return yield<strong>in</strong>g NPV = 0<br />
Output Metrics <strong>of</strong> Interest<br />
Break-even carbon value, ($/t CO 2-e ) – <strong>the</strong> carbon unit price yield<strong>in</strong>g NPV = 0<br />
(Carbon price is 0 when NPV is positive)<br />
Physical carbon, (t/ha) – total ecosystem carbon sequestered over a project life<br />
(m<strong>in</strong>us carbon <strong>in</strong> harvested biomass and decay emissions)<br />
USA<br />
Geographical variation <strong>of</strong> <strong>the</strong> output metrics<br />
(helps to identify economically attractive areas for afforestation)<br />
150 0 300 600 900<br />
Km<br />
O<strong>the</strong>r metrics <strong>in</strong>clude Present Values and break-even wood prices<br />
Urban areas MAI, m3/ha/year<br />
< 4<br />
4 - 6<br />
6 - 8<br />
8 - 9<br />
9 - 10<br />
10 - 11<br />
11 - 12<br />
12 - 13<br />
13 - 14<br />
14 - 15<br />
15 - 16<br />
16 - 17<br />
17 - 18<br />
18 - 19<br />
19 - 20<br />
20 - 21<br />
21 - 22<br />
22 - 23<br />
23 - 24<br />
Results: ROI<br />
Returns on <strong>in</strong>vestment, % (real rate)<br />
Afforestation scenarios (~70-75 years time horizon)<br />
“Best” Red Norway Black<br />
area, ha * p<strong>in</strong>e spruce walnut<br />
Hybrid poplar<br />
Fibre only scenario<br />
Max.value 4.6 3.6 3.7 2.8<br />
10k 4.3 3.4 3.5 2.5<br />
100k 4.1 3.3 3.3 2.3<br />
500k 3.8 3.1 2.9 2.1<br />
Fibre + carbon scenario – Carbon at $3.4/t CO2<br />
Max.value 5.2 4.3 4.1 5.1 [6.0] **<br />
10k 4.8 4.1 3.9 4.7 [5.7]<br />
100k 4.5 3.9 3.7 4.2 [5.2]<br />
500k 4.2 3.6 3.2 3.9 [4.9]<br />
* The regions with <strong>the</strong> highest NPV values<br />
** ROI from a s<strong>in</strong>gle rotation (25 years) – shown <strong>in</strong> brackets<br />
Hybrid poplar –75-year horizon (3 x 25-year rotations)<br />
O<strong>the</strong>r species – 70-year horizon (1 x 70-year rotation)<br />
150 0 300 600 900<br />
Km<br />
Int.rate <strong>of</strong> return<br />
0<br />
USA<br />
< 1%<br />
1 - 2%<br />
2 - 3%<br />
3 - 4%<br />
Results: ROI<br />
Geographical Variation<br />
Hybrid Poplar: Return on Investment (%)<br />
(fibre + carbon at $10/tonne CO 2-e )<br />
4 - 5%<br />
5 - 6%<br />
6 - 7%<br />
7 - 8%<br />
8 - 9%<br />
9 - 10%<br />
10 - 11%<br />
11 - 12%<br />
Urban areas<br />
Results: Carbon<br />
Break-even carbon price ($/t CO 2-e )<br />
and physical carbon accumulation (t/ha):<br />
“Best” Break-carbon even price, $/t CO 2-e Total ecosystem carbon, t C/ ha **<br />
area, ha * Red p<strong>in</strong>e N.spruce B.walnut H.poplar Red p<strong>in</strong>e N.spruce B.walnut H.poplar<br />
Max.value 0 *** 2.3 3.1 2.0 109 98 109 159<br />
10k 0 3.3 4.8 2.7 100 98 109 148<br />
100k 0 4.0 6.6 3.0 96 98 106 139<br />
500k 2.1 5.7 10.2 3.5 91 88 100 132<br />
* Areas with <strong>the</strong> highest NPV values<br />
** Above- and belowground ecosystem pools m<strong>in</strong>us harvested wood and biomass decay<br />
(IPCC method)<br />
*** Zero carbon price means positive NPV for a 4% discount rate<br />
Hybrid poplar –75-year horizon (3 x 25-year rotations)<br />
O<strong>the</strong>r species – 70-year horizon (1 x 70-year rotation)<br />
Conclusions<br />
• Returns from fibre approach 4% on average – not likely to <strong>in</strong>duce large<br />
scale <strong>in</strong>dustry <strong>in</strong>vestments (7-9% needed?)<br />
• Ma<strong>in</strong> challenges <strong>in</strong>clude low growth rates, high costs <strong>of</strong> land use<br />
conversion and silviculture and low value <strong>of</strong> fibre<br />
• Some native species (Red p<strong>in</strong>e) have better economic potential than<br />
hybrid poplar <strong>in</strong> selected regions (Ontario)<br />
• Carbon <strong>in</strong>centives boost ROI, however <strong>the</strong> effect is highly dependent on<br />
<strong>the</strong> carbon price assumptions:<br />
- 0.7-2% ROI <strong>in</strong>crease for current N. American carbon prices (CCX)<br />
- 3-4% <strong>in</strong>crease assum<strong>in</strong>g $10/t CO 2-e price expectations<br />
• O<strong>the</strong>r benefits may be required to improve a competitiveness <strong>of</strong><br />
afforestation projects and achieve <strong>in</strong>dustry-level rates <strong>of</strong> return<br />
2
Forest-2020 PDA<br />
web page:<br />
http://www.nrcan.gc.ca/cfs/national/what-quoi/afforestation/<strong>economics</strong>_e.html<br />
http://www.nrcan.gc.ca/cfs/national/what-quoi/afforestation/f2020_e.html<br />
3