International journal of Contemporary Business Studies
International journal of Contemporary Business Studies
International journal of Contemporary Business Studies

Create successful ePaper yourself
Turn your PDF publications into a flip-book with our unique Google optimized e-Paper software.
<strong>International</strong> Journal <strong>of</strong> <strong>Contemporary</strong> <strong>Business</strong> <strong>Studies</strong><br />
Vol: 3, No: 6. June, 2012 ISSN 2156-7506<br />
Available online at http://www.akpinsight.webs.com<br />
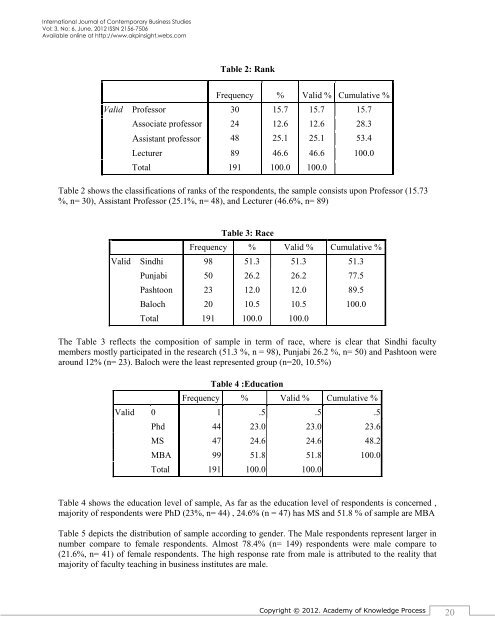
Table 2: Rank<br />
Frequency % Valid % Cumulative %<br />
Valid Pr<strong>of</strong>essor 30 15.7 15.7 15.7<br />
Associate pr<strong>of</strong>essor 24 12.6 12.6 28.3<br />
Assistant pr<strong>of</strong>essor 48 25.1 25.1 53.4<br />
Lecturer 89 46.6 46.6 100.0<br />
Total 191 100.0 100.0<br />
Table 2 shows the classifications <strong>of</strong> ranks <strong>of</strong> the respondents, the sample consists upon Pr<strong>of</strong>essor (15.73<br />
%, n= 30), Assistant Pr<strong>of</strong>essor (25.1%, n= 48), and Lecturer (46.6%, n= 89)<br />
Table 3: Race<br />
Frequency % Valid % Cumulative %<br />
Valid Sindhi 98 51.3 51.3 51.3<br />
Punjabi 50 26.2 26.2 77.5<br />
Pashtoon 23 12.0 12.0 89.5<br />
Baloch 20 10.5 10.5 100.0<br />
Total 191 100.0 100.0<br />
The Table 3 reflects the composition <strong>of</strong> sample in term <strong>of</strong> race, where is clear that Sindhi faculty<br />
members mostly participated in the research (51.3 %, n = 98), Punjabi 26.2 %, n= 50) and Pashtoon were<br />
around 12% (n= 23). Baloch were the least represented group (n=20, 10.5%)<br />
Table 4 :Education<br />
Frequency % Valid % Cumulative %<br />
Valid 0 1 .5 .5 .5<br />
Phd 44 23.0 23.0 23.6<br />
MS 47 24.6 24.6 48.2<br />
MBA 99 51.8 51.8 100.0<br />
Total 191 100.0 100.0<br />
Table 4 shows the education level <strong>of</strong> sample, As far as the education level <strong>of</strong> respondents is concerned ,<br />
majority <strong>of</strong> respondents were PhD (23%, n= 44) , 24.6% (n = 47) has MS and 51.8 % <strong>of</strong> sample are MBA<br />
Table 5 depicts the distribution <strong>of</strong> sample according to gender. The Male respondents represent larger in<br />
number compare to female respondents. Almost 78.4% (n= 149) respondents were male compare to<br />
(21.6%, n= 41) <strong>of</strong> female respondents. The high response rate from male is attributed to the reality that<br />
majority <strong>of</strong> faculty teaching in business institutes are male.<br />
Copyright © 2012. Academy <strong>of</strong> Knowledge Process<br />
20