FEMLAB - KTH
FEMLAB - KTH
FEMLAB - KTH

You also want an ePaper? Increase the reach of your titles
YUMPU automatically turns print PDFs into web optimized ePapers that Google loves.
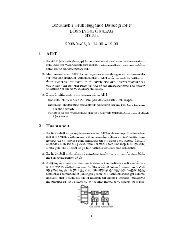
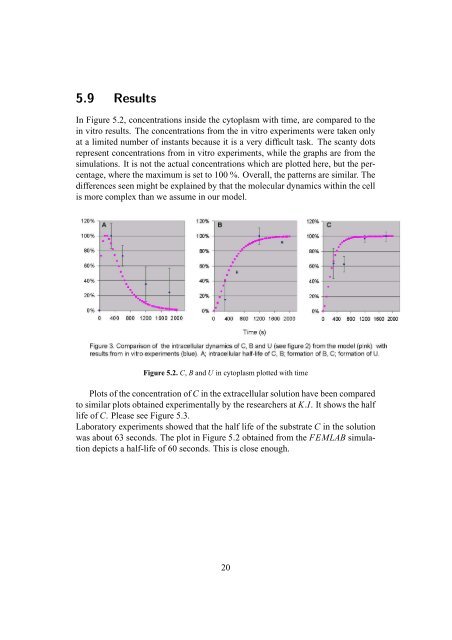
5.9 Results<br />
In Figure 5.2, concentrations inside the cytoplasm with time, are compared to the<br />
in vitro results. The concentrations from the in vitro experiments were taken only<br />
at a limited number of instants because it is a very difficult task. The scanty dots<br />
represent concentrations from in vitro experiments, while the graphs are from the<br />
simulations. It is not the actual concentrations which are plotted here, but the percentage,<br />
where the maximum is set to 100 %. Overall, the patterns are similar. The<br />
differences seen might be explained by that the molecular dynamics within the cell<br />
is more complex than we assume in our model.<br />
Figure 5.2. C, B and U in cytoplasm plotted with time<br />
Plots of the concentration of C in the extracellular solution have been compared<br />
to similar plots obtained experimentally by the researchers at K.I. It shows the half<br />
life of C. Please see Figure 5.3.<br />
Laboratory experiments showed that the half life of the substrate C in the solution<br />
was about 63 seconds. The plot in Figure 5.2 obtained from the <strong>FEMLAB</strong> simulation<br />
depicts a half-life of 60 seconds. This is close enough.<br />
20