espectively, Table 1). In terms <strong>of</strong> compressive strength, M1-M5 had similar or greater strength as that <strong>of</strong> Portland cement based mix, with values reaching as much as 39.3 MPa (M2). All matrices except for M4 and M5, which had high air content, presented higher chloride ion penetration resistance (
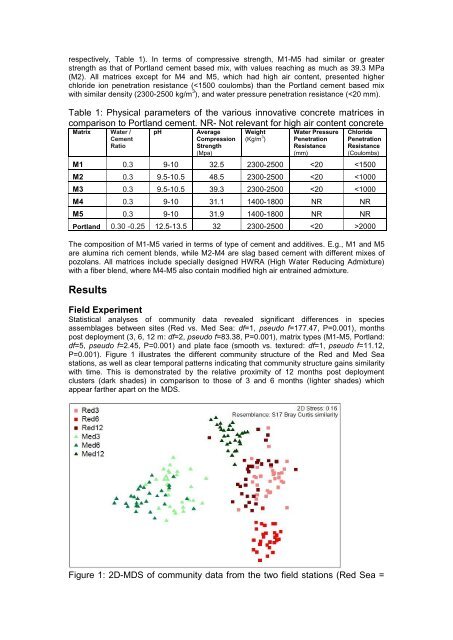
squares <strong>of</strong> red shades; Med Sea = triangles <strong>of</strong> green shades) 3, 6 and 12 months post deployment. Each point represents one tile (tile faces pooled). The taxa composition recruited to the different concrete matrices also varied among sites and with time (significant Site x Matrix interaction term: df=5, pseudo f=1.50, P=0.049 and Month x Matrix: df=10, pseudo f=1.37, P=0.037). Yet the general trend indicated that tiles composed <strong>of</strong> Portland cement clustered separately from the other concrete matrices (MI-5), as seen in Figure 2. The level <strong>of</strong> similarity amongst the various matrices varied with time and between sites. Figure 2: 2D-MDS <strong>of</strong> typical community data. Each point represents one tile (faces pooled). Example from Red Sea, 6 month post deployment, showing the various innovative concrete matrices (M1-5 colour coded) at the right side <strong>of</strong> the plot, while Portland cement tiles (grey) clustered at the left. Analyses <strong>of</strong> percent live cover (Fig. 3) supported the results <strong>of</strong> the multivariate community data analyses, revealing that live cover differed between sites (df=1, pseudo f=6.77, P=0.009), months (df=2, pseudo f=133.36, P=0.001), Tile Face (df=1, pseudo f=20.58, P=0.001) and Matrices (df=5, pseudo f=27.57, P=0.001). The trend in percent cover <strong>of</strong> the various matrices was consistent among sites, but did change with time and in relation to tile face (significant interaction terms: Month x Matrix, df=10, pseudo f=4.64, P=0.001 and Month x Face, df=2, pseudo f=9.00, P=0.001). Pair-wise comparisons show that as early as 3 months post deployment, Portland cement tiles had lower live cover compared to the other matrices, mainly, MI, M4 and M5 who recruited the highest percent live cover. Figure 3: Comparison <strong>of</strong> percent live cover 3, 6 and 12 months post deployment on various innovative concrete matrices (M1-5) in comparison to