Ecologically Active - Institution of Civil Engineers
Ecologically Active - Institution of Civil Engineers
Ecologically Active - Institution of Civil Engineers

Create successful ePaper yourself
Turn your PDF publications into a flip-book with our unique Google optimized e-Paper software.
Portland cement. A) Red Sea, B) Med Sea. Solid line represents Smooth tile<br />
face while dotted line represents the Textured face.<br />
When examining trends related to surface complexity, it is evident that while in the Red Sea<br />
differences between smooth and textured tile face were consistent with time, in the Med Sea,<br />
difference between plate faces was significant initially (3 month), yet non-significant 6 and 12<br />
months post deployment. These results are in agreement with the multivariate community<br />
data analyses from the red sea, clearly indicating that overall, complex surface texture, as<br />
opposed to smooth, recruited more diverse and dense benthic assemblage (Figure 4).<br />
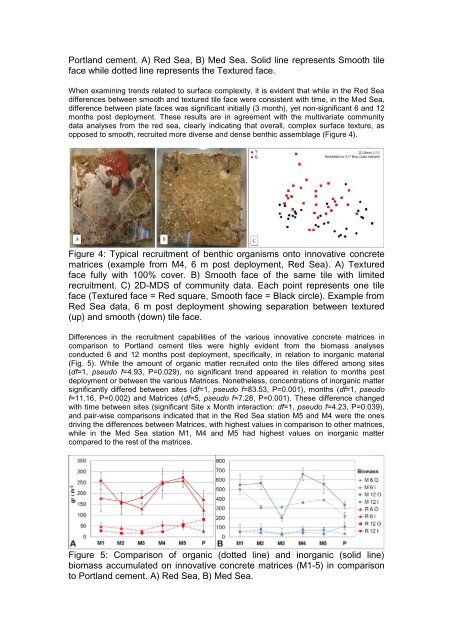
Figure 4: Typical recruitment <strong>of</strong> benthic organisms onto innovative concrete<br />
matrices (example from M4, 6 m post deployment, Red Sea). A) Textured<br />
face fully with 100% cover. B) Smooth face <strong>of</strong> the same tile with limited<br />
recruitment. C) 2D-MDS <strong>of</strong> community data. Each point represents one tile<br />
face (Textured face = Red square, Smooth face = Black circle). Example from<br />
Red Sea data, 6 m post deployment showing separation between textured<br />
(up) and smooth (down) tile face.<br />
Differences in the recruitment capabilities <strong>of</strong> the various innovative concrete matrices in<br />
comparison to Portland cement tiles were highly evident from the biomass analyses<br />
conducted 6 and 12 months post deployment, specifically, in relation to inorganic material<br />
(Fig. 5). While the amount <strong>of</strong> organic matter recruited onto the tiles differed among sites<br />
(df=1, pseudo f=4.93, P=0.029), no significant trend appeared in relation to months post<br />
deployment or between the various Matrices. Nonetheless, concentrations <strong>of</strong> inorganic matter<br />
significantly differed between sites (df=1, pseudo f=83.53, P=0.001), months (df=1, pseudo<br />
f=11.16, P=0.002) and Matrices (df=5, pseudo f=7.28, P=0.001). These difference changed<br />
with time between sites (significant Site x Month interaction: df=1, pseudo f=4.23, P=0.039),<br />
and pair-wise comparisons indicated that in the Red Sea station M5 and M4 were the ones<br />
driving the differences between Matrices, with highest values in comparison to other matrices,<br />
while in the Med Sea station M1, M4 and M5 had highest values on inorganic matter<br />
compared to the rest <strong>of</strong> the matrices.<br />
Figure 5: Comparison <strong>of</strong> organic (dotted line) and inorganic (solid line)<br />
biomass accumulated on innovative concrete matrices (M1-5) in comparison<br />
to Portland cement. A) Red Sea, B) Med Sea.