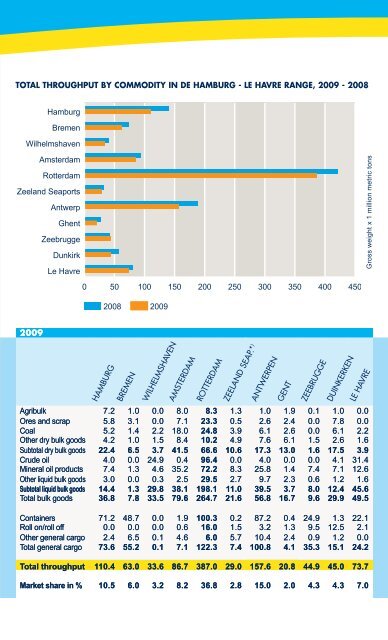
totAL tHRoUGHpUt BY CoMMoDItY IN DE HAMBURG - LE HAVRE RANGE, 2009 - 2008 Gross weight x 1 million metric tons 2009 Agribulk 7.2 1.0 0.0 8.0 8.3 1.3 1.0 1.9 0.1 1.0 0.0 Ores and scrap 5.8 3.1 0.0 7.1 23.3 0.5 2.6 2.4 0.0 7.8 0.0 Coal 5.2 1.4 2.2 18.0 24.8 3.9 6.1 2.6 0.0 6.1 2.2 Other dry bulk goods 4.2 1.0 1.5 8.4 10.2 4.9 7.6 6.1 1.5 2.6 1.6 Subtotal dry bulk goods 22.4 6.5 3.7 41.5 66.6 10.6 17.3 13.0 1.6 17.5 3.9 Crude oil 4.0 0.0 24.9 0.4 96.4 0.0 4.0 0.0 0.0 4.1 31.4 Mineral oil products 7.4 1.3 4.6 35.2 72.2 8.3 25.8 1.4 7.4 7.1 12.6 Other liquid bulk goods 3.0 0.0 0.3 2.5 29.5 2.7 9.7 2.3 0.6 1.2 1.6 Subtotal liquid bulk goods 14.4 1.3 29.8 38.1 198.1 11.0 39.5 3.7 8.0 12.4 45.6 Total bulk goods 36.8 7.8 33.5 79.6 264.7 21.6 56.8 16.7 9.6 29.9 49.5 Containers 71.2 48.7 0.0 1.9 100.3 0.2 87.2 0.4 24.9 1.3 22.1 Roll on/roll <strong>of</strong>f 0.0 0.0 0.0 0.6 16.0 1.5 3.2 1.3 9.5 12.5 2.1 Other general cargo 2.4 6.5 0.1 4.6 6.0 5.7 10.4 2.4 0.9 1.2 0.0 Total general cargo 73.6 55.2 0.1 7.1 122.3 7.4 100.8 4.1 35.3 15.1 24.2 Total throughput 110.4 63.0 33.6 86.7 387.0 29.0 157.6 20.8 44.9 45.0 73.7 Market share in % 10.5 6.0 3.2 8.2 36.8 2.8 15.0 2.0 4.3 4.3 7.0 2008 HAMBURG BREMEN WILHELMSHAVEN AMSTERDAM ROTTERDAM ZEELAND SEAP.* ) GENT ANTWERPEN ZEEBRUGGE DUINKERKEN LE HAVRE HAVEN M M SEAP.* ) EN E EN
2008 HAMBURG BREMEN WILHELMSHAVEN AMSTERDAM ROTTERDAM ZEELAND SEAP.* ) ANTWERPEN ZEEBRUGGE DUINKERKEN Agribulk 6.5 0.8 0.0 8.7 10.4 1.0 1.0 2.6 0.0 1.1 0.1 Ores and scrap 10.0 3.9 0.0 10.4 44.0 1.1 7.5 4.4 0.0 13.0 0.0 Coal 5.2 1.8 2.2 22.2 28.6 4.4 9.9 4.2 0.0 9.7 2.5 Other dry bulk goods 5.0 1.6 1.7 9.4 12.0 5.7 9.0 6.8 1.8 3.0 2.1 Subtotal dry bulk goods 26.7 8.1 3.9 50.7 95.0 12.2 27.4 18.0 1.9 26.8 4.7 Crude oil 4.9 0.0 28.2 0.0 100.4 0.0 4.5 0.0 0.0 5.8 34.6 Mineral oil products 8.1 1.7 7.7 30.7 58.6 7.9 25.0 1.3 5.9 7.7 13.0 Other bulk goods 2.7 0.0 0.5 3.1 35.0 3.1 9.8 2.6 0.3 1.4 1.4 Subtotal liquid bulk goods 15.7 1.7 36.3 33.8 194.0 11.0 39.3 3.8 6.2 14.9 49.1 Total bulk goods 42.4 9.8 40.2 84.5 289.0 23.2 66.7 21.8 8.1 41.7 53.8 Containers 95.1 55.1 0.0 3.9 107.0 0.2 101.4 0.4 21.2 1.7 24.8 Roll on/roll <strong>of</strong>f 0.0 0.0 0.0 1.1 17.9 2.3 4.4 1.7 11.8 12.7 1.9 Other general cargo 2.9 9.7 0.0 5.2 7.3 7.6 16.9 3.1 0.9 1.6 0.0 Total general cargo 98.0 64.8 0.0 10.2 132.2 10.1 122.7 5.2 33.9 16.0 26.7 Total throughput 140.4 74.6 40.2 94.7 421.1 33.3 189.4 27.0 42.0 57.7 80.5 Market share in % 11.7 6.2 3.3 7.9 35.1 2.8 15.8 2.2 3.5 4.8 6.7 Unit : Gross weight x 1 million metric tons Source : Other <strong>Port</strong> Authorities Hamburg and Bremen other general cargo including roll on/roll <strong>of</strong>f Le Havre: general cargo including roll-on/roll-<strong>of</strong>f; Zeebrugge including bunkermaterials * ) Zeeland Seaports breakdown <strong>of</strong> goods estimated GENT LE HAVRE INCoMING AND oUtGoING CARGo GRoUpED BY oRIGIN AND DEStINAtIoN, 2008 - 2007 Sea 2008 2007 Incoming outgoing total Incoming outgoing total Europe 125,932 53,578 179,510 128,740 53,710 182,450 United Kingdom 30,428 21,513 51,941 31,270 22,205 53,475 Norway 17,470 1,846 19,316 18,250 1,550 19,800 Russia 40,616 3,038 43,654 41,430 2,750 44,180 Others 37,418 27,181 64,599 37,790 27,205 64,995 Africa 46,535 4,434 50,969 47,425 4,360 51,785 Egypt * ) 13,536 606 14,142 19,470 450 19,920 South Africa 15,744 751 16,495 14,110 795 14,905 Others 17,255 3,077 20,332 13,845 3,115 16,960 America 76,803 14,792 91,595 68,805 15,370 84,175 U.S. <strong>of</strong> America 14,991 9,105 24,096 12,580 8,395 20,975 Brazil 35,984 1,647 37,631 31,735 1,750 33,485 Others 25,828 4,040 29,868 24,490 5,225 29,715 Asia 49,251 29,620 78,871 41,690 30,275 71,965 China 12,884 8,844 21,728 13,300 8,025 21,325 Singapore 3,859 8,187 12,046 3,640 9,335 12,975 Others 32,508 12,589 45,097 24,750 12,915 37,665 Oceania 9,430 415 9,845 9,090 345 9,435 Australia 9,207 280 9,487 8,955 210 9,165 Others 223 135 358 135 135 270 Others 181 1 182 1,365 5 1,370 Total 308,132 102,840 410,972 297,115 104,065 401,180 Unit : Gross weight x 1,000 metric tons, excluding Vlaardingen and Schiedam * ) Crude oil by pipeline from Saudi Arabia Source : CBS