Carbon Capture & Storage Factbook - Schlumberger Business ...
Carbon Capture & Storage Factbook - Schlumberger Business ...
Carbon Capture & Storage Factbook - Schlumberger Business ...

You also want an ePaper? Increase the reach of your titles
YUMPU automatically turns print PDFs into web optimized ePapers that Google loves.
PROJECTS ‒ INVESTMENTS AND KEY PLAYERS<br />
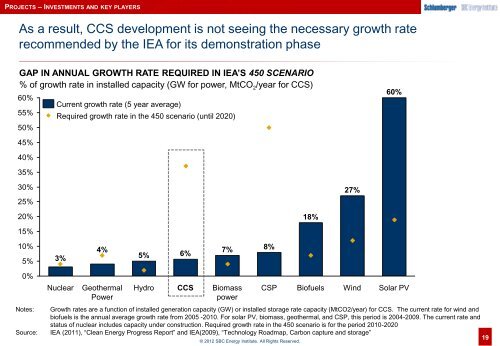
As a result, CCS development is not seeing the necessary growth rate<br />
recommended by the IEA for its demonstration phase<br />
GAP IN ANNUAL GROWTH RATE REQUIRED IN IEA‟S 450 SCENARIO<br />
% of growth rate in installed capacity (GW for power, MtCO 2 /year for CCS)<br />
60%<br />
55%<br />
50%<br />
Current growth rate (5 year average)<br />
Required growth rate in the 450 scenario (until 2020)<br />
60%<br />
45%<br />
40%<br />
35%<br />
30%<br />
25%<br />
27%<br />
20%<br />
15%<br />
18%<br />
10%<br />
5%<br />
3%<br />
4%<br />
5%<br />
6%<br />
7%<br />
8%<br />
0%<br />
Notes:<br />
Source:<br />
Nuclear<br />
Geothermal<br />
Power<br />
Hydro<br />
CCS<br />
Biomass<br />
power<br />
CSP<br />
Growth rates are a function of installed generation capacity (GW) or installed storage rate capacity (MtCO2/year) for CCS. The current rate for wind and<br />
biofuels is the annual average growth rate from 2005 -2010. For solar PV, biomass, geothermal, and CSP, this period is 2004-2009. The current rate and<br />
status of nuclear includes capacity under construction. Required growth rate in the 450 scenario is for the period 2010-2020<br />
IEA (2011), “Clean Energy Progress Report” and IEA(2009), “Technology Roadmap, <strong>Carbon</strong> capture and storage”<br />
© 2012 SBC Energy Institute. All Rights Reserved.<br />
Biofuels<br />
Wind<br />
Solar PV<br />
19