Modified Fisher's Linear Discriminant Analysis for ... - IEEE Xplore
Modified Fisher's Linear Discriminant Analysis for ... - IEEE Xplore
Modified Fisher's Linear Discriminant Analysis for ... - IEEE Xplore

Create successful ePaper yourself
Turn your PDF publications into a flip-book with our unique Google optimized e-Paper software.
506 <strong>IEEE</strong> GEOSCIENCE AND REMOTE SENSING LETTERS, VOL. 4, NO. 4, OCTOBER 2007<br />
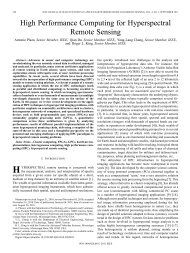
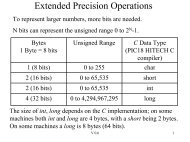
Fig. 4. AVIRIS Cuprite image scene. (a) Spectral band image. (b) Spatial<br />
locations of five pure pixels corresponding to the following minerals: alunite<br />
(A), buddingtonite (B), calcite (C), kaolinite (K), and muscovite (M).<br />
Fig. 3.<br />
ROC curves in the HYDICE <strong>for</strong> the test set.<br />
TABLE I<br />
(LARGEST)NUMBER OF DETECTED PIXELS (N D ) IN THE<br />
TEST SET WHEN NO FALSE ALARM EXISTS (N F =0)<br />
TABLE II<br />
(SMALLEST)NUMBER OF FALSE ALARM PIXELS (N F ) WHEN<br />
ALL PIXELS IN THE TEST SET ARE DETECTED (N D = 28)<br />
test set were detected, whereas TCIMF using the original data<br />
detected 19 pixels. By slightly decreasing the threshold, all the<br />
28 pixels could be detected although the false alarm was not<br />
zero any more. Table II lists the smallest N F when all the<br />
28 panel pixels in the test set were still detected, corresponding<br />
to η =0.5 <strong>for</strong> MFLDA and η =0.2 <strong>for</strong> TCIMF. In this case,<br />
N F = 150 from MFLDA, which is much smaller than 6952<br />
from TCIMF.<br />
B. AVIRIS Experiment<br />
To compare the four LDA techniques, the Airborne Visible/<br />
Infrared Imaging Spectrometer (AVIRIS) Cuprite scene as<br />
shown in Fig. 4 was used, which is well understood mineralogically<br />
[5]. At least five minerals were present, namely:<br />
1) alunite (A), 2) buddingtonite (B), 3) calcite (C), 4) kaolinite<br />
(K), and 5) muscovite (M). The approximate spatial locations<br />
of these minerals are marked in Fig. 4(b). However, no pixel<br />
level ground truth is available. Due to the scene complexity, the<br />
actual number of classes p T is much greater than five.<br />
To compare the per<strong>for</strong>mance of FLDA, MFLDA, CFLDA,<br />
and CLDA, SAM and TCIMF were applied to the original<br />
and trans<strong>for</strong>med data. To conduct FLDA and CFLDA, training<br />
samples were generated by comparing with the five material<br />
endmembers using SAM, and the number of training samples<br />
<strong>for</strong> the five classes were 63, 59, 69, 72, and 63, respectively.<br />
As shown in Fig. 5(a), with the original data, SAM could not<br />
classify these five minerals, but TCIMF provided accurate result<br />
as shown in Fig. 5(b). Fig. 5(c) and (d) shows the SAM and<br />
TCIMF results using the 4-D FLDA-trans<strong>for</strong>med data, respectively,<br />
where the SAM result was slightly improved but the classification<br />
result was still incorrect and the TCIMF result was<br />
much worse than that in Fig. 5(b) when the original data were<br />
used. If SAM was applied to the 4-D MFLDA-trans<strong>for</strong>med<br />
data, the classification was improved as in Fig. 5(e), and the<br />
TCIMF result in Fig. 5(f) was as good as in Fig. 5(b) using the<br />
189-band data. The CFLDA on the 189-band original data was<br />
shown in Fig. 5(g), which included a lot of misclassifications<br />
due to the use of S W that was estimated under the assumption<br />
that only five classes were present. The CLDA on the original<br />
data in Fig. 5(h) did as well as the TCIMF in Fig. 5(b) since<br />
the matrices R and Σ in the operators have the same role on<br />
background suppression.<br />
To per<strong>for</strong>m quantitative comparison, Table III lists the spatial<br />
correlation coefficients between the result from the use of LDAtrans<strong>for</strong>med<br />
data and that from the TCIMF on the original<br />
data, where a value closer to one is associated with better<br />
classification. It is obvious that MFLDA outper<strong>for</strong>ms FLDA<br />
and CFLDA, and it per<strong>for</strong>ms comparably to CLDA but on the<br />
data with much lower dimensionality. This means Σ is a better<br />
term than S W when the actual number of classes and their<br />
in<strong>for</strong>mation are difficult or even impossible to obtain.<br />
V. C ONCLUSION<br />
The original FLDA is modified <strong>for</strong> hyperspectral image<br />
dimension reduction when enough class training samples are<br />
unavailable. This situation comes from the existence of mixed