Kent Thameside Development of the Transport Strategy - Dartford ...
Kent Thameside Development of the Transport Strategy - Dartford ...
Kent Thameside Development of the Transport Strategy - Dartford ...

Create successful ePaper yourself
Turn your PDF publications into a flip-book with our unique Google optimized e-Paper software.
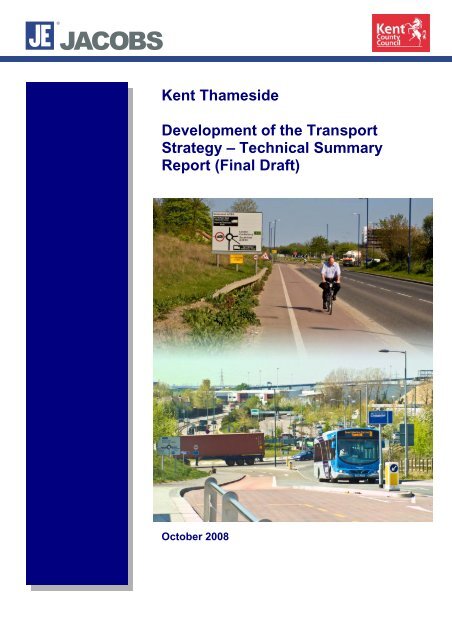
<strong>Kent</strong> <strong>Thameside</strong><br />
<strong>Development</strong> <strong>of</strong> <strong>the</strong> <strong>Transport</strong><br />
<strong>Strategy</strong> – Technical Summary<br />
Report (Final Draft)<br />
October 2008
Document control sheet<br />
Client: <strong>Kent</strong> County Council<br />
Project: KTS <strong>Transport</strong> Study Job No: B061200<br />
Title: <strong>Development</strong> <strong>of</strong> <strong>the</strong> <strong>Transport</strong> <strong>Strategy</strong> – Technical Summary (Final Draft)<br />
Prepared by Reviewed by Approved by<br />
ORIGINAL<br />
NAME NAME NAME<br />
Roger Ferreira Barbara Sim Roger Ferreira<br />
DATE SIGNATURE SIGNATURE SIGNATURE<br />
21 February<br />
2008<br />
REVISION<br />
NAME NAME NAME<br />
Roger Ferreira Jonathan Whittaker Roger Ferreira<br />
DATE SIGNATURE SIGNATURE SIGNATURE<br />
28 May 2008<br />
REVISION<br />
NAME NAME NAME<br />
Roger Ferreira Jonathan Whittaker Roger Ferreira<br />
DATE SIGNATURE SIGNATURE SIGNATURE<br />
6 June 2008<br />
REVISION<br />
NAME NAME NAME<br />
Roger Ferreira Tim Waller-Davies Roger Ferreira<br />
DATE SIGNATURE SIGNATURE SIGNATURE<br />
11 October 2008<br />
Copyright Jacobs Engineering U.K. Limited. All rights reserved.<br />
No part <strong>of</strong> this report may be copied or reproduced by any means without prior written permission from Jacobs Engineering<br />
U.K. Limited. If you have received this report in error, please destroy all copies in your possession or control and notify<br />
Jacobs Engineering U.K. Limited. This report has been prepared for <strong>the</strong> exclusive use <strong>of</strong> <strong>the</strong> commissioning party and<br />
unless o<strong>the</strong>rwise agreed in writing by Jacobs Engineering U.K. Limited, no o<strong>the</strong>r party may use, make use <strong>of</strong> or rely on <strong>the</strong><br />
contents <strong>of</strong> this report. No liability is accepted by Jacobs U.K. Limited for any use <strong>of</strong> this report, o<strong>the</strong>r than for <strong>the</strong> purposes<br />
for which it was originally prepared and provided. Opinions and information provided in <strong>the</strong> report are on <strong>the</strong> basis <strong>of</strong> Jacobs<br />
Engineering U.K. Limited using due skill, care and diligence in <strong>the</strong> preparation <strong>of</strong> <strong>the</strong> same and no warranty is provided as<br />
to <strong>the</strong>ir accuracy. It should be noted and it is expressly stated that no independent verification <strong>of</strong> any <strong>of</strong> <strong>the</strong> documents or<br />
information supplied to Jacobs Engineering U.K. Limited has been made.
Contents<br />
1 Introduction 1-1<br />
1.1 Vision 1-1<br />
1.2 Policy Context 1-1<br />
1.3 Partners delivering <strong>the</strong> KTS Vision 1-2<br />
1.4 Individual and shared Objectives <strong>of</strong> <strong>the</strong> KTS <strong>Transport</strong> <strong>Strategy</strong> 1-3<br />
1.5 Report Outline 1-4<br />
2 The <strong>Transport</strong> Environment 2-6<br />
2.1 Introduction 2-6<br />
2.2 Highways 2-6<br />
2.3 Public <strong>Transport</strong> 2-9<br />
2.4 Walking and Cycling 2-11<br />
2.5 Air Quality and Noise 2-14<br />
3 <strong>Development</strong> <strong>of</strong> <strong>the</strong> <strong>Transport</strong> <strong>Strategy</strong> 3-1<br />
3.1 Introduction 3-1<br />
3.2 Forecasts <strong>of</strong> Land Use and Trip Generation 3-1<br />
3.3 <strong>Transport</strong> Schemes 3-3<br />
3.4 Committed <strong>Transport</strong> Schemes 3-3<br />
3.5 Individual Elements <strong>of</strong> <strong>the</strong> <strong>Transport</strong> <strong>Strategy</strong> 3-4<br />
3.6 Strategic <strong>Transport</strong> Investment Package Schemes 3-13<br />
3.7 The KTS <strong>Transport</strong> Model and Benefits <strong>of</strong> STIPS 3-16<br />
3.8 Accessibility <strong>Strategy</strong> 3-20<br />
4 Conclusions 4-1<br />
Appendix A - <strong>Transport</strong> Modelling and Forecasting 4-4<br />
A.1 The KTS <strong>Transport</strong> Model 4-4<br />
A.2 Modelling Scenarios 4-4<br />
A.3 2025 Do Minimum Network Assumptions 4-5<br />
A.4 2025 STIPS Network Assumptions 4-5
A.5 Modelling Network Performance 4-6<br />
Appendix B - Policy Documents 4-16<br />
Appendix C - <strong>Transport</strong> <strong>Strategy</strong> Action Plans 4-18<br />
Appendix D - Junctions that exceed 85% Volume Capacity Ratios 4-29<br />
Appendix E - References 4-31<br />
Appendix F - Glossary <strong>of</strong> Commonly Used Terms 4-32
1 Introduction<br />
1.1 Vision<br />
The Thames Gateway as a major planning concept emerged in <strong>the</strong> 1990s. It is now<br />
Europe’s largest regeneration project and was identified as one <strong>of</strong> four key growth<br />
areas by <strong>the</strong> Government’s Sustainable Communities Plan. Within <strong>the</strong><br />
Government’s Thames Gateway initiative, <strong>Kent</strong> <strong>Thameside</strong> is recognised as a<br />
priority area for regeneration and investment.<br />
<strong>Kent</strong> <strong>Thameside</strong>, comprising <strong>Dartford</strong> and Gravesham Boroughs north <strong>of</strong> <strong>the</strong> A2<br />
Trunk Road, will provide a new major employment focus and extensive housing<br />
constructed on brownfield land across <strong>the</strong> area. Ebbsfleet Valley is identified as one<br />
<strong>of</strong> <strong>the</strong> four principal economic drivers for <strong>the</strong> whole <strong>of</strong> <strong>the</strong> Thames Gateway, and is<br />
centred on <strong>the</strong> new domestic and international transport hub at Ebbsfleet. The<br />
emerging South East Plan prepared by SEERA and expected to be adopted in 2008<br />
provides <strong>the</strong> statutory framework for <strong>the</strong> regeneration <strong>of</strong> <strong>the</strong> <strong>Kent</strong> <strong>Thameside</strong> area<br />
with a target <strong>of</strong> 25,000 new homes and approximately 50,000 new jobs by 2026.<br />
The vision is to work with local communities to make <strong>Kent</strong> <strong>Thameside</strong> a thriving,<br />
attractive, inclusive and successful community presenting a high quality place to live<br />
work, invest and visit. A key part <strong>of</strong> this vision is that <strong>Kent</strong> <strong>Thameside</strong> should be a<br />
sustainable development.<br />
To this end <strong>the</strong> strategy is to promote employment and housing on a scale, and in<br />
locations, that will enable as many needs as possible to be met locally, reducing <strong>the</strong><br />
need for long distance travel. For remaining trips where walking and cycling are not<br />
an option, <strong>the</strong> aim must be to maximise accessible public transport provision within<br />
both existing and new urban development and to strongly encourage its use.<br />
It is recognised that car use will remain <strong>the</strong> only realistic option for some trips.<br />
However it is envisaged that measures to restrain car use for trips where public<br />
transport is a valid alternative will be needed alongside public transport<br />
improvements as part <strong>of</strong> an overall travel demand management strategy. The <strong>Kent</strong><br />
<strong>Thameside</strong> area along with key development areas and major committed transport<br />
schemes are shown in Figure 1.1<br />
1.2 Policy Context<br />
The principles <strong>of</strong> <strong>the</strong> Thames Gateway spatial framework were established in <strong>the</strong><br />
Regional Spatial <strong>Strategy</strong> (also Regional Plannning Guidance RPG9a), and are<br />
based around <strong>the</strong> consolidation <strong>of</strong> <strong>the</strong> existing regional pattern <strong>of</strong> town and country,<br />
maximising <strong>the</strong> potential <strong>of</strong>fered by <strong>the</strong> area's supply <strong>of</strong> brownfield land and<br />
exploiting <strong>the</strong> opportunity <strong>of</strong>fered by <strong>the</strong> new Channel Tunnel Rail Link (now referred<br />
to as HS1) and <strong>the</strong> River Thames.<br />
At <strong>the</strong> core <strong>of</strong> <strong>the</strong> framework are two new regional commercial and business hubs<br />
directly served by <strong>the</strong> new HS1.<br />
1. The western end <strong>of</strong> <strong>the</strong> Gateway, around Canary Wharf/ Stratford<br />
KTS <strong>Transport</strong> <strong>Strategy</strong> - Technical Summary Final October 2008.doc / Oct-08 1-1
A282<br />
KEY<br />
<strong>Kent</strong> <strong>Thameside</strong> Area<br />
Not to Scale<br />
Crossways<br />
<strong>Development</strong> Area<br />
Fastrack Section<br />
Trunk Road Improvements<br />
Junction Improvemets<br />
A206<br />
The Bridge<br />
Fastrack<br />
The Bridge<br />
A282<br />
<strong>Dartford</strong><br />
Crossing<br />
Crossways<br />
Fastrack<br />
Everards Link<br />
Phase 2<br />
Fastrack<br />
Ingress<br />
Park<br />
Swanscombe<br />
Peninsula<br />
Station Improvents<br />
Channel Tunnel Rail Link (HS 1)<br />
A2<br />
A2018<br />
A226<br />
A2026<br />
<strong>Dartford</strong><br />
Station<br />
<strong>Dartford</strong><br />
Town<br />
Centre<br />
J1b<br />
J1a<br />
A225 A296<br />
A206<br />
Greenhi<strong>the</strong><br />
Station<br />
Waterstone<br />
Park<br />
St James’s<br />
Pit<br />
Bluewater<br />
A2<br />
A226<br />
A296<br />
B255<br />
Ingress<br />
Park<br />
A226<br />
Channel Tunnel<br />
Rail Link<br />
Fastrack<br />
(HS1)<br />
Eastern Quarry<br />
Ebbsfleet<br />
Station<br />
Northfleet<br />
Station<br />
Eastern Quarry<br />
Ebbsfleet Valley<br />
Ebbsfleet<br />
Northfleet<br />
Embankment<br />
Fastrack<br />
Ebsfleet<br />
Gravesend<br />
Station<br />
B261<br />
Fastrack<br />
Thames<br />
Way<br />
Gravesend<br />
Town<br />
Centre<br />
North East<br />
Gravesend<br />
A226<br />
J2<br />
A2 Trunk Road/<br />
A282 Improvement<br />
A227<br />
A2 Trunk Road<br />
Bean to Cobham<br />
M25<br />
M25<br />
Junction 1b to 3<br />
Improvement<br />
A2<br />
Based upon or reproduced from Ordnance<br />
Survey maps with <strong>the</strong> permission <strong>of</strong> <strong>the</strong><br />
Controller <strong>of</strong> Her Majesty's Stationary Office<br />
Crown Copyright reserved<br />
Licence No. LA076708<br />
<strong>Kent</strong> <strong>Thameside</strong> - Major <strong>Development</strong>s & Committed <strong>Transport</strong> Schemes Figure 1.1
2. The centre <strong>of</strong> <strong>the</strong> Gateway in <strong>Kent</strong> <strong>Thameside</strong>, focused on <strong>the</strong> new HS1<br />
station at Ebbsfleet, and <strong>the</strong> adjoining major brownfield sites at Eastern<br />
Quarry, Swanscombe and Northfleet.<br />
Following on from <strong>the</strong> initial Thames Gateway Planning Framework published in<br />
1995, a number <strong>of</strong> planning policy documents, transport studies and strategies have<br />
been produced. The <strong>Kent</strong> <strong>Thameside</strong> <strong>Transport</strong> <strong>Strategy</strong> must be developed within<br />
<strong>the</strong> framework <strong>of</strong> <strong>the</strong>se local, regional and national policy objectives.<br />
The national policy objectives, set out in <strong>the</strong> Government’s Sustainable<br />
Communities Plan, provide a long term vision for new communities and underpin <strong>the</strong><br />
recent philosophy <strong>of</strong> growth areas such as <strong>Kent</strong> <strong>Thameside</strong>. On a regional scale <strong>the</strong><br />
South East Plan provides a draft policy framework for development with <strong>the</strong> region<br />
and <strong>the</strong> sub-region <strong>of</strong> <strong>Kent</strong> Thames Gateway up to 2026. The <strong>Kent</strong> & Medway<br />
Structure Plan provides <strong>the</strong> planning framework that guides decisions on<br />
development in <strong>Kent</strong> and Medway and will continue to do so until <strong>the</strong> South East<br />
Plan is formally adopted, which is expected to be during 2008 / 2009.<br />
<strong>Kent</strong> County Council’s vision for transport has been developed through <strong>the</strong> ten Local<br />
Strategic Partnerships (LSPs) working on <strong>the</strong> new Community <strong>Strategy</strong> for <strong>Kent</strong>,<br />
and through <strong>the</strong> LTP’s (Local <strong>Transport</strong> Plan for <strong>Kent</strong> 2006 – 2011) extensive<br />
community engagement process. Reducing social exclusion and<br />
congestion, protecting <strong>the</strong> environment and improving public transport are amongst<br />
<strong>the</strong> top three issues in eight out <strong>of</strong> <strong>the</strong> ten LSP community strategies. The strong<br />
relationship between <strong>the</strong> community strategies and LTP has ensured that KCC's<br />
vision for transport is entirely consistent with <strong>the</strong> long term aims <strong>of</strong> <strong>Kent</strong>'s local<br />
authorities and <strong>the</strong>ir partners. The Local <strong>Transport</strong> Plan sets out <strong>the</strong> transport vision<br />
for <strong>the</strong> County for 2025 as developed with partners and <strong>the</strong> plan sets out a strategy<br />
to achieve <strong>the</strong> vision.<br />
Finally <strong>the</strong> local development policies and objectives <strong>of</strong> Gravesham and <strong>Dartford</strong> are<br />
in <strong>the</strong> Borough councils Adopted Local Plans and emerging Local <strong>Development</strong><br />
Frameworks.<br />
A more comprehensive listing <strong>of</strong> relevant local, regional and national policy<br />
documents are attached in Appendix B.<br />
1.3 Partners delivering <strong>the</strong> KTS Vision<br />
Responsibility for <strong>the</strong> Thames Gateway as a whole lies with <strong>the</strong> Department <strong>of</strong><br />
Communities and Local Government (DCLG).<br />
The <strong>Kent</strong> <strong>Thameside</strong> Delivery Board (KTSDB) has been set up as a partnership<br />
between local and central Government and developers to co-ordinate and oversee<br />
development in <strong>the</strong> <strong>Kent</strong> <strong>Thameside</strong> area.<br />
A separate <strong>Kent</strong> <strong>Thameside</strong> <strong>Transport</strong> Group has been set up, comprising<br />
representatives <strong>of</strong> <strong>the</strong> <strong>Kent</strong> <strong>Thameside</strong> Delivery Board, <strong>Kent</strong> County Council (KCC)<br />
<strong>the</strong> highway authority for <strong>the</strong> non-trunk roads, Highways Agency (HA) <strong>the</strong> highway<br />
authority for <strong>the</strong> trunk roads, and <strong>Dartford</strong> and Gravesham Borough Councils <strong>the</strong><br />
local planning authorities and drivers <strong>of</strong> <strong>the</strong> Local <strong>Development</strong> Frameworks (LDF).<br />
The <strong>Transport</strong> Group has responsibility for developing a <strong>Transport</strong> <strong>Strategy</strong> to<br />
support development in <strong>Kent</strong> <strong>Thameside</strong> and is supported by <strong>the</strong> consultants acting<br />
for KCC (Jacobs) and for <strong>the</strong> HA (Faber Maunsell). There are also separate<br />
transport consultants advising <strong>the</strong> Local Boroughs and <strong>the</strong> private developers.<br />
KTS <strong>Transport</strong> <strong>Strategy</strong> - Technical Summary Final October 2008.doc / Oct-08 1-2
1.4 Individual and shared Objectives <strong>of</strong> <strong>the</strong> KTS <strong>Transport</strong> <strong>Strategy</strong><br />
Each <strong>of</strong> <strong>the</strong> partners identified above supports <strong>the</strong> overall vision for <strong>Kent</strong><br />
<strong>Thameside</strong>, and shares <strong>the</strong> same broad objectives. However each partner<br />
organisation also has its own local objectives and priorities on transport issues.<br />
The KTSDB Partners have <strong>the</strong> following individual objectives<br />
<strong>Kent</strong> County Council<br />
• Accessibility<br />
“<strong>Kent</strong> County Council will support independence and reduce social exclusion<br />
by improving transport links to key destinations and bringing services closer<br />
to communities”<br />
• Demand Management<br />
“<strong>Kent</strong> County Council will seek to reduce <strong>the</strong> demand for transport both<br />
within and through <strong>Kent</strong>”<br />
• Environment, Heritage and Communities<br />
“<strong>Kent</strong> County Council will stabilise and, where possible, reverse <strong>the</strong> adverse<br />
effect <strong>of</strong> transport and its infrastructure on <strong>the</strong> natural and built environment<br />
and on local communities”<br />
• Health<br />
“<strong>Kent</strong> County Council will improve <strong>the</strong> health <strong>of</strong> <strong>Kent</strong> residents by reducing<br />
<strong>the</strong> impact <strong>of</strong> transport, encouraging increased physical activity and<br />
enhancing access to key health facilities”<br />
• Integration<br />
“<strong>Kent</strong> County Council will encourage integration to maximise <strong>the</strong> use <strong>of</strong><br />
sustainable modes and <strong>the</strong>refore widen choice for <strong>Kent</strong> residents”<br />
• Keep <strong>Kent</strong> Moving<br />
“<strong>Kent</strong> County Council will manage and maintain <strong>the</strong> local highway network to<br />
maximise <strong>the</strong> safe and efficient use <strong>of</strong> road space and provide reliable<br />
journey times”<br />
• Road Safety<br />
“<strong>Kent</strong> County Council will strive to provide a safe and secure transport<br />
system for all users throughout <strong>the</strong> county”<br />
• Sustainable Regeneration<br />
“<strong>Kent</strong> County Council will promote development that reduces <strong>the</strong> need to<br />
travel while supporting <strong>the</strong> local economy”<br />
• UK Connections<br />
“<strong>Kent</strong> County Council will press for more efficient, sustainable transport links<br />
with London and <strong>the</strong> rest <strong>of</strong> <strong>the</strong> UK”<br />
• UK Gateway<br />
“<strong>Kent</strong> County Council will ensure that international traffic covers its costs,<br />
minimises <strong>the</strong> impact on <strong>Kent</strong> and its residents and maximises <strong>the</strong> use <strong>of</strong><br />
rail”<br />
<strong>Dartford</strong> Borough Council<br />
• Enable travel choices that support economic activity and growth via <strong>the</strong><br />
planning process.<br />
• Ensure accessibility to services and facilities by various travel modes via<br />
partnerships.<br />
KTS <strong>Transport</strong> <strong>Strategy</strong> - Technical Summary Final October 2008.doc / Oct-08 1-3
• Maintain and improve (where possible) air quality with regard to vehicle<br />
emissions, especially in declared Air Quality Management Areas (AQMAs),<br />
via <strong>the</strong> planning process and partnership working.<br />
• Encourage pedestrian and cyclist travel by creating with o<strong>the</strong>rs, strategically<br />
linked local networks with appropriate resting and cycle parking facilities.<br />
• Encourage public transport travel via partnerships to ensure competitive<br />
journey times, fares and frequencies; quality vehicles; and appropriate<br />
services information provision.<br />
• Manage car trips using demand management techniques and kerb-space<br />
management solutions.<br />
• Accommodate residual car travel via strategically allocated <strong>of</strong>f-street parking<br />
facilities especially when cars are used as part <strong>of</strong> a multi-mode journey.<br />
• Maintain <strong>the</strong> viability <strong>of</strong> <strong>Dartford</strong> town centre.<br />
Gravesham Borough Council<br />
• Keep Gravesham moving in <strong>the</strong> context <strong>of</strong> major development.<br />
• Upgrade <strong>the</strong> public transport system.<br />
• Manage <strong>the</strong> highway network to maximum efficiency.<br />
• Ensure adequate car parking without compromising o<strong>the</strong>r objectives.<br />
• Ensure sufficient funding to finance transport enhancements.<br />
• Reduce <strong>the</strong> impact on residents <strong>of</strong> poor air quality from all sources.<br />
• Maintain <strong>the</strong> viability <strong>of</strong> Gravesend town centre<br />
• Consistency <strong>of</strong> <strong>the</strong> KTS <strong>Transport</strong> <strong>Strategy</strong> with <strong>the</strong> emerging LDF for<br />
Gravesham.<br />
Highways Agency<br />
• Engage in <strong>the</strong> planning process and support <strong>the</strong> Government’s sustainable<br />
development agenda.<br />
• Influence travel behaviour, minimise <strong>the</strong> number <strong>of</strong> trips at source, and<br />
promote sustainable travel choices.<br />
• Promote measures to overcome constraints on sustainable economic<br />
development; where <strong>the</strong>se constraints include strategic road capacity,<br />
preference should be given to solutions o<strong>the</strong>r than new road capacity.<br />
• To ensure that developers manage down <strong>the</strong> traffic impact <strong>of</strong> <strong>the</strong>ir<br />
developments and where capacity is exceeded, ensure that local conditions<br />
on <strong>the</strong> strategic road network will be no worse with <strong>the</strong> development than if it<br />
had not taken place.<br />
The KTS <strong>Transport</strong> <strong>Strategy</strong> needs to ensure that <strong>the</strong> overall vision can be delivered<br />
without any key individual objectives having to be sacrificed.<br />
1.5 Report Outline<br />
The following chapters <strong>of</strong> this report can be summarised as follows:<br />
• Chapter 2 will outline <strong>the</strong> transport environment.<br />
• Chapter 3 will describe <strong>the</strong> developments and <strong>the</strong> transport strategy for <strong>the</strong><br />
area.<br />
• Chapter 4 will <strong>of</strong>fer conclusions.<br />
• The Appendices provide details on <strong>the</strong> transport modelling and forecasting,<br />
policy documents, <strong>the</strong> <strong>Transport</strong> <strong>Strategy</strong> Action Plans, potentially<br />
overloaded junctions and references.<br />
KTS <strong>Transport</strong> <strong>Strategy</strong> - Technical Summary Final October 2008.doc / Oct-08 1-4
• There is also an Appendix F that has a glossary <strong>of</strong> commonly used technical<br />
terms.<br />
This is a Technical Summary Report and <strong>the</strong> more detailed reports that went into <strong>the</strong><br />
development <strong>of</strong> this summary report are referenced in Appendix E. It should be<br />
noted that this Summary Document reflects <strong>the</strong> position up to October 2008 and will<br />
evolve over time as more information and data becomes available and as more<br />
studies are completed.<br />
KTS <strong>Transport</strong> <strong>Strategy</strong> - Technical Summary Final October 2008.doc / Oct-08 1-5
2 The <strong>Transport</strong> Environment<br />
2.1 Introduction<br />
<strong>Kent</strong> <strong>Thameside</strong> comprises <strong>the</strong> boroughs <strong>of</strong> <strong>Dartford</strong> and Gravesham. It lies within<br />
<strong>the</strong> Thames Gateway region <strong>of</strong> <strong>Kent</strong> earmarked for major re-development in line<br />
with Government plans. The area is intersected by <strong>the</strong> M25 / A282 on a north –<br />
south axis with <strong>the</strong> <strong>Dartford</strong> Crossing leading into Essex. To <strong>the</strong> west lies London<br />
whilst to <strong>the</strong> east <strong>the</strong>re are <strong>the</strong> Medway Towns and to <strong>the</strong> north is <strong>the</strong> River Thames.<br />
The A2 Trunk Road forms <strong>the</strong> sou<strong>the</strong>rn boundary <strong>of</strong> <strong>the</strong> KTS area. The KTS area<br />
and key transport links are shown in Figure 1.1.<br />
2.2 Highways<br />
The KTS area is served by a hierarchy <strong>of</strong> existing roads from strategic trunk roads to<br />
classified principal roads and local roads. The A2 Trunk Road and <strong>the</strong> M25/A282<br />
are <strong>the</strong> two trunk roads in <strong>the</strong> area and are <strong>the</strong> responsibility <strong>of</strong> <strong>the</strong> Highways<br />
Agency whilst principal and local roads are managed by <strong>Kent</strong> County Council.<br />
The A2/M2 Trunk Road carries strategic traffic between London and <strong>Kent</strong><br />
destinations such as <strong>the</strong> Medway Towns, Canterbury and <strong>the</strong> port <strong>of</strong> Ramsgate. It<br />
also provides an alternative route to <strong>the</strong> M20 for <strong>the</strong> Port <strong>of</strong> Dover and to Channel<br />
Tunnel shuttle services at Folkestone. For KTS related traffic <strong>the</strong> A2 Trunk Road is<br />
used primarily by traffic heading into London and beyond and is <strong>the</strong> key arterial<br />
route for traffic access to Ebbsfleet station and <strong>the</strong> regional shopping centre at<br />
Bluewater. In <strong>the</strong> future <strong>the</strong> A2 Trunk Road will also provide a key access for <strong>the</strong><br />
Eastern Quarry and Ebbsfleet developments both located in <strong>the</strong> Ebbsfleet Valley<br />
(refer to Figure 1.1).<br />
The o<strong>the</strong>r major route passing through <strong>the</strong> area is <strong>the</strong> M25 / A282. This caters<br />
mainly for strategic traffic avoiding London and is also a key route for local KTS<br />
traffic that wants to head north into Essex and beyond via <strong>the</strong> <strong>Dartford</strong> Crossing.<br />
Widening and junction improvements are currently being carried out at a number <strong>of</strong><br />
points on <strong>the</strong> local trunk road network with an expected completion during <strong>the</strong> latter<br />
half <strong>of</strong> 2008.<br />
The KTS urban areas are connected to <strong>the</strong> trunk road network in a number <strong>of</strong><br />
locations. <strong>Dartford</strong> is connected to <strong>the</strong> A2 at:<br />
• A2018 <strong>Dartford</strong> Heath Interchange.<br />
• B255/A296 Bean Interchange which also provides access to Bluewater.<br />
<strong>Dartford</strong> is connected to <strong>the</strong> A282/M25 via <strong>the</strong> A206 at junction 1a and <strong>the</strong><br />
A225/A296 Princes Road Interchange (junction 1b). The A206 also provides access<br />
to <strong>the</strong> Crossways Business development and Greenhi<strong>the</strong>.<br />
The Gravesham urban area <strong>of</strong> Gravesend is connected to <strong>the</strong> A2 Trunk Road at <strong>the</strong><br />
following interchanges:<br />
• Ebbsfleet Junction.<br />
• Pepperhill Junction.<br />
• A227 Tollgate.<br />
KTS <strong>Transport</strong> <strong>Strategy</strong> - Technical Summary Final October 2008.doc / Oct-08 2-6
• Marling Cross for local traffic via Valley Drive.<br />
The Ebbsfleet area has witnessed major network changes associated with <strong>the</strong><br />
Channel Tunnel Rail Link works. In 2007 <strong>the</strong> opening <strong>of</strong> <strong>the</strong> Ebbsfleet Link road<br />
joined <strong>the</strong> A2 Trunk Road / Ebbsfleet junction with <strong>the</strong> A226 Thames Way. It forms<br />
<strong>the</strong> main access to Ebbsfleet station as well as creating a new route to and from<br />
Northfleet, Gravesend and <strong>the</strong> A2 Trunk Road. This new link will relieve <strong>the</strong><br />
Pepperhill and A227 Tollgate junctions as well as taking traffic away from B262<br />
Springhead Road. Note Springhead Road has now been downgraded from <strong>the</strong><br />
A2260 to be part <strong>of</strong> <strong>the</strong> B262.<br />
Between <strong>Dartford</strong> and Gravesend lie major development areas <strong>of</strong> Ebbsfleet, Stone,<br />
Greenhi<strong>the</strong>, Swanscombe and Northfleet. The A226 is <strong>the</strong> main arterial connection<br />
along with <strong>the</strong> A206 Crossways Boulevard (STDR 1). The latter road is <strong>the</strong> main<br />
access link into <strong>the</strong> Stone and Greenhi<strong>the</strong> development areas.<br />
At <strong>the</strong> same time, both <strong>Dartford</strong> and Gravesend are already re-designing <strong>the</strong>ir town<br />
centre highway network operation to enhance public transport and <strong>the</strong> local<br />
environment. Within <strong>Dartford</strong> <strong>the</strong>re are plans to revise <strong>the</strong> gyratory system whilst in<br />
Gravesend town centre <strong>the</strong>re is <strong>the</strong> <strong>Transport</strong> Quarter Redevelopment and <strong>the</strong><br />
associated Rathmore Road proposal. The long term future <strong>of</strong> <strong>the</strong> Gravesend Town<br />
Centre one way system is still to be considered.<br />
Longer term future plans within <strong>the</strong> KTS area include <strong>the</strong> commitment to dual <strong>the</strong><br />
A226 Thames Way known as STDR4 associated with <strong>the</strong> Eastern Quarry and<br />
Ebbsfleet developments. More details on future highway schemes are provided in<br />
Chapter 3.<br />
2.2.1 Traffic Conditions and Local Hotspots<br />
Like many parts <strong>of</strong> <strong>the</strong> UK <strong>the</strong> <strong>Kent</strong> <strong>Thameside</strong> area is heavily affected by commuter<br />
based traffic and tends to be a weekday morning peak (0700 – 1000) and evening<br />
peak period (1600 – 1900) issue.<br />
However <strong>Kent</strong> <strong>Thameside</strong> is somewhat different in <strong>the</strong> nature and characteristics <strong>of</strong><br />
its traffic composition when compared to its nearest neighbour London. In London<br />
<strong>the</strong> peaks are sustained over a longer period <strong>of</strong> <strong>the</strong> day and <strong>the</strong> pr<strong>of</strong>ile <strong>of</strong> <strong>the</strong> traffic<br />
has flattened from congestion, through peak spreading. However in <strong>Kent</strong><br />
<strong>Thameside</strong> <strong>the</strong> congestion is not as intense as London and is more a peak hour<br />
issue with <strong>the</strong> shoulders <strong>of</strong> <strong>the</strong> peak generally having lower levels <strong>of</strong> traffic and<br />
congestion. Therefore overloaded junctions in <strong>Kent</strong> <strong>Thameside</strong> tend to recover<br />
back to being within capacity quicker than in many areas <strong>of</strong> London. However it<br />
should be noted as one approaches <strong>the</strong> trunk road network <strong>the</strong> peak traffic pr<strong>of</strong>ile is<br />
more flattened and more similar to London conditions. As a benchmark comparator<br />
average speeds in outer London for <strong>the</strong> evening peak are around 40 kph whilst in<br />
<strong>the</strong> KTS area average speed for <strong>the</strong> equivalent time period is around 59 kph.<br />
A very high proportion <strong>of</strong> <strong>the</strong> <strong>Kent</strong> <strong>Thameside</strong> traffic is London related and <strong>the</strong>refore<br />
intense traffic movements are found on and at <strong>the</strong> approaches to <strong>the</strong> trunk road<br />
network and <strong>the</strong> principal roads that feed into London like <strong>the</strong> A226 / A206 corridor.<br />
Traffic movements are also attracted to <strong>the</strong> M25 / A282 trunk road corridor to cross<br />
over <strong>the</strong> <strong>Dartford</strong> Crossing to access o<strong>the</strong>r parts <strong>of</strong> <strong>the</strong> South East. Locally<br />
Bluewater in <strong>Kent</strong> <strong>Thameside</strong> is one <strong>of</strong> <strong>the</strong> largest shopping centres in <strong>the</strong> UK and is<br />
also a major attractor <strong>of</strong> traffic. However <strong>the</strong> shopping centre does not open until<br />
1000 on a weekday so <strong>the</strong> associated traffic movements are more a weekday<br />
KTS <strong>Transport</strong> <strong>Strategy</strong> - Technical Summary Final October 2008.doc / Oct-08 2-7
evening peak and a Saturday issue. There is also intense traffic activity in <strong>the</strong> two<br />
town centres <strong>of</strong> <strong>Dartford</strong> and Gravesend on <strong>the</strong> weekdays and on a Saturday<br />
associated with retail and o<strong>the</strong>r business activities.<br />
Generally in <strong>Kent</strong> <strong>Thameside</strong> due to <strong>the</strong> importance <strong>of</strong> retail activity combined with<br />
commuter work based traffic <strong>the</strong> weekday evening peak is more congested than <strong>the</strong><br />
morning peak. The network performance statistics are provided for <strong>the</strong> AM and PM<br />
peaks in Tables A.1 and A.2 respectively in Appendix A.<br />
Key current traffic hotspots in <strong>Kent</strong> <strong>Thameside</strong> include <strong>the</strong> following:<br />
• Some <strong>of</strong> <strong>the</strong> junctions along <strong>the</strong> A2 corridor including Bean Junction<br />
• A282 <strong>Dartford</strong> Crossing<br />
• B262 Hall Road / Springhead Road<br />
• A226 London Road / St Clements Way<br />
• The town centre areas <strong>of</strong> Gravesend and <strong>Dartford</strong><br />
Bean Junction is closely associated with <strong>the</strong> Bluewater shopping centre and<br />
<strong>the</strong>refore tends to be an evening peak and Saturday issue associated with retail<br />
traffic. Key hotspot queuing locations include Bean Sou<strong>the</strong>rn Roundabout and <strong>the</strong><br />
eastbound <strong>of</strong>f slip from <strong>the</strong> A2. A major concern for <strong>the</strong> Highways Agency who is<br />
<strong>the</strong> highway authority for Bean junction is for traffic not to block back onto <strong>the</strong> main<br />
A2 carriageway with <strong>the</strong> proposed developments in <strong>Kent</strong> <strong>Thameside</strong>.<br />
A282 <strong>Dartford</strong> Crossing is a significant bottleneck in <strong>Kent</strong> <strong>Thameside</strong> and <strong>the</strong><br />
capacity constraint is associated with <strong>the</strong> crossing itself although <strong>the</strong> toll booths can<br />
also act as a constraint. <strong>Dartford</strong> Crossing is a regional issue that extends far<br />
beyond <strong>the</strong> <strong>Kent</strong> <strong>Thameside</strong> area so <strong>the</strong> future planning <strong>of</strong> crossing <strong>the</strong> Thames in<br />
this area will not be specific to <strong>the</strong> <strong>Kent</strong> <strong>Thameside</strong> proposals. Section 3.8 refers<br />
to <strong>the</strong> o<strong>the</strong>r studies that are ongoing to address this crossing constraint.<br />
The B262 Hall Road / Springhead Road is a roundabout junction that allows access<br />
to a major Sainsbury store and provides a route into Gravesend via Hall Road. It<br />
enables traffic from Gravesend and Northfleet to access <strong>the</strong> A2 via Pepperhill<br />
junction. The junction is constrained by nearby properties and will be difficult to<br />
expand capacity however <strong>the</strong> queues are for a limited period <strong>of</strong> <strong>the</strong> peak today. The<br />
plan is with <strong>the</strong> opening <strong>of</strong> <strong>the</strong> Ebbsfleet Link Road as an alternative access to <strong>the</strong><br />
A2 <strong>the</strong> traffic levels on Springhead Road can be managed down with suitable traffic<br />
calming measures. A traffic calming scheme is currently being developed for<br />
Springhead Road by <strong>the</strong> developers <strong>of</strong> nearby Springhead Park.<br />
The A226 London Road / St Clements Way is ano<strong>the</strong>r location where <strong>the</strong> junction<br />
can become overloaded for some parts <strong>of</strong> <strong>the</strong> peak but is not overloaded<br />
continuously in <strong>the</strong> peak period. The congested arms include Station Road<br />
Approach which is affected by poor visibility and queuing eastbound traffic on<br />
London Road from a nearby pedestrian crossing when called. The junction is also<br />
affected by a large number <strong>of</strong> heavy goods vehicles. There is also queuing on<br />
London Road westbound where <strong>the</strong> queues extend back to The Avenue and<br />
beyond.<br />
The town centres <strong>of</strong> Gravesend and <strong>Dartford</strong> do have some localised congestion<br />
hotspots around <strong>the</strong> gyratory system but again it is not sustained continuously<br />
throughout <strong>the</strong> peak period. The modelling has identified <strong>the</strong> crossing at Parrock<br />
Street in Gravesend as one area <strong>of</strong> congestion.<br />
KTS <strong>Transport</strong> <strong>Strategy</strong> - Technical Summary Final October 2008.doc / Oct-08 2-8
The current and future transport network performance has been assessed using <strong>the</strong><br />
<strong>Kent</strong> <strong>Thameside</strong> <strong>Transport</strong>ation Model (KTS Model) along with micro-simulation<br />
models. More details <strong>of</strong> modelling work and a summary <strong>of</strong> results obtained are<br />
provided in Appendix A. In Appendix D is a list <strong>of</strong> locations from <strong>the</strong> KTS Model<br />
where <strong>the</strong> volume / capacity ratio exceeds 85% both today (2005) and in <strong>the</strong> future<br />
for 2025. The volume capacity ratio is an indicator <strong>of</strong> locations that may experience<br />
overloading <strong>of</strong> junctions at least during some periods <strong>of</strong> <strong>the</strong> peak.<br />
2.3 Public <strong>Transport</strong><br />
The area has a well established bus network and is served by <strong>the</strong> suburban services<br />
<strong>of</strong> Sou<strong>the</strong>astern Railway, with London commuting being significant. In addition, <strong>the</strong><br />
area is served by <strong>the</strong> developing Fastrack 'bus rapid transit' network. To<br />
accommodate <strong>the</strong> growth in <strong>the</strong> area <strong>the</strong> 'Vision' document ‘Looking to <strong>the</strong> Future’,<br />
published by <strong>the</strong> <strong>Kent</strong> <strong>Thameside</strong> Association in 1995, described <strong>the</strong> principle <strong>of</strong><br />
Public <strong>Transport</strong> Orientated <strong>Development</strong> and envisaged a bold and ambitious<br />
substantial increase in <strong>the</strong> modal share for public transport, with <strong>the</strong> suggestion that<br />
for journeys to work mode share could rise from 18% to even as high as 40%.<br />
The current modal share for journeys to work by bus is around 4% in <strong>Dartford</strong> and<br />
9% in Gravesend, whilst rail is around 15% in <strong>Dartford</strong> and 8% in Gravesend. Car<br />
travel for journeys to work is about 60% in both boroughs according to <strong>the</strong> 2001<br />
census.<br />
The area has four key transport hubs, namely <strong>Dartford</strong> and Gravesend town<br />
centres, Bluewater/Greenhi<strong>the</strong>, and Ebbsfleet railway station. The importance <strong>of</strong><br />
Ebbsfleet will increase when HS1 Domestic trains start running from 2009. It is<br />
served by Fastrack, as well as having 5,500 spaces (with permission for 9,000 car<br />
parking spaces) to accommodate rail passengers arriving by car known as rail<br />
heading. However it is important <strong>the</strong> transport strategy promotes <strong>the</strong> public<br />
transport aspect <strong>of</strong> Ebbsfleet station to encourage more sustainable modes <strong>of</strong> travel.<br />
Nei<strong>the</strong>r <strong>Dartford</strong> nor Gravesend has a true bus station, interchange between buses<br />
and trains are not ideal, and signage between groups <strong>of</strong> bus stops merits<br />
improvement.<br />
A new '<strong>Transport</strong> Quarter' proposal for Gravesend is being developed in a limited<br />
area and is at <strong>the</strong> outline planning stage. The scheme needs to balance <strong>the</strong> priority<br />
for buses across <strong>the</strong> network versus <strong>the</strong> needs <strong>of</strong> o<strong>the</strong>r road users and careful<br />
planning is required to ensure buses are not diverted via circuitous routes, and to<br />
ensure that <strong>the</strong> capacity is sufficient for future levels <strong>of</strong> bus services.<br />
Bluewater Shopping Centre has a modern bus station and Greenhi<strong>the</strong> has a new<br />
bus interchange with Fastrack services and is <strong>the</strong> designated rail station for<br />
Bluewater. Bluewater Shopping Centre is a major attractor for travel in <strong>the</strong> KTS area<br />
and <strong>the</strong>refore <strong>the</strong> rail and bus stations serving this centre have <strong>the</strong> potential to<br />
become significant transport hubs with increased development in <strong>the</strong> area.<br />
Most bus services in <strong>the</strong> area are operated by one company – Arriva, who <strong>of</strong>fer a<br />
range <strong>of</strong> daily, weekly and monthly tickets in addition to traditional single and return<br />
fares. Some bus routes from <strong>the</strong> west are operated as part <strong>of</strong> <strong>the</strong> London Buses<br />
network. At present, tickets are not inter-available between <strong>the</strong> two operators, and<br />
Arriva do not use smartcard technology. Through bus-rail ticketing has been<br />
recently introduced in Gravesend, through <strong>the</strong> 'PLUSBUS' national scheme. There<br />
are no plans at present to extend this across <strong>the</strong> wider <strong>Thameside</strong> area but it should<br />
be an objective as part <strong>of</strong> <strong>the</strong> transport strategy to extend <strong>the</strong> scheme considering<br />
KTS <strong>Transport</strong> <strong>Strategy</strong> - Technical Summary Final October 2008.doc / Oct-08 2-9
<strong>the</strong> high usage <strong>of</strong> rail commuting in <strong>the</strong> area. PLUSBUS should encourage users to<br />
use public transport for <strong>the</strong> entire journey and reduce car journeys to rail stations<br />
thus encouraging fur<strong>the</strong>r sustainable travelling in <strong>the</strong> area.<br />
A key element <strong>of</strong> <strong>the</strong> public transport network is Fastrack, a high quality bus based<br />
rapid transit system with potential to upgrade to tram operation in <strong>the</strong> future. Figure<br />
2.1 shows <strong>the</strong> location <strong>of</strong> <strong>the</strong> existing Fastrack routes in <strong>Kent</strong> <strong>Thameside</strong> as well as<br />
<strong>the</strong> proposed routes associated with key developments. About half <strong>the</strong> final network<br />
will be on dedicated bus only routes, and <strong>the</strong>re will be bus priority at many junctions<br />
where buses cross or join public roads. In addition <strong>the</strong>re is potential for some local<br />
improvements for example where Fastrack runs on private roads within Bluewater<br />
and <strong>the</strong> Darent Valley Hospital complex. The Fastrack service opened in 2006<br />
(Route B) and has already exceeded initial expectations. Based on research and<br />
surveys reported in <strong>the</strong> Fastrack document titled ‘The first six months’ some <strong>of</strong> <strong>the</strong><br />
findings for <strong>the</strong> new Fastrack service were as follows:<br />
• The top three reasons that people are using Fastrack are frequency (25%),<br />
convenience (21%) and traffic free routes (15%)<br />
• Passenger numbers growing since ‘day 1’ to now exceed forecasts by well<br />
over 50%<br />
• Achieved a 95% overall customer satisfaction rating<br />
• The service can attract and retain new passengers, with surveys indicating<br />
19% having switched from previous car use<br />
• Integrated <strong>the</strong> service into <strong>Kent</strong> <strong>Thameside</strong> area with minimal adverse<br />
impact on o<strong>the</strong>r key local bus routes<br />
• Introduced <strong>the</strong> first branded and comprehensively marketed zonal fare<br />
system in <strong>Kent</strong><br />
• Nearly 40% <strong>of</strong> passengers are using Fastrack to go to work or<br />
school/college with shopping being <strong>the</strong> second highest reason for using <strong>the</strong><br />
service.<br />
• The service to Darent Valley Hospital is also well used reflected in <strong>the</strong> 9%<br />
health trip purpose from a recent survey<br />
The Fastrack scheme is implemented by a multi partner delivery board, which has<br />
successfully brought toge<strong>the</strong>r local councils, private developers and <strong>the</strong> bus<br />
operator. Significant funding has gone into Fastrack, and long term developer<br />
funding has been secured. It has been a policy that Fastrack services commence at<br />
<strong>the</strong> earliest possible stage <strong>of</strong> development, so that travel habits can be established<br />
around public transport. Fastrack Route A which serves <strong>the</strong> Bridge <strong>Development</strong><br />
opened in June 2007 and is <strong>the</strong> first development in <strong>the</strong> UK where <strong>the</strong> public<br />
transport infrastructure has been planned, built and made operational before <strong>the</strong><br />
arrival <strong>of</strong> commercial or residential occupiers.<br />
The conventional local bus network is relatively stable, <strong>of</strong>fering good coverage and<br />
reasonable service levels during weekday daytimes. Some routes in Gravesend<br />
were upgraded in 2005 under <strong>the</strong> 'Kickstart' scheme, and this has delivered an<br />
increase in patronage <strong>of</strong> around 20%. There remain, however gaps in <strong>the</strong> service,<br />
particularly early mornings, evenings and on Sundays, when <strong>the</strong> level <strong>of</strong> service is<br />
poor in comparison to that <strong>of</strong>fered by Fastrack or in neighbouring Greater London.<br />
There are some bus lanes and bus priority measures in <strong>the</strong> area for 'conventional'<br />
bus services; <strong>the</strong>re is scope to improve and expand on <strong>the</strong>se, although road space<br />
is limited in some areas, particularly in <strong>the</strong> historic town centre <strong>of</strong> Gravesend. If a<br />
significant level <strong>of</strong> transfer from car use to public transport is to be achieved, <strong>the</strong>n<br />
considerable efforts will have to be put into seeking opportunities to <strong>of</strong>fer buses<br />
KTS <strong>Transport</strong> <strong>Strategy</strong> - Technical Summary Final October 2008.doc / Oct-08 2-10
A282<br />
Not to Scale<br />
KEY<br />
Existing Fastrack Routes<br />
Route A<br />
Route B<br />
Proposed Fastrack Routes<br />
Route B<br />
Route C<br />
Route D<br />
Crossways<br />
<strong>Kent</strong> <strong>Thameside</strong> Area<br />
<strong>Development</strong> Area<br />
Ebbsfleet International Station<br />
Channel Tunnel Rail Link (HS 1)<br />
A206<br />
The Bridge<br />
A282<br />
<strong>Dartford</strong><br />
Crossing<br />
Crossways<br />
A206<br />
Ingress<br />
Park<br />
Swanscombe<br />
Peninsula<br />
A2026<br />
J1a<br />
A226<br />
A2<br />
A2018<br />
A226<br />
<strong>Dartford</strong><br />
Town<br />
Centre<br />
J1b<br />
A225 A296<br />
A226<br />
St James’s<br />
Pit<br />
Bluewater<br />
Waterstone<br />
Park<br />
A296<br />
B255<br />
Eastern Quarry<br />
Ebbsfleet<br />
Station<br />
Ebbsfleet Valley<br />
Ebbsfleet<br />
Northfleet<br />
Embankment<br />
B261<br />
Gravesend<br />
Town<br />
Centre<br />
North East<br />
Gravesend<br />
A226<br />
A2<br />
J2<br />
A227<br />
M25<br />
A2<br />
Based upon or reproduced from Ordnance<br />
Survey maps with <strong>the</strong> permission <strong>of</strong> <strong>the</strong><br />
Controller <strong>of</strong> Her Majesty's Stationary Office<br />
Crown Copyright reserved<br />
Licence No. LA076708<br />
Existing & Proposed Fastrack Bus Services in <strong>Kent</strong> <strong>Thameside</strong> Figure 2.1
fur<strong>the</strong>r priority measures. To this end, alignments for new bus lanes or busways for<br />
routes planned for implementation in 2011 or 2018 need to be identified and<br />
protected as soon as possible, before town centre land is lost to development.<br />
Many new international destinations were brought within reach <strong>of</strong> KTS with <strong>the</strong><br />
opening <strong>of</strong> Ebbsfleet International railway station in 2007, with UK destinations<br />
following in 2009 with <strong>the</strong> introduction <strong>of</strong> domestic high speed trains. Fur<strong>the</strong>r rail<br />
based possibilities include <strong>the</strong> nearby Crossrail scheme, now approved by<br />
Government to run to Abbey Wood, with <strong>the</strong> alignment safeguarded as far east as<br />
Hoo Junction to <strong>the</strong> east <strong>of</strong> Gravesend. The current rail network, while at capacity in<br />
<strong>the</strong> London area, <strong>of</strong>fers a comprehensive service for travel between central London<br />
and KTS, although facilities at stations – particularly <strong>the</strong> intermediate stations<br />
between <strong>Dartford</strong> and Gravesend – have scope for improvement, especially in terms<br />
<strong>of</strong> accessibility. A number <strong>of</strong> schemes have already been identified in Network Rail<br />
plans, but await funding. Network Rail has also identified a number <strong>of</strong> rail<br />
improvements in <strong>the</strong> area via <strong>the</strong> Rail Utilisation <strong>Strategy</strong> (RUS) and includes<br />
options on extending train and platform lengths by 2012.<br />
There is a significant level <strong>of</strong> commuting to London by coach from <strong>the</strong> area,<br />
although it is recognised that <strong>the</strong>se coach services are vulnerable to traffic<br />
congestion particularly in London. Nei<strong>the</strong>r <strong>the</strong> existing rail nor coach networks <strong>of</strong>fer<br />
direct 'orbital' journeys to destinations such as Bromley or Croydon; and <strong>the</strong><br />
prospect <strong>of</strong> funding such services in <strong>the</strong> foreseeable future seems remote.<br />
Both boroughs are well served by taxis, although some taxi ranks are little used by<br />
<strong>the</strong> trade and <strong>the</strong> public. Taxis have <strong>the</strong> potential to be a useful part <strong>of</strong> <strong>the</strong> public<br />
transport network, <strong>of</strong>fering flexibility for occasions when bus travel is not practical.<br />
However it needs to be recognised that taxis can contribute to vehicle emissions<br />
and congestion to <strong>the</strong> same extent as <strong>the</strong> private car and <strong>the</strong>refore should be<br />
treated as a lower order public transport alternative.<br />
2.4 Walking and Cycling<br />
Around a fifth <strong>of</strong> all households in <strong>Dartford</strong> and Gravesham do not own a car,<br />
meaning that walking and cycling will constitute many <strong>of</strong> <strong>the</strong>ir journeys. O<strong>the</strong>r<br />
concerns such as congestion, health and social exclusion mean that walking and<br />
cycling needs to be increasingly important during <strong>Kent</strong> <strong>Thameside</strong>’s development.<br />
The 2001 census data indicates that walking and cycling is slightly less popular for<br />
travelling to work amongst Gravesham and <strong>Dartford</strong> residents than in <strong>the</strong> rest <strong>of</strong> <strong>the</strong><br />
Sou<strong>the</strong>ast <strong>of</strong> England (Walking 7% - 8%; Cycle 1% compared with 10% and 3%<br />
respectively), so that extra effort may need to be put into promoting <strong>the</strong>se modes.<br />
To put in context <strong>the</strong> wider transport mode split journeys to work is around 4% in<br />
<strong>Dartford</strong> and 9% in Gravesend for bus travel, whilst rail is around 15% in <strong>Dartford</strong><br />
and 8% in Gravesend. Car travel to work dominates and is about 60% in both<br />
boroughs.<br />
<strong>Dartford</strong> and Gravesend town centres both have similar characteristics in that <strong>the</strong>y<br />
each have a pedestrianised core surrounded by roads carrying relatively high<br />
volumes <strong>of</strong> fast moving traffic which severs <strong>the</strong> town centre from its surroundings. In<br />
<strong>Dartford</strong>’s case severance is exacerbated by a number <strong>of</strong> unwelcoming subways,<br />
ra<strong>the</strong>r than at grade crossings on key desire lines. However both <strong>Dartford</strong> and<br />
Gravesham are reviewing <strong>the</strong> town centre layouts and plans are being developed to<br />
improve <strong>the</strong> local environment.<br />
KTS <strong>Transport</strong> <strong>Strategy</strong> - Technical Summary Final October 2008.doc / Oct-08 2-11
National Cycle Route 1 runs east-west through <strong>Kent</strong> <strong>Thameside</strong> following <strong>the</strong> A2<br />
Trunk Road for much <strong>of</strong> its length. Although it serves both town centres, members <strong>of</strong><br />
<strong>the</strong> public have identified a number <strong>of</strong> problems associated with cycling in <strong>Kent</strong><br />
<strong>Thameside</strong>. In and around <strong>Dartford</strong> town centre <strong>the</strong>se include roads that are heavily<br />
trafficked or crowded with parked cars, a pedestrianised High Street and a series <strong>of</strong><br />
short hills to <strong>the</strong> east and to a lesser extent to <strong>the</strong> west. Gravesend has <strong>the</strong> potential<br />
for a useful cycle network on strategic links outside <strong>the</strong> town centre. Principal among<br />
<strong>the</strong>se are <strong>the</strong> A226 Thames Way and A226 Rochester Road.<br />
However <strong>the</strong>re are not yet any cycle-friendly connections into <strong>the</strong> town centres apart<br />
from one route alongside <strong>the</strong> River Thames, and <strong>the</strong>re is also a lack <strong>of</strong> cycle parking<br />
at a number <strong>of</strong> key locations as well as little provision for storage <strong>of</strong> associated<br />
equipment.<br />
The ‘Green Grid’ is an important concept for <strong>Kent</strong> <strong>Thameside</strong>. First introduced by<br />
RPG 9a, its objective is to join <strong>the</strong> primary green spaces with a continuous<br />
pedestrian and cyclist path adjacent to <strong>the</strong> River Thames, with improved links to<br />
existing communities and new links to and through new development sites. The<br />
Green Grid concept is already being energetically promoted and developed by<br />
<strong>Dartford</strong> and Gravesham Boroughs and when complete is expected to comprise an<br />
extensive framework <strong>of</strong> attractive open spaces, linked by green corridors, footpaths<br />
and parkland. This is shown in Figure 2-2.<br />
The Public Rights <strong>of</strong> Way (PROW) network in <strong>Kent</strong> <strong>Thameside</strong> consists <strong>of</strong> 111.8km<br />
<strong>of</strong> footpaths, 3.7km <strong>of</strong> bridleways and 5.8km <strong>of</strong> byways. Some <strong>of</strong> <strong>the</strong>se are long<br />
distance paths such as <strong>the</strong> Weald Way and Darent Valley Path, while o<strong>the</strong>rs provide<br />
short links to <strong>the</strong> riverside or open green space. O<strong>the</strong>r important focal points for<br />
leisure walking and cycling include <strong>the</strong> North Downs, a series <strong>of</strong> country parks, such<br />
as <strong>the</strong> Cobham Shorne Countryside Partnership and town centre facilities such as<br />
Central Park, <strong>Dartford</strong> and <strong>the</strong> Riverside Leisure Area, Gravesend.<br />
KTS <strong>Transport</strong> <strong>Strategy</strong> - Technical Summary Final October 2008.doc / Oct-08 2-12
Figure 2-2: <strong>Kent</strong> <strong>Thameside</strong> Green Grid (Source: Landscape Design Associates)<br />
KTS <strong>Transport</strong> <strong>Strategy</strong> - Technical Summary Final October 2008.doc / Oct-08 2-13
2.5 Air Quality and Noise<br />
<strong>Dartford</strong> Borough Council and Gravesham Borough Council have identified areas<br />
within <strong>Kent</strong> <strong>Thameside</strong> where air quality is considered to be poor and <strong>the</strong><br />
measurements <strong>of</strong> NO 2 and PM 10 are likely to be close to or exceed national Air<br />
Quality Management Area (AQMA) limits. Areas identified include <strong>the</strong> town centres,<br />
<strong>the</strong> A2 and A282 trunk roads, Northfleet Industrial area, A226 London Road and<br />
Bean Interchange. Once an AQMA has been declared, <strong>the</strong> Local Authority must<br />
produce an Air Quality Action Plan and work with Partner Agencies to seek an<br />
improvement in air quality. Traffic noise is also a relevant environmental concern<br />
for <strong>the</strong> Local Authorities.<br />
The <strong>Transport</strong> <strong>Strategy</strong> <strong>the</strong>refore needs to take full account <strong>of</strong> <strong>the</strong> AQMAs and<br />
Action Plans already identified by <strong>the</strong> Local Authorities, and use <strong>the</strong>m as a basis for<br />
an Air Quality Action Plan for KTS as a whole.<br />
A number <strong>of</strong> measures ei<strong>the</strong>r proposed or under consideration in <strong>the</strong> <strong>Transport</strong><br />
<strong>Strategy</strong> that could improve air quality and/or noise include <strong>the</strong> following:<br />
• A targeted parking strategy that takes into account accessibility to<br />
encourage a modal shift away from <strong>the</strong> private car.<br />
• Intelligent transport schemes (ITS) like variable message signing to car<br />
parks to reduce wasteful journeys and to avoid congestion.<br />
• Traffic management schemes to decongest <strong>the</strong> town centre areas such as<br />
schemes to discourage through traffic.<br />
• Variable speed limits such as on <strong>the</strong> trunk roads have proven to be a very<br />
effective means <strong>of</strong> reducing congestion.<br />
• Selective network improvements to remove bottlenecks at congestion<br />
hotspots.<br />
• Road pricing as part <strong>of</strong> a demand management strategy.<br />
• Reduced car trips by encouraging alternative modes and more car sharing<br />
through travel plans and o<strong>the</strong>r demand management initiatives.<br />
• <strong>Development</strong> policies that discourage long distance trips by containing<br />
housing and jobs locally.<br />
KTS <strong>Transport</strong> <strong>Strategy</strong> - Technical Summary Final October 2008.doc / Oct-08 2-14
3 <strong>Development</strong> <strong>of</strong> <strong>the</strong> <strong>Transport</strong> <strong>Strategy</strong><br />
3.1 Introduction<br />
There are major development proposals and associated transport schemes<br />
proposed for <strong>the</strong> <strong>Kent</strong> <strong>Thameside</strong> area in <strong>the</strong> next 20 years. The South East Plan<br />
prepared by SEERA provides <strong>the</strong> statutory framework for <strong>the</strong> regeneration <strong>of</strong> <strong>the</strong><br />
<strong>Kent</strong> <strong>Thameside</strong> area with a target <strong>of</strong> 25,000 new homes and 50,000 new jobs by<br />
<strong>the</strong> year 2026. The details <strong>of</strong> <strong>the</strong> forecast land use is based on a spreadsheet<br />
database provided by Gravesham and <strong>Dartford</strong> Borough Councils which provides a<br />
best guess estimate <strong>of</strong> <strong>the</strong> projected number <strong>of</strong> houses and Gross Floor Area (GFA)<br />
<strong>of</strong> commercial development by location in <strong>the</strong> <strong>Kent</strong> <strong>Thameside</strong> area for 2011, 2018<br />
and 2025. The land use estimate is being refined as <strong>the</strong> LDF process develops and<br />
many <strong>of</strong> <strong>the</strong> sites already have planning permission.<br />
Of transport schemes identified by <strong>the</strong> <strong>Strategy</strong>, some are committed with a secured<br />
funding source. O<strong>the</strong>rs are part <strong>of</strong> <strong>the</strong> Strategic <strong>Transport</strong> Investment Package<br />
Schemes (STIPS) which are not yet committed but are seen as enabler schemes to<br />
underpin <strong>the</strong> development and need to be fur<strong>the</strong>r developed. All <strong>the</strong> schemes will<br />
be described in this chapter.<br />
<strong>Transport</strong> modelling and forecasting studies have been conducted to assess future<br />
transport demand and network performance and details are provided in Appendix A.<br />
To support <strong>the</strong> transport modelling appropriate transport schemes and demand<br />
management solutions need to be investigated and analysed and <strong>the</strong>se are<br />
described in this chapter.<br />
3.2 Forecasts <strong>of</strong> Land Use and Trip Generation<br />
The <strong>Kent</strong> <strong>Thameside</strong> <strong>Development</strong> Area will eventually comprise approximately 60<br />
separate developments spread over a large area <strong>of</strong> predominantly former industrial<br />
land between <strong>Dartford</strong> and Gravesend. The key development locations are<br />
highlighted in Figure 1.1. Some <strong>of</strong> <strong>the</strong> more significant developments in <strong>the</strong> area are<br />
Eastern Quarry, Ebbsfleet, Northfleet West Sub Station, Swanscombe Peninsula,<br />
Northfleet Embankment, The Bridge, Ingress Park, Stone Gate – St James Lane Pit,<br />
Waterstone Park, and North East Gravesend (including <strong>the</strong> Canal Basin). A number<br />
<strong>of</strong> <strong>the</strong>se schemes are mixed use development comprising both residential dwellings<br />
and employment and some <strong>of</strong> <strong>the</strong> bigger developments will also include schools,<br />
hotels and retail. The idea is for dwellings and jobs and services to be provided<br />
locally to reduce <strong>the</strong> need for long distance work, education and o<strong>the</strong>r utility trips.<br />
Details <strong>of</strong> <strong>the</strong> individual developments are obtainable from <strong>the</strong> Local Planning<br />
Authorities, GBC and DBC.<br />
<strong>Development</strong> forecasts used for <strong>the</strong> transport assessment; focus on an assessment<br />
date <strong>of</strong> 2025, when <strong>the</strong> development will be largely in place (SEERA planning date<br />
is 2026). <strong>Development</strong> forecasts have also been developed for <strong>the</strong> interim years <strong>of</strong><br />
2011 and 2018. The SEERA planning framework acts as a control over <strong>the</strong> forecast<br />
development schedule. A delivery programme for transport schemes over <strong>the</strong> next<br />
20 years is still being developed, and this will need to reflect more detailed phasing<br />
<strong>of</strong> <strong>the</strong> developments currently being reviewed by Gravesham and <strong>Dartford</strong> Borough<br />
Councils.<br />
KTS <strong>Transport</strong> <strong>Strategy</strong> - Technical Summary Final October 2008.doc / Oct-08 3-1
The number <strong>of</strong> trips, and hence <strong>of</strong> vehicle movements, forecast in <strong>the</strong> transport<br />
model to arise from each new development are derived from TRICS® 2007a. This<br />
is a transport database <strong>of</strong> observed traffic movements taken at a large number <strong>of</strong><br />
actual development sites in <strong>the</strong> UK. A review <strong>of</strong> <strong>the</strong> trip generation from <strong>the</strong> TRICS<br />
database was carried out in 2007 and a list <strong>of</strong> <strong>the</strong> forecast land use developments<br />
and associated PM traffic generations are shown in Table 3.1 for <strong>the</strong> forecast 2011<br />
and 2025 development scenarios. Note 2011 is assumed to represent <strong>the</strong> early<br />
opening phase <strong>of</strong> <strong>the</strong> development and 2025 is <strong>the</strong> end phase. The transport<br />
assessment in this report is more focussed on <strong>the</strong> weekday PM peak which is <strong>the</strong><br />
worst time period for overall traffic conditions in <strong>the</strong> KTS area.<br />
The existing developments and trips in <strong>the</strong> KTS area are also shown in Table 3.1 to<br />
put in context <strong>the</strong> scale <strong>of</strong> <strong>the</strong> 2011 and 2025 proposed developments. It is <strong>the</strong> 2025<br />
development scenario which determines <strong>the</strong> overall scale <strong>of</strong> transport schemes<br />
required whilst <strong>the</strong> interim years help to determine <strong>the</strong> timing for <strong>the</strong>se schemes.<br />
The timing <strong>of</strong> schemes will be reviewed in fur<strong>the</strong>r versions <strong>of</strong> <strong>the</strong> transport strategy<br />
when fur<strong>the</strong>r information is provided by developers and more detailed work is<br />
conducted on <strong>the</strong> likely build rate <strong>of</strong> <strong>the</strong> various developments.<br />
Table 3.1: Comparison <strong>of</strong> KTS Existing and Future Land Use and Trip<br />
Generations (PM Peak)<br />
Scenario Households GFA (m²) Departure Arrival<br />
Trips Trips<br />
2005 Existing KTS<br />
<strong>Development</strong>s<br />
75,165 1,719,000 29,500 28,700<br />
2011 KTS<br />
Proposed<br />
9,654 555,000 6,700 5,100<br />
<strong>Development</strong>s<br />
2025 KTS<br />
Proposed<br />
<strong>Development</strong>s<br />
25,150 1,490,000 19,600 14,800<br />
Total for 2011 84,819 2,274,000 36,200 33,800<br />
Total for 2025 100,315 3,209,000 49,100 43,500<br />
Notes:<br />
GFA is <strong>the</strong> Gross Floor Area in square metres for commercial development.<br />
The Departure Trips are <strong>the</strong> 3 hour average hourly vehicular trips departing <strong>the</strong> KTS area and <strong>the</strong> Arrival Trips are <strong>the</strong> 3<br />
hour average hourly vehicular trips arriving in <strong>the</strong> KTS area.<br />
Through traffic is excluded from <strong>the</strong> trips.<br />
Existing household figures are from <strong>the</strong> 2001 census and Existing GFA are extracted from National Statistics whilst 2025<br />
are extracted from <strong>the</strong> Local Authorities estimate.<br />
Existing departure and arrival trips are extracted from <strong>the</strong> 2005 KTS Model<br />
2025 departure and arrival trips are extracted from <strong>the</strong> forecast land use schedule provided by <strong>the</strong> Local Authorities fed<br />
into <strong>the</strong> TRICS database.<br />
The PM peak is <strong>the</strong> worst-case scenario.<br />
Table 3.1 shows that <strong>the</strong> proposed KTS developments will increase households in<br />
<strong>the</strong> area by just over 10% in 2011 whilst commercial floor area will increase by<br />
about 25%. However <strong>the</strong> overall transport infrastructure for <strong>the</strong> KTS area will be<br />
determined by <strong>the</strong> end phase around 2025 when <strong>the</strong> full development is in place.<br />
By 2025 households will increase by about a third compared with today whilst<br />
commercial gross floor area will almost double in <strong>the</strong> area. In <strong>the</strong> PM peak<br />
departure trips are more driven by commercial development as people leave work<br />
places and though <strong>the</strong> commercial development would have almost doubled by<br />
2025 <strong>the</strong> associated trips generated is only expected to increase by about 65%.<br />
This reflects <strong>the</strong> growing trend in <strong>the</strong> UK towards more restrictive car policies which<br />
is being captured in <strong>the</strong> TRICS trip generation database on which <strong>the</strong> 2025 forecast<br />
trips are based. The trips generated for 2025 are probably still at <strong>the</strong> higher end <strong>of</strong><br />
KTS <strong>Transport</strong> <strong>Strategy</strong> - Technical Summary Final October 2008.doc / Oct-08 3-2
<strong>the</strong> likely forecast as <strong>the</strong>y reflect trip rates from existing development sites in TRICS.<br />
It is expected over time as more travel plans and restrictive car policies get filtered<br />
into development planning <strong>the</strong> average trip rates in TRICS for developments will<br />
fur<strong>the</strong>r decrease. The arrival trips are about half <strong>the</strong> existing trips for <strong>the</strong> KTS area<br />
with <strong>the</strong> 2025 developments and this will be driven by <strong>the</strong> residential developments<br />
and some <strong>of</strong> <strong>the</strong> commercial development for <strong>the</strong> PM peak like <strong>the</strong> retail centres.<br />
3.3 <strong>Transport</strong> Schemes<br />
The schemes included in <strong>the</strong> <strong>Transport</strong> <strong>Strategy</strong> can be broken down into two<br />
groups. These are 1) already committed schemes; and 2) <strong>the</strong> package <strong>of</strong> additional<br />
schemes identified as likely to be necessary to underpin <strong>the</strong> KTS <strong>Development</strong>s.<br />
The latter group are referred to as <strong>the</strong> Strategic <strong>Transport</strong> Investment Package<br />
Schemes (STIPS) and have been developed through analysis and transport<br />
modelling work and will be discussed fur<strong>the</strong>r below. The STIPS schemes are still<br />
being developed and may be subject to review and fur<strong>the</strong>r iterations as <strong>the</strong> transport<br />
strategy develops.<br />
3.4 Committed <strong>Transport</strong> Schemes<br />
Across <strong>the</strong> South East region <strong>the</strong>re has been a significant investment and<br />
commitment <strong>of</strong> funding for a number <strong>of</strong> major strategic and regional schemes. Table<br />
3.2 is a list <strong>of</strong> all <strong>the</strong> known schemes ei<strong>the</strong>r located in <strong>Kent</strong> <strong>Thameside</strong> or<br />
considered to have an impact on <strong>the</strong> area, which have committed funding. These do<br />
not include <strong>the</strong> schemes prioritised separately as part <strong>of</strong> <strong>the</strong> Strategic <strong>Transport</strong><br />
Investment Package Schemes discussed later in this chapter. Figure 1.1 shows <strong>the</strong><br />
location <strong>of</strong> <strong>the</strong> major committed transport schemes for <strong>the</strong> area, note <strong>the</strong> rail<br />
schemes are ei<strong>the</strong>r not shown or only partially shown on Figure 1.1 as <strong>the</strong>y extend<br />
way beyond <strong>the</strong> KTS area.<br />
Table 3.2: Committed <strong>Transport</strong> Schemes<br />
Scheme<br />
Estimated Funding Source Delivery*<br />
Cost (£m)<br />
Local Public <strong>Transport</strong>, Walking and Cycling<br />
Local <strong>Transport</strong> Plan (LTP) Pedestrian/<br />
Cycle improvements<br />
1.65 LTP Short-term<br />
Fastrack Thames Way 10.03 Government Short-term<br />
Fastrack Everard’s Link Phase 2 5.24<br />
Government/<br />
Developer<br />
Short-term<br />
Fastrack The Bridge 30.00 Developer Completed<br />
Fastrack Ebbsfleet 19.50 Developer Short-term<br />
Fastrack Ingress Park 3.00 Developer Short-term<br />
Greenhi<strong>the</strong> Station 3.00 Network Rail Short-term<br />
<strong>Dartford</strong>, Northfleet and Gravesend<br />
station improvements<br />
15.00 Government Short-term<br />
Fastrack Eastern Quarry 14.75 Developer Medium-term<br />
Sub total 102.17<br />
Rail schemes<br />
Channel Tunnel Rail Link (HS 1) 5900 LCR / Government<br />
Crossrail 16000<br />
Government/<br />
Business<br />
Infrastructure<br />
Completed<br />
Long-term<br />
KTS <strong>Transport</strong> <strong>Strategy</strong> - Technical Summary Final October 2008.doc / Oct-08 3-3
Sub total 21,900<br />
Local Highway schemes<br />
M25 Junction 1b to 3 Improvement 65.94 HA Near completion<br />
A2 Trunk Road / A282 Improvement 120.00 HA Completed<br />
A2 Trunk Road Bean to Cobham 122.00 HA Near completion<br />
Sub total 307.94<br />
Overall total 22,310.11<br />
* Short Term schemes are those that are to be implemented by 2011, Medium Term by 2018 and Long Term by 2026. Near<br />
completion are schemes that are scheduled to finish in 2008.<br />
Crossrail is a major rail scheme recently approved by Government and <strong>the</strong> current<br />
plan is that it will terminate at Abbey Wood in South East London, just outside <strong>the</strong><br />
<strong>Kent</strong> <strong>Thameside</strong> area. The Crossrail route is safeguarded by <strong>the</strong> Department for<br />
<strong>Transport</strong> for extension into <strong>the</strong> <strong>Kent</strong> <strong>Thameside</strong> area up to Hoo Junction (to <strong>the</strong><br />
east <strong>of</strong> Gravesend).<br />
Capital costs shown in Table 3.2 appear to be dominated by <strong>the</strong> rail schemes;<br />
however this is partly because <strong>the</strong> rail schemes are more regional in nature with<br />
benefits and expenditure extending well beyond <strong>the</strong> KTS area.<br />
A number <strong>of</strong> o<strong>the</strong>r public transport initiatives are also highly likely in <strong>the</strong> area, and<br />
<strong>the</strong>se can be summarised as follows:<br />
• 2008/9 National smart card scheme for buses (driven by national concessionary<br />
scheme).<br />
• 2009 Update <strong>of</strong> Sou<strong>the</strong>astern Railway’s timetable with <strong>the</strong> introduction <strong>of</strong> <strong>the</strong><br />
HS1 Domestic services to London St Pancras.<br />
• 2014 Current Sou<strong>the</strong>astern Railway’s franchise ends.<br />
• O<strong>the</strong>r rail schemes and initiatives emerging from Network Rail RUS studies.<br />
No improvements to bus capacity in <strong>the</strong> area proposed have been identified except<br />
for <strong>the</strong> Fastrack bus services and <strong>the</strong> o<strong>the</strong>r bus services are assumed to continue as<br />
today in <strong>the</strong> model forecasting. No changes are assumed ei<strong>the</strong>r for <strong>the</strong> coach<br />
services in <strong>the</strong> KTS area which are also included in <strong>the</strong> KTS Model.<br />
Table 3.2 includes only <strong>the</strong> larger <strong>of</strong> <strong>the</strong> various committed transport schemes<br />
funded by developers promoted through <strong>the</strong> standard Section 106 agreements, and<br />
only <strong>the</strong>se larger schemes have been included in <strong>the</strong> modelling work.<br />
3.5 Individual Elements <strong>of</strong> <strong>the</strong> <strong>Transport</strong> <strong>Strategy</strong><br />
In early 2007 <strong>the</strong> KTS <strong>Transport</strong> Group was tasked with developing in more detail<br />
<strong>the</strong> transport strategy for <strong>the</strong> area and various transport studies were commissioned<br />
for <strong>the</strong> KTS area to investigate <strong>the</strong> following topics:<br />
• Demand Management<br />
• Public <strong>Transport</strong><br />
• Walking and cycling<br />
• Parking<br />
• Urban Traffic Management & Control (UTMC)<br />
• Wider Traffic Management<br />
• Trunk Road Management<br />
KTS <strong>Transport</strong> <strong>Strategy</strong> - Technical Summary Final October 2008.doc / Oct-08 3-4
More detailed reports are available on each <strong>of</strong> <strong>the</strong>se elements and references are<br />
provided in Appendix E.<br />
From <strong>the</strong>se various studies, action plans were drawn up to fur<strong>the</strong>r develop <strong>the</strong><br />
transport strategy in downstream work - see Appendix C. It should be noted <strong>the</strong>se<br />
were outline studies discussing broad strategies to take forward into more detailed<br />
work and <strong>the</strong> action plans reflect this. Where sufficient work has been done to work<br />
up a scheme <strong>the</strong>n by and large <strong>the</strong>se have been included in <strong>the</strong> KTS <strong>Transport</strong><br />
Model for scheme assessment which is discussed in <strong>the</strong> Appendix A.<br />
An accessibility strategy remains to be developed to refine <strong>the</strong> <strong>Transport</strong> <strong>Strategy</strong> so<br />
that no groups are disadvantaged by <strong>the</strong> transport and demand management<br />
solutions so far proposed. This study should make reference to <strong>the</strong> Accessibility<br />
<strong>Strategy</strong> for <strong>Kent</strong> (ASK) and will be a key action in coming months.<br />
3.5.1 Demand Management<br />
Travel Demand Management is a relatively new approach to travel issues that has<br />
developed over <strong>the</strong> last 20 years. Instead <strong>of</strong> planners assuming that economic<br />
development and increased prosperity will inevitably be accompanied by a<br />
proportionate increase in traffic on <strong>the</strong> roads – <strong>the</strong> ‘Predict and Provide’ approach <strong>of</strong><br />
<strong>the</strong> nineteen sixties and seventies - <strong>the</strong>y aim instead to manage <strong>the</strong> travel needs<br />
associated with any given level <strong>of</strong> development. Demand management involves<br />
maximising <strong>the</strong> efficient use <strong>of</strong> <strong>the</strong> network and ensuring users make a well informed<br />
decision <strong>of</strong> <strong>the</strong> travel options open to <strong>the</strong>m. It aims to discourage use <strong>of</strong> <strong>the</strong> private<br />
car by encouraging more sustainable modes <strong>of</strong> travel such as walking, cycling and<br />
use <strong>of</strong> public transport.<br />
Demand Management is a two pronged approach. On <strong>the</strong> one hand it aims to<br />
reduce <strong>the</strong> need to travel (by, for instance locating key services close to residential<br />
areas and encouraging initiatives such as video conferencing and tele-working). On<br />
<strong>the</strong> o<strong>the</strong>r it aims to reduce <strong>the</strong> congestion and pollution resulting from <strong>the</strong> trips that<br />
remain necessary by encouraging development in locations accessible by public<br />
transport, by improving walking and cycling networks and by introducing workplace<br />
and school Travel Plans, car sharing and individual travel marketing backed up,<br />
where appropriate, by controls on parking.<br />
Based on empirical research from Department for <strong>Transport</strong> and o<strong>the</strong>rs, and<br />
experiences from o<strong>the</strong>r towns in <strong>the</strong> UK, a suggested range <strong>of</strong> KTS demand<br />
management initiatives, with possible indicative trip reduction benefits, are shown in<br />
Table 3.3. In reading <strong>the</strong> table it should be noted that:<br />
• The trip reductions in Table 3.3 are averages, and will vary between<br />
different sites depending on location, land use, accessibility and a<br />
number <strong>of</strong> o<strong>the</strong>r factors.<br />
• Different degrees <strong>of</strong> trip reduction are likely to be achieved in new<br />
developments and in existing developments (where it is generally<br />
harder to influence travel patterns). These are <strong>the</strong>refore shown<br />
separately in <strong>the</strong> table.<br />
• Initiatives centred on improved walking and cycling will only impact<br />
shorter journeys so again are shown separately.<br />
Trip reductions will also vary between journey purpose, for instance between home<br />
and work based trips. Percentages shown in <strong>the</strong> table apply only to <strong>the</strong> particular<br />
journey type referenced. For this reason percentage reductions in a particular<br />
KTS <strong>Transport</strong> <strong>Strategy</strong> - Technical Summary Final October 2008.doc / Oct-08 3-5
journey type achieved by different Demand Management measures will be<br />
cumulative, however <strong>the</strong> overall reduction attributable to a particular measure (car<br />
clubs for example) will be a weighted average <strong>of</strong> <strong>the</strong> reductions achieved over <strong>the</strong><br />
different trip types.<br />
It is recommended that demand management trip reduction targets should be set for<br />
around 2018 or sooner taking into account <strong>the</strong> major development programme. It<br />
should be appreciated that more downstream detailed work will be needed to<br />
validate <strong>the</strong>se possible indicative trip reduction estimates for <strong>the</strong> KTS area as, while<br />
comparable examples have been sought, <strong>the</strong>y are based on demand reductions<br />
achieved in o<strong>the</strong>r locations. However, it illustrates what is possible with active<br />
demand management policies.<br />
It is noted that <strong>the</strong> potential trip rate reductions that can be achieved by wider<br />
Demand Management measures have not been incorporated into <strong>the</strong> transport<br />
modelling carried out to date. The existing forecasting can <strong>the</strong>refore be regarded<br />
as conservative in this respect. Once more detailed work has been carried out on<br />
<strong>the</strong> potential impact <strong>of</strong> demand management measures, <strong>the</strong> benefits <strong>of</strong> this<br />
approach can be incorporated in future modelling work.<br />
Table 3.3: Summary <strong>of</strong> Possible Demand Management Initiatives for <strong>the</strong> KTS<br />
Area<br />
Demand Sector<br />
(New <strong>Development</strong>s<br />
Only)<br />
Home Based Work<br />
Possible Car<br />
Trip<br />
Reduction<br />
Enabling Measure<br />
Employment<br />
developments<br />
15% Workplace Travel Plans<br />
Residential 5%<br />
Spill over benefits from investment<br />
and marketing in new walking and<br />
PT infrastructure<br />
Residential 2.5% Car Clubs<br />
Home Based O<strong>the</strong>r<br />
Residential 15% Residential Travel Plans<br />
Residential 2.5% Car Clubs<br />
Employers Business<br />
Employment<br />
developments<br />
15% Workplace Travel Plans<br />
Demand Sector<br />
(Existing<br />
<strong>Development</strong>s)<br />
Home Based Work<br />
Home Based Work -<br />
Local Trips within<br />
KTS<br />
Subcomponent<br />
Subcomponent<br />
Land uses that<br />
are not<br />
residential<br />
Possible Car<br />
Trip<br />
Reduction<br />
5%<br />
Enabling Measure<br />
Spill over benefits from investment<br />
and marketing in new walking and<br />
PT infrastructure<br />
All land uses 6% Investment in cycle infrastructure<br />
Home Based O<strong>the</strong>r<br />
Education 11%<br />
Land uses that<br />
are not<br />
residential<br />
6%<br />
Implementation <strong>of</strong> School Travel<br />
Plans<br />
Spill over benefits from new<br />
walking, cycling and PT<br />
investment and marketing<br />
KTS <strong>Transport</strong> <strong>Strategy</strong> - Technical Summary Final October 2008.doc / Oct-08 3-6
Demand Sector<br />
(Existing<br />
<strong>Development</strong>s)<br />
Subcomponent<br />
Possible Car<br />
Trip<br />
Reduction<br />
Enabling Measure<br />
Non Home based<br />
o<strong>the</strong>r<br />
All land uses 6%<br />
Spill over benefits from new<br />
walking, cycling and PT<br />
investment and marketing<br />
Home Based Work reflects people making journeys from home to work. Home Based O<strong>the</strong>r reflects people making journeys from<br />
home to shopping, leisure, education etc. Non Home based O<strong>the</strong>r reflects people making journeys from o<strong>the</strong>r locations outside <strong>the</strong>ir<br />
home to shopping, leisure, education etc. Employers Business reflects people travelling to o<strong>the</strong>r work locations which are not <strong>the</strong>ir<br />
normal place <strong>of</strong> work.<br />
Source: Jacobs (2007) <strong>Kent</strong> <strong>Thameside</strong> – Demand Management Summary Report<br />
It has to be recognised that it is simply impractical to develop a highway network<br />
that would allow all <strong>the</strong> trips generated by <strong>the</strong> future <strong>Kent</strong> <strong>Thameside</strong> area to be<br />
made by car, and that to facilitate <strong>the</strong> plans for <strong>the</strong> area a substantial degree <strong>of</strong><br />
modal shift to more sustainable modes will have to be achieved. At <strong>the</strong> same time<br />
<strong>the</strong>re needs to be a balance struck between encouraging sustainable transport<br />
modes on <strong>the</strong> one hand and maintaining accessibility on <strong>the</strong> o<strong>the</strong>r particularly for <strong>the</strong><br />
more rural areas to <strong>the</strong> south <strong>of</strong> <strong>the</strong> A2 Trunk Road.<br />
In this context it needs to be recognised that public transport provision is generally<br />
good for east – west movements within <strong>the</strong> KTS area but north-south movements<br />
are less well served. For longer distance traffic from widely dispersed areas across<br />
<strong>Kent</strong> and beyond <strong>the</strong> car will <strong>the</strong>refore <strong>of</strong> necessity continue to be <strong>the</strong> preferred<br />
mode. The continuing viability <strong>of</strong> existing town centre areas also has to be<br />
recognised as a key objective.<br />
There are also a number <strong>of</strong> more radical Demand Management initiatives, some<br />
currently beyond <strong>the</strong> control <strong>of</strong> <strong>the</strong> Local Authority, that if implemented could deliver<br />
traffic reduction benefits to KTS. These include national road pricing or road tolling,<br />
fuel price escalator taxes and environmental taxes. Note that <strong>the</strong> current Local<br />
<strong>Transport</strong> Bill in Parliament proposes updating existing legal powers so that, where<br />
local areas wish to develop proposals for local road pricing schemes, <strong>the</strong>y will have<br />
<strong>the</strong> freedom and flexibility to do so, whilst ensuring <strong>the</strong> scheme is consistent and<br />
interoperable. Currently road pricing is not politically acceptable to <strong>the</strong> local<br />
authorities in <strong>the</strong> <strong>Kent</strong> area so this is more likely to be introduced on <strong>the</strong> trunk road<br />
network where it will be driven by Central Government.<br />
3.5.2 Public <strong>Transport</strong><br />
Public transport is central to <strong>the</strong> <strong>Kent</strong> <strong>Thameside</strong> development, and managing<br />
congestion in <strong>the</strong> area. Rail based transport is <strong>the</strong> most efficient means <strong>of</strong> mass<br />
movement <strong>of</strong> people. Similarly a bus is a very efficient user <strong>of</strong> road space and takes<br />
up <strong>the</strong> equivalent <strong>of</strong> around 2 cars but can carry <strong>the</strong> equivalent <strong>of</strong> around 12 cars in<br />
passengers. Therefore in <strong>the</strong> future planning <strong>of</strong> transport in <strong>the</strong> KTS area and for<br />
tackling congestion it is important to prioritise public transport over <strong>the</strong> private car. It<br />
is for this reason <strong>the</strong> <strong>Kent</strong> <strong>Thameside</strong> <strong>Transport</strong> Model was converted from a<br />
highway model to a multi-modal transport model with a public transport module<br />
added so <strong>the</strong> wider planning <strong>of</strong> transport in <strong>the</strong> area can be advanced to tackle<br />
congestion and to develop <strong>the</strong> public transport planning aspect <strong>of</strong> <strong>the</strong> development<br />
namely Fastrack. Fur<strong>the</strong>r details on this model are provided in Appendix A.<br />
A number <strong>of</strong> options for future development over <strong>the</strong> period to 2018 and beyond<br />
have been identified to improve public transport that go beyond <strong>the</strong> already<br />
significant improvements expected from additional Fastrack bus and rail services;<br />
KTS <strong>Transport</strong> <strong>Strategy</strong> - Technical Summary Final October 2008.doc / Oct-08 3-7
many <strong>of</strong> <strong>the</strong>se require fur<strong>the</strong>r discussion with stakeholders (e.g. land owners) before<br />
<strong>the</strong>y can be implemented. These schemes and options fall under <strong>the</strong> following<br />
categories:<br />
• Marketing public transport<br />
• Bus and train services<br />
• Vehicle design/ buses<br />
• Infrastructure / interchange<br />
• Safety and security<br />
• Information<br />
• Ticketing<br />
• Highways, including bus priority<br />
• Park and ride<br />
• Partnerships and working arrangements<br />
• Taxis<br />
Details <strong>of</strong> <strong>the</strong> strategy public transport action plans under each <strong>of</strong> <strong>the</strong> headings<br />
described above are provided in Appendix C.<br />
The public transport strategy will need to ensure that <strong>the</strong> public transport network<br />
should be marketed as a whole, with different grades <strong>of</strong> service, <strong>the</strong> highest <strong>of</strong> which<br />
will be Fastrack. This will integrate <strong>the</strong> public transport services as a product worthy<br />
<strong>of</strong> use for local residents and those visiting <strong>the</strong> area. Fastrack remains at <strong>the</strong> centre<br />
<strong>of</strong> <strong>the</strong> public transport strategy and <strong>the</strong> various routes proposed are listed in Table<br />
3.2 and <strong>the</strong> location <strong>of</strong> <strong>the</strong> routes is shown in Figure 2.1. A strategy objective will be<br />
to work with partners and service providers for a wholesale review <strong>of</strong> bus services in<br />
<strong>Kent</strong> <strong>Thameside</strong> to ensure <strong>the</strong> entire service is brought up to a minimum standard<br />
and does not allow non-Fastrack services to be neglected.<br />
On rail, HS 1 Domestic Services remains <strong>the</strong> core railway improvement in <strong>the</strong> KTS<br />
area with <strong>the</strong> new services starting in late 2009. This will provide a step change in<br />
rail capacity into Central London with a journey time saving <strong>of</strong> around 45 minutes<br />
from <strong>the</strong> Gravesham area over <strong>the</strong> classic routes. However <strong>the</strong> proposed<br />
Thameslink service to <strong>Dartford</strong> has now been dropped following <strong>the</strong> South London<br />
Route Utilisation <strong>Strategy</strong> published in March 2008. In addition <strong>the</strong> RUS<br />
recommendation is that <strong>the</strong> <strong>Dartford</strong> to Victoria line remains an 8-car service with<br />
<strong>the</strong> option to extend to a 10-car or 12-car service in <strong>the</strong> future. The RUS rail review<br />
was conducted by Network Rail to meet <strong>the</strong> challenges <strong>of</strong> overcrowding and<br />
facilitate <strong>the</strong> continued growth that <strong>the</strong> railway now faces.<br />
3.5.3 Walking and Cycling<br />
The <strong>Kent</strong> <strong>Thameside</strong> Walking and Cycling strategy has focussed both on <strong>the</strong><br />
existing infrastructure and what can be done to make a difference to existing<br />
residents and communities, and on how new developments can be best linked to <strong>the</strong><br />
existing spatial pattern and what more needs to be done to ensure that walking and<br />
cycling is <strong>the</strong> first choice for people for short journeys in <strong>Kent</strong> <strong>Thameside</strong>.<br />
Reducing <strong>the</strong> need to use <strong>the</strong> car for everyday trips to work, school and <strong>the</strong> shops<br />
by creating a high quality walk and cycle environment is a key part <strong>of</strong> <strong>the</strong> strategy,<br />
however <strong>the</strong> strategy also aims to promote and increase levels <strong>of</strong> leisure walking<br />
and cycling. It is important that <strong>the</strong> network continues to be maintained and<br />
enhanced especially where new developments have <strong>the</strong> opportunity to link in to <strong>the</strong><br />
KTS <strong>Transport</strong> <strong>Strategy</strong> - Technical Summary Final October 2008.doc / Oct-08 3-8
network and help achieve <strong>the</strong> objective <strong>of</strong> a comprehensive Green Grid network<br />
within <strong>Kent</strong> <strong>Thameside</strong> as detailed in section 2.4.<br />
The long term objective <strong>of</strong> <strong>the</strong> strategy is to provide a reasonably direct, hub and<br />
spoke type routes into <strong>the</strong> town centres as well as o<strong>the</strong>r key locations linking in<br />
where possible with <strong>the</strong> ‘Green Grid’ proposals. The cycle network schemes have<br />
been developed into three categories; low cost and committed proposals that are<br />
effectively quick wins and will deliver a ‘bronze standard’ network. Medium cost<br />
proposals and/or schemes with some minor issues that would be needed to deliver<br />
a ‘silver standard’ service. Finally <strong>the</strong>re are <strong>the</strong> higher cost proposals and/or<br />
schemes with some major issues at this stage; <strong>the</strong>se would deliver a ‘gold standard’<br />
cycle network. These different graded schemes are described in <strong>the</strong> <strong>Kent</strong><br />
<strong>Thameside</strong> Walking and Cycling <strong>Strategy</strong> report referenced in Appendix E. It is<br />
expected funding will be prioritised using <strong>Kent</strong> County Council’s PIPKIN appraisal<br />
tool.<br />
A walking and cycling summary action plan is provided in Appendix C.<br />
3.5.4 Parking<br />
Parking controls, installation, management and enforcement within <strong>the</strong> county <strong>of</strong><br />
<strong>Kent</strong> is a devolved highway function carried out by <strong>the</strong> 12 Districts under licence<br />
agreements with <strong>Kent</strong> County Council. Whilst each <strong>of</strong> <strong>the</strong> District Councils operates<br />
as a separate entity <strong>the</strong>y do all work to agreed county wide policies and have to get<br />
approval for any schemes from <strong>Kent</strong> County Council. Although each individual<br />
District may have localised problems and solutions <strong>the</strong>y do also recognise <strong>the</strong> need<br />
to fit into a wider strategic objective including <strong>the</strong> KTS <strong>Transport</strong> <strong>Strategy</strong><br />
The <strong>Kent</strong> <strong>Thameside</strong> Parking <strong>Strategy</strong> is essentially a high level evidence based<br />
study that identifies suitable parking action plans to support ambitious modal shift<br />
targets across <strong>the</strong> area by 2025. The results <strong>of</strong> this study are based upon <strong>the</strong><br />
development and trip assumptions included in <strong>the</strong> <strong>Kent</strong> <strong>Thameside</strong> <strong>Transport</strong> Model<br />
and assumed car trip reduction targets initiated by significant travel demand<br />
management measures and public transport improvements. It is acknowledged that<br />
<strong>the</strong> development assumptions and car trip reduction targets maybe subject to<br />
considerable change throughout <strong>the</strong> lifetime <strong>of</strong> this study. Regular reviews <strong>of</strong> this<br />
strategy will help to identify localities where <strong>the</strong> car trip reduction targets are in<br />
danger <strong>of</strong> rising above <strong>the</strong> expected levels and measures put in place to maintain<br />
<strong>the</strong> predicted targets.<br />
The overall aim <strong>of</strong> <strong>the</strong>se actions is to create a framework within which measures can<br />
be introduced to control and limit <strong>the</strong> number <strong>of</strong> vehicles entering <strong>the</strong> urban centres<br />
when o<strong>the</strong>r more sustainable modes <strong>of</strong> transport are available. It does, however,<br />
recognise that this is not always possible and provision must be made to cater for<br />
situations where it is not possible to make journeys o<strong>the</strong>r than by car and to<br />
encourage limited car based journeys to transport interchanges. It is important that<br />
o<strong>the</strong>r modes <strong>of</strong> transport such as cycling, bus and walking should be promoted to<br />
transport interchanges, e.g. railway stations.<br />
The study identifies a number <strong>of</strong> strategy options and parking action plans for<br />
existing town centres and future development up to 2011 and beyond, many <strong>of</strong><br />
which require fur<strong>the</strong>r consultation with key stakeholders. It is crucial that <strong>the</strong> timing<br />
<strong>of</strong> each <strong>of</strong> <strong>the</strong> options such as price increases, car park refurbishments and <strong>the</strong><br />
implementation <strong>of</strong> new control parking zones (CPZ) / residents’ schemes are closely<br />
controlled as each has a knock on effect on <strong>the</strong> o<strong>the</strong>r, possibly putting <strong>the</strong> whole<br />
KTS <strong>Transport</strong> <strong>Strategy</strong> - Technical Summary Final October 2008.doc / Oct-08 3-9
parking strategy at risk if <strong>the</strong> timings are incorrect. This is best developed at a local<br />
level to ensure that kerb space is correctly controlled before changes to <strong>of</strong>f street<br />
parking take place.<br />
The parking options fall under <strong>the</strong> following general categories:<br />
• Improving town centre parking<br />
• Pricing<br />
• Parking Standards<br />
• Travel Plans<br />
• Park and Ride<br />
• Third Party Parking<br />
• Cycle Parking<br />
Among measures that have been considered to restrain car use are <strong>the</strong> use <strong>of</strong> low<br />
levels <strong>of</strong> parking provision at new developments and a review <strong>of</strong> town centre parking<br />
charges. However <strong>the</strong>se general principles will need to be applied in <strong>the</strong> context <strong>of</strong><br />
a review <strong>of</strong> accessibility by non car means for particular locations / user groups.<br />
‘Park and ride’ is seen as a long term way <strong>of</strong> helping to manage car trip levels;<br />
fur<strong>the</strong>r work is required to ascertain whe<strong>the</strong>r or not it is feasible, and if so at which<br />
locations. The time scales and figures can be adjusted as appropriate. The Tollgate<br />
park and ride study is investigating <strong>the</strong> feasibility <strong>of</strong> a commuter coach park and ride<br />
site on <strong>the</strong> site <strong>of</strong> <strong>the</strong> old A2.<br />
A simultaneous and steady approach to <strong>the</strong> introduction <strong>of</strong> new parking controls,<br />
improvements in appearance and management <strong>of</strong> car parks as well as tightening <strong>of</strong><br />
residential parking standards in locations where alternative transport is easily<br />
accessible will make a significant contribution to achieving <strong>the</strong> car trip reduction<br />
targets. <strong>Dartford</strong> Borough Council has plans to rationalise <strong>the</strong> on-street parking<br />
around <strong>the</strong> local station for rail heading users by proposing a 120 space car park at<br />
Victoria Road. This will cater for <strong>the</strong> more rural areas to <strong>the</strong> south <strong>of</strong> <strong>the</strong> borough<br />
that need to rail head as public transport accessibility to <strong>the</strong> rail station is poor. The<br />
net effect is not to increase parking overall in <strong>the</strong> town centre as <strong>the</strong> scheme is more<br />
driven to improve <strong>the</strong> local environment and reduce on-street parking in residential<br />
areas.<br />
It needs to be recognised that some <strong>of</strong> <strong>the</strong> major parking sites in <strong>Kent</strong> <strong>Thameside</strong><br />
are not under <strong>the</strong> direct control <strong>of</strong> <strong>the</strong> Local Authorities and <strong>the</strong>re are o<strong>the</strong>r<br />
stakeholders involved in car parking; examples include Bluewater Shopping Centre,<br />
Darent Valley Hospital, Ebbsfleet Station and some <strong>of</strong> <strong>the</strong> car parks in <strong>the</strong> town<br />
centres. Gravesham Council recently transferred ownership <strong>of</strong> <strong>the</strong> car park at St<br />
Georges Shopping Centre to <strong>the</strong> owners <strong>of</strong> <strong>the</strong> centre with a similar arrangement<br />
also at <strong>the</strong> Thames Gateway Shopping Centre. Therefore for <strong>the</strong> parking policy to<br />
work a partnership arrangement is needed between private car park owners and <strong>the</strong><br />
Local Authority all working to a common objective.<br />
A parking summary action plan is provided in Appendix C.<br />
3.5.5 Urban Traffic Management & Control<br />
It is recommended that allowance is made for a dedicated Traffic Management<br />
Centre (TMC) within KTS, to which all proposed systems can be linked. In <strong>the</strong> short<br />
term, <strong>the</strong>se functions can be handled by <strong>the</strong> <strong>Kent</strong> Highway Services TMC in<br />
Maidstone, but with increasing development, local management <strong>of</strong> <strong>the</strong> traffic and<br />
information would be beneficial. The proposed TMC would use <strong>the</strong> same design<br />
KTS <strong>Transport</strong> <strong>Strategy</strong> - Technical Summary Final October 2008.doc / Oct-08 3-10
model and operational procedures as <strong>the</strong> KHS TMC. The TMC would house an<br />
Urban Traffic Management & Control (UTMC) common database with all system<br />
being controlled from this. Key Intelligent <strong>Transport</strong> Systems that require installation<br />
to allow effective operation are:<br />
• Variable Message Signs (VMS) on all strategic corridors to provide<br />
information to road users on congestion and forth coming events. A fur<strong>the</strong>r<br />
VMS network to guide vehicles to car parks is also proposed and has been<br />
proven to have a significant benefit on traffic movements.<br />
• A comprehensive network <strong>of</strong> Automatic Number Plate Recognition (ANPR)<br />
cameras forming an inner and outer cordon would allow <strong>the</strong> collection <strong>of</strong><br />
journey times and origin and destination data. Careful analysis would allow<br />
traffic patterns to be identified leading to implementation <strong>of</strong> effective<br />
strategies to manage congestion.<br />
• Closed Circuit Television Cameras (CCTV) to allow operators to view <strong>the</strong><br />
road network.<br />
• Implementation <strong>of</strong> traffic signal control systems such as SCOOT (Split Cycle<br />
Offset Optimisation Technique) and UTC (Urban Traffic Control) in areas<br />
such as <strong>Dartford</strong> town centre and Old Road in Gravesend, allowing<br />
coordination <strong>of</strong> traffic signals and changes to signal timing plans to be made<br />
remotely.<br />
• Real Time Information (RTI) to be provided at bus stops, shopping centres<br />
as well as via websites to enable travellers to prepare <strong>the</strong>ir journeys before<br />
setting out.<br />
• Alterations to <strong>the</strong> road network are proposed, ranging from <strong>the</strong> installation <strong>of</strong><br />
traffic signal controlled junctions at more junctions in <strong>the</strong> urban areas to<br />
revising <strong>the</strong> traffic flow in key parts <strong>of</strong> <strong>the</strong> urban area like <strong>the</strong> town centres.<br />
More details on a UTMC summary action plan is provided in Appendix C.<br />
3.5.6 Wider Local and Principal Road Traffic Management<br />
The KTS area can be subdivided into various distinct traffic areas which include <strong>the</strong><br />
<strong>Dartford</strong> and Gravesend town centre urban areas, <strong>the</strong> inter-urban area between<br />
<strong>Dartford</strong> and Gravesend which will contain <strong>the</strong> major new development areas such<br />
as Ebbsfleet Valley and <strong>the</strong> trunk road areas forming <strong>the</strong> A2 Trunk Road and <strong>the</strong><br />
M25 / A282. All <strong>of</strong> <strong>the</strong>se areas have different requirements in terms <strong>of</strong> traffic<br />
management. The traffic management strategy for <strong>the</strong> trunk roads is separately<br />
addressed under <strong>the</strong> trunk roads sub-section below.<br />
Both <strong>Dartford</strong> and Gravesham are involved in developing town centre transport<br />
schemes which revise <strong>the</strong> working <strong>of</strong> <strong>the</strong> local roads. These are being developed to<br />
make <strong>the</strong> environment more public transport and pedestrian friendly and not<br />
necessarily to enhance highway capacity. Micro-simulation models are being<br />
employed to help develop <strong>the</strong> town centre proposals. Both town centres are looking<br />
at making changes to <strong>the</strong>ir one-way gyratory systems however proposals are still at<br />
<strong>the</strong> development and evaluation phase.<br />
Along <strong>the</strong> A226 London Road corridor between <strong>Dartford</strong> and Gravesend a VISSIM<br />
traffic model was developed and from this a revised traffic signalling strategy is<br />
recommended for fur<strong>the</strong>r development. These schemes are reported in <strong>the</strong> 2007<br />
Jacobs Northwest <strong>Kent</strong> <strong>Thameside</strong> Micro-simulation <strong>Transport</strong> Model report<br />
referenced in Appendix E. It should be noted that all <strong>the</strong>se traffic management<br />
improvements will need more detailed work to verify <strong>the</strong> exact nature <strong>of</strong> <strong>the</strong> scheme<br />
and <strong>the</strong>refore are not currently confirmed.<br />
KTS <strong>Transport</strong> <strong>Strategy</strong> - Technical Summary Final October 2008.doc / Oct-08 3-11
The Ebbsfleet Valley area is dominated by developments promoted by <strong>the</strong> private<br />
developer Land Securities. A traffic management plan (known as <strong>the</strong> <strong>Transport</strong><br />
Management Toolkit) has been devised as part <strong>of</strong> <strong>the</strong> <strong>Transport</strong> <strong>Strategy</strong> contained<br />
in <strong>the</strong> August 2006 planning application for Eastern Quarry. There is also a separate<br />
but similar traffic management plan for <strong>the</strong> Ebbsfleet <strong>Transport</strong> <strong>Strategy</strong>. It<br />
proposes a range <strong>of</strong> possible measures from a traffic management toolkit toge<strong>the</strong>r<br />
with how <strong>the</strong>se might be triggered and applied. Land Securities propose that <strong>the</strong><br />
developments be monitored against a target set <strong>of</strong> traffic generation forecasts<br />
predicted for <strong>the</strong> surrounding network. If <strong>the</strong> targets are exceeded provision is made<br />
for some toolkit demand management type measures to be implemented.<br />
3.5.7 Trunk Road Management<br />
The Government’s stance is no longer to provide for unlimited road traffic growth<br />
and in working with developers <strong>the</strong> Highways Agency will expect to see proposals<br />
that include ways to reduce <strong>the</strong> traffic impact <strong>of</strong> <strong>the</strong>ir development. The Highways<br />
Agency policy is to ensure that development proposals include measures that<br />
facilitate both <strong>the</strong> reduction <strong>of</strong> traffic and mitigate <strong>the</strong> effects <strong>of</strong> development traffic<br />
on <strong>the</strong> local and strategic highway network.<br />
The Highways Agency is developing integrated demand management strategies for<br />
<strong>the</strong> A2 Trunk Road and <strong>the</strong>se could involve <strong>the</strong> following:<br />
• Upgrading to Controlled Motorway standards, including Variable Speed<br />
Limits<br />
• Providing vehicle priority lanes<br />
• Access Management on entry slip roads<br />
• Increased installation <strong>of</strong> VMS displays and CCTV cameras; and<br />
• Enforcement <strong>of</strong> Variable Speed Limits and vehicle priority lanes<br />
The lane management for <strong>the</strong> A2 will potentially allow <strong>the</strong> introduction <strong>of</strong> high<br />
occupancy priority lanes and/or restrictions on usage for certain classes <strong>of</strong> vehicles<br />
at certain times. A scheme development is under preparation by <strong>the</strong> Highways<br />
Agency but <strong>the</strong> technical details have not yet been resolved. Wider network<br />
conditions beyond <strong>the</strong> KTS area need to be taken into account in <strong>the</strong> assessment as<br />
<strong>the</strong>y maybe <strong>of</strong>fsetting dis-benefits on sections <strong>of</strong> <strong>the</strong> local network. The key<br />
benefits which will guide Highways Agency in <strong>the</strong> emerging scheme design will<br />
include <strong>the</strong> following:<br />
• Improvements in journey time reliability<br />
• Savings through reductions in incidents<br />
• Savings in environmental costs in <strong>the</strong> form <strong>of</strong> reduced emissions from<br />
related pollution<br />
• Increased overall vehicular throughput thus reducing dis-benefits to<br />
suppressed traffic<br />
The Highways Agency are also considering additional integrated demand<br />
management schemes for <strong>the</strong> M25 but <strong>the</strong> A2 Trunk Road plans described above<br />
are more advanced. The Highways Agency has also identified improvements at<br />
Bean and Ebbsfleet Interchanges as a priority to facilitate <strong>the</strong> additional traffic from<br />
<strong>the</strong> KTS developments. These schemes are still under consideration and include<br />
signalising <strong>the</strong> access junctions, increasing <strong>the</strong> length <strong>of</strong> <strong>the</strong> trunk road merge and<br />
diverge layouts and better lane separation. A major challenge along <strong>the</strong> A2 corridor<br />
KTS <strong>Transport</strong> <strong>Strategy</strong> - Technical Summary Final October 2008.doc / Oct-08 3-12
in <strong>the</strong> <strong>Kent</strong> <strong>Thameside</strong> area is <strong>the</strong> close spacing <strong>of</strong> junctions and this may ultimately<br />
determine what demand management schemes are possible in <strong>the</strong> area.<br />
3.5.8 Project Cordon<br />
As part <strong>of</strong> <strong>the</strong> M20 Controlled Motorway scheme <strong>the</strong> Highways Agency (HA) has<br />
agreed to provide support facilities on <strong>the</strong> two diversion routes and one all purpose<br />
road between <strong>the</strong> M20 and M2 between Maidstone and <strong>the</strong> Medway towns. The<br />
relevant Local Authorities (LAs) and <strong>the</strong> HA agreed to work in partnership to ensure<br />
that any facilities provided would meet <strong>the</strong>ir mutual needs and help manage <strong>the</strong><br />
consequences <strong>of</strong> any diversions on <strong>the</strong> local network.<br />
The facilities being provided are:<br />
• number plate reading technology :- to provide journey times;<br />
• inductive loop technology:- to provide speed, flow and o<strong>the</strong>r traffic data;<br />
• limited CCTV coverage <strong>of</strong> <strong>the</strong> Cordon area;<br />
• Variable Message Signs (VMS);on <strong>the</strong> local road network, <strong>the</strong> all purpose<br />
road approaches to <strong>the</strong> motorway; and<br />
• Enhanced Message Signs (EMS) on <strong>the</strong> motorway approaches to motorway<br />
junctions.<br />
The data feeds will be fused with those from existing and proposed technology on<br />
<strong>the</strong> <strong>Kent</strong> County Council network to maximise <strong>the</strong> coverage <strong>of</strong> <strong>the</strong> area.<br />
When <strong>the</strong> message signs on <strong>the</strong> LA network are not being used to display strategic<br />
diversion messages, set by <strong>the</strong> Route Control Coordinator (RCC), <strong>the</strong> Local<br />
Authority will be able to display agreed message sets to supplement VMS signing<br />
currently being installed around Maidstone and Medway.<br />
The project will enable coordinated traffic management, irrespective <strong>of</strong> nominal<br />
responsibilities, to reduce journey times. Although centred on <strong>the</strong> Maidstone area,<br />
<strong>the</strong> techniques used will have wider benefits throughout <strong>the</strong> County, by directing<br />
traffic away from, or around, congested parts <strong>of</strong> <strong>the</strong> network including <strong>the</strong> A2 and<br />
M25 / A282 trunk roads in <strong>the</strong> <strong>Kent</strong> <strong>Thameside</strong> area.<br />
3.6 Strategic <strong>Transport</strong> Investment Package Schemes<br />
The overall thrust <strong>of</strong> <strong>the</strong> <strong>Transport</strong> <strong>Strategy</strong> has been to manage down demand for<br />
travel with a wide variety <strong>of</strong> measures described in section 3.5 above. It is assumed<br />
with <strong>the</strong> development <strong>of</strong> <strong>the</strong> public transport network including Fastrack and <strong>the</strong> new<br />
HS1 Domestic train services from Ebbsfleet <strong>the</strong>re will be a significant modal shift in<br />
favour <strong>of</strong> public transport between today and 2025. This modal shift to public<br />
transport is discussed in Appendix A, section A5.5.<br />
However, notwithstanding <strong>the</strong> combined impacts <strong>of</strong> <strong>the</strong> various elements <strong>of</strong> <strong>the</strong><br />
transport strategy it is inevitable with <strong>the</strong> scale <strong>of</strong> development proposed that <strong>the</strong><br />
operation <strong>of</strong> <strong>the</strong> highway network will be significantly less effective in 2025 as<br />
compared to today. Just to put in context based on Table 3.1, in <strong>the</strong> PM peak today<br />
<strong>the</strong>re are around 58,000 trips with ei<strong>the</strong>r an origin or destination in <strong>Kent</strong> <strong>Thameside</strong><br />
and by 2025 this is expected to grow to 93,000 trips, a 60% increase in traffic. This<br />
traffic growth estimate is considered to be at <strong>the</strong> high end because it is based on<br />
current trip rates and it will be necessary for this growth to be tempered by active<br />
demand management policies. The KTS <strong>Transport</strong> Model has been used to predict<br />
<strong>the</strong> combined impacts <strong>of</strong> <strong>the</strong> committed transport schemes, and additional transport<br />
KTS <strong>Transport</strong> <strong>Strategy</strong> - Technical Summary Final October 2008.doc / Oct-08 3-13
schemes against <strong>the</strong> additional trips that will be generated by new development. It<br />
should be appreciated <strong>the</strong> KTS <strong>Transport</strong> Model is providing a conservative forecast<br />
as it does not yet include any <strong>of</strong> <strong>the</strong> demand management policies discussed in this<br />
report.<br />
The modelling work has identified a number <strong>of</strong> local traffic bottlenecks that will need<br />
to be tackled to balance capacity as evenly as possible across <strong>the</strong> network. Given<br />
<strong>the</strong> predictions <strong>of</strong> significantly increased congestion as compared today it is also<br />
considered to be essential for <strong>the</strong>re to be an overarching Urban Traffic Management<br />
Control system including active measures to control and manage flows on <strong>the</strong><br />
strategic road network (A2 Trunk Road, A282 and M25).<br />
A package <strong>of</strong> 11 transport schemes has been developed referred to as <strong>the</strong> Strategic<br />
<strong>Transport</strong> Investment Package Schemes (STIPS) to minimise <strong>the</strong> adverse traffic<br />
impacts <strong>of</strong> development. These schemes will need to be delivered over <strong>the</strong> next 10-<br />
15 years and consequently design development will be refined in future years. The<br />
full benefits <strong>of</strong> some <strong>of</strong> <strong>the</strong>se schemes are difficult to model at this stage particularly<br />
<strong>the</strong> proposed UTMC and A2 Demand management proposals as <strong>the</strong>y are still being<br />
developed. These are never<strong>the</strong>less essential to effectively manage <strong>the</strong> scale <strong>of</strong><br />
people travelling on <strong>the</strong> network through to <strong>the</strong> design year 2025.<br />
The 11 strategic transport improvements are described in Table 3.4 toge<strong>the</strong>r with a<br />
brief summary <strong>of</strong> <strong>the</strong> scheme objectives. The schemes have an estimated total cost<br />
<strong>of</strong> some £185m and are required over an above <strong>the</strong> substantial programme <strong>of</strong><br />
schemes already committed shown in Table 3.2.<br />
These 11 schemes can be viewed as enabler schemes to facilitate <strong>the</strong> KTS<br />
developments. The 11 STIPS schemes do not encompass all <strong>the</strong> transport strategy<br />
initiatives described above and will be subject to review as <strong>the</strong> strategy studies<br />
develop. At <strong>the</strong> moment some <strong>of</strong> <strong>the</strong>se costs in Table 3.4 are best guess estimates<br />
and it is expected as <strong>the</strong> schemes are engineered in more detail more precise cost<br />
estimates can be provided. Figure 3.1 indicates <strong>the</strong> location <strong>of</strong> <strong>the</strong> 11 STIPS<br />
schemes in <strong>Kent</strong> <strong>Thameside</strong>, and it should be noted that <strong>the</strong> Urban Traffic<br />
Management & Control system is an area wide scheme and is not specific to a<br />
particular location.<br />
Table 3.4: Strategic <strong>Transport</strong> Investment Package Schemes (STIPS)<br />
Scheme<br />
A2 Ebbsfleet Junction<br />
Improvements<br />
Cost*<br />
£m<br />
Timing Brief Description<br />
<strong>of</strong> Proposed Works<br />
30 2014 / 15 Modification <strong>of</strong><br />
access junctions<br />
and changes to<br />
merge and diverge<br />
lanes.<br />
A2 Bean Junction Improvements 30 2015 / 16 Signalising <strong>of</strong><br />
access junctions,<br />
changes to merge<br />
and diverge lanes,<br />
improved lane<br />
separation.<br />
Possible new<br />
bridge.<br />
Demand Management on A2<br />
Trunk Road<br />
35 2013 / 14 Introduction <strong>of</strong><br />
controlled motorway<br />
standards (including<br />
variable speed<br />
Scheme Objectives<br />
Improve access<br />
between <strong>the</strong> A2 and<br />
Ebbsfleet, Eastern<br />
Quarry and<br />
Northfleet<br />
Embankment.<br />
Improve access<br />
between <strong>the</strong> A2 and<br />
Eastern Quarry and<br />
Bluewater.<br />
Regulate and<br />
manage traffic on<br />
<strong>the</strong> local strategic<br />
road network to<br />
KTS <strong>Transport</strong> <strong>Strategy</strong> - Technical Summary Final October 2008.doc / Oct-08 3-14
B262 Hall Road Junction<br />
Improvement<br />
A226 London Road / B255 St<br />
Clements Way Junction<br />
improvement<br />
Urban Traffic Management &<br />
Control across <strong>Kent</strong> <strong>Thameside</strong><br />
A226 Thames Way Dualling<br />
STDR4<br />
limits), vehicle<br />
priority lanes,<br />
access<br />
management and<br />
VMS.<br />
3 2017 / 18 Junction capacity<br />
improvements and<br />
traffic calming on<br />
Springhead Road.<br />
7.5 2014 / 15 Junction capacity<br />
improvement<br />
through <strong>the</strong><br />
provision <strong>of</strong> an<br />
underpass.<br />
8 2015 / 16 Introduction <strong>of</strong> traffic<br />
signal control<br />
system, additional<br />
signalised junctions,<br />
VMS, CCTV and<br />
real time<br />
information.<br />
12.5 2017 / 18 Upgrade <strong>of</strong> existing<br />
single carriageway<br />
to dual to provide<br />
additional capacity.<br />
<strong>Dartford</strong> Town Centre 10 2012 / 13 Revise traffic<br />
circulation on ring<br />
road and improved<br />
bus access<br />
(Lowfield Street) for<br />
development.<br />
Rathmore Road Link 10 2013 / 14 Provision <strong>of</strong><br />
Rathmore Road Link<br />
and o<strong>the</strong>r highway<br />
improvements<br />
including changes to<br />
one-way system in<br />
Gravesend town<br />
centre.<br />
A206 / Marsh St, <strong>Dartford</strong><br />
Improvements<br />
Fastrack Northfleet to Garrick<br />
Street<br />
Contingencies 22.12<br />
Administration Costs 1.34<br />
3 2018 / 19 Convert <strong>the</strong><br />
roundabout to a<br />
signalised junction<br />
12.5 2016 / 17 Provision <strong>of</strong> a<br />
dedicated public<br />
transport link<br />
through new<br />
developments.<br />
improve its<br />
efficiency and<br />
reduce congestion.<br />
Relieve congestion<br />
bottleneck on local<br />
strategic road<br />
network.<br />
Relieve congestion<br />
bottleneck on local<br />
strategic road<br />
network.<br />
Reduce highway<br />
traffic and manage<br />
traffic flows more<br />
efficiently to reduce<br />
congestion<br />
Improve access to<br />
Ebbsfleet on <strong>the</strong><br />
local strategic road<br />
network.<br />
Improve access for<br />
public transport and<br />
support<br />
development<br />
proposals.<br />
Improve town centre<br />
environment, access<br />
for public transport<br />
and support<br />
development<br />
proposals.<br />
Improve access to<br />
north <strong>Dartford</strong> on<br />
<strong>the</strong> local strategic<br />
road network.<br />
Improve public<br />
transport access to<br />
major development<br />
area.<br />
TOTAL 185<br />
*In 2008 prices.<br />
The majority <strong>of</strong> <strong>the</strong> estimated cost <strong>of</strong> <strong>the</strong> STIPS schemes is focused on<br />
predominantly highway related schemes. This is because <strong>the</strong>y will be implemented<br />
to complement <strong>the</strong> package <strong>of</strong> schemes that are already committed and funded<br />
among which public transport measures (including HS1 Domestic services, Crossrail<br />
and additional Fastrack bus services) predominate. The package does, however,<br />
include public transport, demand management and traffic management proposals.<br />
A degree <strong>of</strong> flexibility has been built into <strong>the</strong> package to allow for <strong>the</strong> addition or<br />
deletion <strong>of</strong> schemes as development proceeds and transport conditions change<br />
across <strong>the</strong> network.<br />
KTS <strong>Transport</strong> <strong>Strategy</strong> - Technical Summary Final October 2008.doc / Oct-08 3-15
A282<br />
KEY<br />
<strong>Kent</strong> <strong>Thameside</strong> Area<br />
Not to Scale<br />
<strong>Development</strong> Area<br />
Road Improvements<br />
Fastrack Improvements<br />
Junction Improvements<br />
A206/Marsh Street<br />
Improvements<br />
Town Centre Improvements<br />
Urban Traffic Management<br />
Area<br />
A2026<br />
A206<br />
J1a<br />
A282<br />
A206<br />
London Road/<br />
St Clements Way<br />
Junction<br />
Improvement<br />
A226<br />
Fastrack<br />
Northfleet to<br />
Garrick Street<br />
A226<br />
<strong>Dartford</strong> Town Centre<br />
A226<br />
B255<br />
Thames Way<br />
Dualling STDR4<br />
Gravesham<br />
<strong>Transport</strong><br />
Quarter<br />
A2<br />
A2018<br />
J1b<br />
A225 A296<br />
A296<br />
B262 Hall Rd<br />
Junction<br />
B261<br />
A226<br />
J2<br />
A2<br />
A2 Bean<br />
Junction<br />
Improvements<br />
A2 Ebbsfleet<br />
Junction<br />
Improvements<br />
A227<br />
Demand Management on A2<br />
Trunk Road<br />
M25<br />
Urban Traffic Management<br />
Across <strong>Kent</strong> <strong>Thameside</strong><br />
A2<br />
Based upon or reproduced from Ordnance<br />
Survey maps with <strong>the</strong> permission <strong>of</strong> <strong>the</strong><br />
Controller <strong>of</strong> Her Majesty's Stationary Office<br />
Crown Copyright reserved<br />
Licence No. LA076708<br />
The Strategic <strong>Transport</strong> Investment Package Schemes Figure 3.1
The expected source <strong>of</strong> funding for <strong>the</strong> STIPS schemes is as follows:<br />
Eastern Quarry contribution<br />
Regional Funding Allocation<br />
DfT Contribution<br />
DCLG Contribution<br />
Housing Tariff<br />
Commercial Tariff<br />
Total<br />
£40.00m<br />
£25.00m<br />
£26.00m<br />
£23.00m<br />
£54.06m<br />
£6.92m<br />
£174.98m<br />
The intention is for <strong>the</strong> funding contributions to be placed into a communal fund from<br />
which allocations will be made for <strong>the</strong> construction <strong>of</strong> <strong>the</strong> individual schemes. The<br />
shortfall between <strong>the</strong> level <strong>of</strong> funding and <strong>the</strong> current estimated cost for <strong>the</strong> package<br />
will be covered by interest earned on positive cash balances during <strong>the</strong> years that<br />
<strong>the</strong> fund is in credit and by efficiency savings in <strong>the</strong> schemes <strong>the</strong>mselves.<br />
A substantial proportion <strong>of</strong> <strong>the</strong> cost <strong>of</strong> <strong>the</strong> package will be raised from <strong>the</strong> planned<br />
new developments. Funding has already been secured for <strong>the</strong> package through <strong>the</strong><br />
Section 106 Agreement for Eastern Quarry and fur<strong>the</strong>r funding will be raised through<br />
<strong>the</strong> introduction <strong>of</strong> a Planning Tariff for new housing and commercial development.<br />
The tariff proposal has been developed specifically to fund STIPS schemes and will<br />
not replace o<strong>the</strong>r conventional Section 106 contributions for site specific transport<br />
measures or o<strong>the</strong>r community infrastructure.<br />
Funding for walking, cycling, public transport, parking and demand management<br />
components have yet to be confirmed and should be considered high priority<br />
schemes. It is expected that funding for schemes that are not picked up through<br />
STIPS would be secured through <strong>the</strong> LTP process or from developer contributions.<br />
Whatever source <strong>of</strong> funding is secured it is expected that, unless priority is clearly<br />
dictated by <strong>the</strong> <strong>Strategy</strong>, funding will be prioritised using <strong>Kent</strong> County Council’s<br />
PIPKIN appraisal tool.<br />
3.7 The KTS <strong>Transport</strong> Model and Benefits <strong>of</strong> STIPS<br />
The benefits <strong>of</strong> <strong>the</strong> STIPS schemes are quantified with <strong>the</strong> assistance <strong>of</strong> <strong>the</strong> KTS<br />
<strong>Transport</strong> Model backed up with various detailed micro-simulation models<br />
developed in <strong>Kent</strong> <strong>Thameside</strong>. This section will only provide a brief summary <strong>of</strong> <strong>the</strong><br />
modelling results and for more details <strong>the</strong> reader is referred to Appendix A where<br />
<strong>the</strong>re is a description <strong>of</strong> <strong>the</strong> KTS <strong>Transport</strong> Model and more detailed forecasting<br />
output.<br />
Note <strong>the</strong> existing as well as two forecast year horizons have been modelled<br />
representing 2005, 2011 and 2025. The 2005 period represents <strong>the</strong> traffic<br />
conditions in 2005 before <strong>the</strong> Fastrack scheme opened, 2011 represents <strong>the</strong><br />
opening phase <strong>of</strong> <strong>the</strong> developments with limited committed transport schemes and<br />
no STIPS yet built, and 2025 Do Minimum represents full development with full<br />
committed transport schemes. The 2025 STIPS scenario includes full development<br />
with full committed transport schemes as well as <strong>the</strong> STIPS schemes. Fur<strong>the</strong>r<br />
details on <strong>the</strong> modelling assumptions are provided in Appendix A. It should be<br />
noted <strong>the</strong> KTS Model represents <strong>the</strong> average hour <strong>of</strong> <strong>the</strong> 3 hour peak period for<br />
both morning and evening weekday peaks and <strong>the</strong>refore <strong>the</strong>re will be times within<br />
<strong>the</strong> 3 hour peak where conditions will be worse than what is illustrated in <strong>the</strong> model<br />
representing <strong>the</strong> height <strong>of</strong> <strong>the</strong> peak.<br />
KTS <strong>Transport</strong> <strong>Strategy</strong> - Technical Summary Final October 2008.doc / Oct-08 3-16
To put in context <strong>the</strong> traffic levels in 2025 will be far higher than in 2005 with <strong>the</strong><br />
massive amount <strong>of</strong> development in <strong>the</strong> area assumed <strong>the</strong>refore it is inevitable that<br />
traffic conditions will be to a lower standard than <strong>the</strong>y are currently despite <strong>the</strong><br />
massive increase in transport infrastructure proposed.<br />
It can be seen from Tables A.1 and A.2 in Appendix A that <strong>the</strong> STIPS programme as<br />
currently modelled would provide a reduction in overall junction delays <strong>of</strong><br />
respectively 24% in <strong>the</strong> AM peak and 21% in <strong>the</strong> PM peak by 2025. The package<br />
also provides a 3% improvement in terms <strong>of</strong> average speeds and travel times<br />
across <strong>the</strong> network in 2025. It should be appreciated that <strong>the</strong> average speed and<br />
travel times are measured across <strong>the</strong> whole network in <strong>Kent</strong> <strong>Thameside</strong> whilst <strong>the</strong><br />
overcapacity queuing is only measured against those junctions affected. This is why<br />
<strong>the</strong> percentage change benefit is more significant for queuing than area wide<br />
statistics like speeds and travel times shown in Tables A.1 and A.2 in Appendix A.<br />
For example <strong>the</strong> M25 is not affected by <strong>the</strong> STIPS proposals but <strong>the</strong> traffic volumes<br />
on this section <strong>of</strong> <strong>the</strong> KTS network are very significant and as a result will smooth<br />
out <strong>the</strong> average speed and overall travel time benefits in <strong>the</strong> KTS area from <strong>the</strong><br />
STIPS programme. Therefore one has to investigate <strong>the</strong> localised benefits from <strong>the</strong><br />
STIPS package in more detail to appreciate <strong>the</strong> benefits which are done below.<br />
3.7.1 Junction Improvement Benefits<br />
Two <strong>of</strong> <strong>the</strong> key highway bottlenecks identified in <strong>the</strong> modelling for <strong>the</strong> future are<br />
A226 London Road with St Clements Way junction and B262 Hall Road with<br />
Springhead Road junction. The flows and delays for <strong>the</strong> AM and PM peak for 2005,<br />
2011 and 2025 Do Minimum and STIPS are shown in Tables 3.5 and 3.6 below.<br />
Table 3.5: A226 London Road with St Clements Way Junction<br />
2005 Base 2011 2025 Do Minimum 2025 STIPS<br />
Flow Delay (sec) Flow Delay (sec) Flow Delay (sec) Flow Delay (sec)<br />
Approach Arm AM PM AM PM AM PM AM PM AM PM AM PM AM PM AM PM<br />
London Road (east) 970 560 16 20 1078 842 35 66 1010 920 88 104 1350 1220 14 41<br />
St Cl. Way (south) 760 940 12 13 944 1644 13 19 1350 1270 22 130 700 1260 13 35<br />
London Road (west) 310 530 14 19 600 360 17 177 380 430 196 133 900 680 15 23<br />
Station Rd 770 1120 11 18 965 836 12 73 1160 1640 24 24 590 890 11<br />
*Note: Queues and delays are averages across <strong>the</strong> various lanes for each approach arm.<br />
19<br />
Table 3.6: B262 Springhead Road with Hall Road Junction<br />
2005 Base 2011<br />
2025 Do Minimum 2025 STIPS<br />
Flow Delay (sec) Flow Delay (sec) Flow Delay (sec) Flow Delay (sec)<br />
Approach Arm AM PM AM PM AM PM AM PM AM PM AM PM AM PM AM PM<br />
Springhead Road (north) 910 760 22 109 843 805 41 138 930 920 60 243 940 1380 45 90<br />
Hall Road 750 680 56 11 817 918 71 29 790 880 93 101 860 810 87 65<br />
Springhead Road (south) 1680 2090 10 10 2408 2535 15 36 2480 2580 32 38 1840 1830 97 68<br />
Wingfield Bank 220 440 29 25 320 639 3022 1729 350 740 3365 1931 370 750 89 184<br />
*Note: Queues and delays are averages across <strong>the</strong> various lanes for each approach arm.<br />
At <strong>the</strong> A226 London Road with St Clements Way junction <strong>the</strong> average delay per<br />
vehicle approaching from St Clements Way South goes from 13 seconds in <strong>the</strong> PM<br />
today to about 130 seconds (over 2 minutes) by 2025 in <strong>the</strong> Do Minimum without<br />
STIPS. With <strong>the</strong> STIPS improvement in 2025 <strong>the</strong> delay drops back to 35 seconds<br />
which is comparable with today when one considers <strong>the</strong> flow on <strong>the</strong> link increases<br />
from 940 vehicles to about 1260 vehicles by 2025. London Road also has similar<br />
reduction in delay benefits with <strong>the</strong> implementation <strong>of</strong> STIPS by 2025.<br />
KTS <strong>Transport</strong> <strong>Strategy</strong> - Technical Summary Final October 2008.doc / Oct-08 3-17
For <strong>the</strong> B262 Springhead Road with Hall Road junction this is already a problem<br />
junction today with an average vehicle delay <strong>of</strong> 109 seconds in <strong>the</strong> PM peak from<br />
Springhead Road North. This approach increases to an average delay <strong>of</strong> 249<br />
seconds (or over 4 minutes) per vehicle by 2025 Do Minimum without STIPS. With<br />
<strong>the</strong> STIPS improvement <strong>the</strong> average delay drops back to 90 seconds which is<br />
comparable with today even though <strong>the</strong> traffic has increased by about 82%. Note<br />
<strong>the</strong> traffic flows are less in <strong>the</strong> 2025 Do Minimum compared with <strong>the</strong> STIPS because<br />
more traffic is stuck in queues in <strong>the</strong> Do Minimum dropping <strong>the</strong> flow throughput on<br />
<strong>the</strong> link. Wingfield Bank which is <strong>the</strong> access to <strong>the</strong> Sainsburys in Gravesend <strong>the</strong><br />
average delay per vehicle goes up from 25 seconds in <strong>the</strong> PM to over 30 minute<br />
delay in 2025 Do Minimum. This represents gridlock type conditions and <strong>the</strong> traffic<br />
volume on Springhead Road is such that <strong>the</strong> access traffic from Sainsbury just<br />
cannot get out. In reality if this was allowed to happen where no improvement was<br />
forthcoming to this junction, people would be deterred from using Sainsburys with<br />
such high delays and would be an intolerable situation. With STIPS <strong>the</strong> average<br />
delay per vehicle drops back to 184 seconds which is still high and a more detailed<br />
study is needed to see what fur<strong>the</strong>r improvements can be done at this junction. It is<br />
<strong>the</strong> intention <strong>of</strong> <strong>the</strong> highway authority to traffic calm Springhead Road (with <strong>the</strong><br />
opening <strong>of</strong> <strong>the</strong> Ebbsfleet Link Road as an alternative route to <strong>the</strong> A2) which has not<br />
yet been fully assessed and modelled, and this will hopefully improve <strong>the</strong> local<br />
conditions yet fur<strong>the</strong>r.<br />
3.7.2 Local Journey Time Savings Benefits<br />
As discussed earlier <strong>the</strong> overall travel time savings across <strong>the</strong> network with <strong>the</strong><br />
STIPS schemes is only around 3% but this figure masks significant localised travel<br />
time savings on key routes in <strong>Kent</strong> <strong>Thameside</strong>.<br />
There will be travel time savings brought about by congestion relief and typical PM<br />
peak travel time savings by car with <strong>the</strong> STIPS schemes in place for 2025 are as<br />
follows:<br />
• Between Bluewater and ei<strong>the</strong>r <strong>Dartford</strong> or Gravesend Station a saving <strong>of</strong><br />
about 4 minutes around a 20% benefit<br />
• Between Bluewater and Greenhi<strong>the</strong> Station a saving <strong>of</strong> about 4 minutes<br />
around a 50% benefit<br />
• Between Gravesend Station and Greenhi<strong>the</strong> Station a saving <strong>of</strong> about 3<br />
minutes around a 17% benefit<br />
• Between <strong>Dartford</strong> Station and Eastern Quarry or Ebbsfleet Station a saving<br />
<strong>of</strong> about 2 minutes around a 10% benefit<br />
The journey times for public transport are extracted for <strong>the</strong> most convenient mode<br />
and route and could involve ei<strong>the</strong>r rail or bus or a combination <strong>of</strong> both. By public<br />
transport <strong>the</strong> travel time savings in <strong>the</strong> network are generally more modest than by<br />
car as STIPS is focussed on highway congestion relief so people travelling by<br />
railways will not benefit from STIPS. Fastrack will also see limited benefit as it is<br />
already protected from highway congestion by segregated track and bus priority<br />
where it shares road space with <strong>the</strong> car. The exception to <strong>the</strong>se modest savings by<br />
public transport is users <strong>of</strong> <strong>the</strong> Northfleet to Garrick Street Fastrack scheme which is<br />
part <strong>of</strong> STIPS. Users will benefit from <strong>the</strong> re-alignment <strong>of</strong> <strong>the</strong> Fastrack scheme<br />
through <strong>the</strong> proposed new roads in <strong>the</strong> Northfleet Embankment development where<br />
it has been assumed Fastrack buses will have faster running times as it is not using<br />
<strong>the</strong> existing congested streets with improved bus priority. It should be noted that <strong>the</strong><br />
model has had to make assumptions on <strong>the</strong> Fastrack routing and bus stops through<br />
<strong>the</strong> Northfleet Embankment development as <strong>the</strong> scheme is still being engineered<br />
KTS <strong>Transport</strong> <strong>Strategy</strong> - Technical Summary Final October 2008.doc / Oct-08 3-18
and <strong>the</strong>refore <strong>the</strong> travel time savings on this route are subject to review. On <strong>the</strong><br />
o<strong>the</strong>r routes not affected by <strong>the</strong> re-aligned Fastrack route through <strong>the</strong> Northfleet<br />
Embankment <strong>the</strong>re will be some limited travel time savings with <strong>the</strong> STIPS schemes<br />
mainly for buses by 2025 where it benefits from congestion relief brought about by<br />
<strong>the</strong> STIPS proposals. For <strong>the</strong> PM peak typical public transport savings are as<br />
follows:<br />
• Between Greenhi<strong>the</strong> Station and Gravesend Station a saving <strong>of</strong> about 8<br />
minutes around a 44% benefit, associated with <strong>the</strong> Fastrack Northfleet to<br />
Garrick Street scheme discussed earlier<br />
• Between Eastern Quarry and Gravesend Station a saving <strong>of</strong> about 2 minutes<br />
around a 11% benefit<br />
• Between Ebbsfleet Station and Gravesend Station a saving <strong>of</strong> about 1<br />
minute around a 9% benefit<br />
Although some <strong>of</strong> <strong>the</strong> travel time savings may seem modest <strong>the</strong>y affect thousands <strong>of</strong><br />
people making journeys and accumulated over a year will bring about significant<br />
economic benefits. Fur<strong>the</strong>r details on <strong>the</strong> travel time savings benefits are provided<br />
in Section A.5.4 <strong>of</strong> Appendix A.<br />
3.7.3 Additional STIPS Scheme Benefits not currently Modelled<br />
Not all <strong>the</strong> STIPS schemes listed in Table 3.4 are modelled and <strong>the</strong>se include <strong>the</strong><br />
proposed Demand Management on <strong>the</strong> A2 Trunk Road, <strong>the</strong> proposed UTMC<br />
system for <strong>the</strong> KTS area and <strong>the</strong> <strong>Dartford</strong> Town Centre scheme. These schemes<br />
ei<strong>the</strong>r do not yet have worked up details that can be modelled or have yet to be<br />
endorsed by <strong>the</strong> highway authority, however in due course it is expected more <strong>of</strong><br />
<strong>the</strong>se schemes will be included in <strong>the</strong> modelling. In addition some <strong>of</strong> <strong>the</strong> s<strong>of</strong>ter<br />
schemes discussed earlier associated with demand management like better walking<br />
and cycling, and travel plan initiatives have also not been modelled at this stage.<br />
Therefore network performance benefits associated with <strong>the</strong> STIPS schemes<br />
modelled are considered conservative as <strong>the</strong>y are without <strong>the</strong> three STIPS schemes<br />
listed above. These additional STIPS schemes have been investigated with <strong>the</strong><br />
promoters as well as taking into account evidence from o<strong>the</strong>r case studies and are<br />
discussed below.<br />
(a)<br />
A2 Demand Management<br />
The proposals under consideration for <strong>the</strong> A2 Demand Management were discussed<br />
in Section 3.5.7 <strong>of</strong> this report. These schemes have not yet been fully defined by<br />
HA and at this stage potential benefits can only be inferred from looking at case<br />
studies on similar schemes implemented elsewhere in <strong>the</strong> UK.<br />
Case studies have now been conducted by <strong>the</strong> HA on <strong>the</strong> M25 Controlled Motorway<br />
scheme and <strong>the</strong> M42 Active Traffic Management (ATM) scheme, some <strong>of</strong> which<br />
features maybe implemented on <strong>the</strong> A2/M2 corridor.<br />
The overall conclusions from <strong>the</strong>se studies can be summarised as follows:<br />
• Smoo<strong>the</strong>r and more reliable journeys in certain periods. The M42 study<br />
found journey time variability had been reduced between 22% and 32%.<br />
• Capacity had increased by an average 7 – 9% with 4 Lane Variable<br />
Mandatory Speed Limits on <strong>the</strong> M42.<br />
KTS <strong>Transport</strong> <strong>Strategy</strong> - Technical Summary Final October 2008.doc / Oct-08 3-19
• The 4-Lane Variable Mandatory Speed Limits (VMSL) reduced average<br />
journey times by up to 24% compared with a 3-Lane VMSL system.<br />
• High levels <strong>of</strong> congestion relief benefits were found on very congested parts<br />
<strong>of</strong> <strong>the</strong> M42 but it was stressed that this needs to be applied with care and it is<br />
unlikely to give <strong>the</strong> same level <strong>of</strong> benefit from every application as <strong>the</strong> impact<br />
will be dependent on site specific conditions.<br />
• Reduction in stress for drivers<br />
• Reductions in <strong>the</strong> number and severity <strong>of</strong> accidents<br />
• Reductions in traffic noise, vehicle emissions and fuel consumption<br />
• Improved driver behaviour<br />
Separate to <strong>the</strong> HA studies <strong>the</strong> Commission for Integrated <strong>Transport</strong> has also<br />
suggested that controlled motorways would be a good way <strong>of</strong> controlling carbon<br />
emissions.<br />
Focussing on <strong>the</strong> KTS area itself a feasibility study has now been undertaken into a<br />
park and ride site for <strong>the</strong> old A2 between Pepperhill and Cobham which will become<br />
redundant with <strong>the</strong> current A2 widening scheme due to open in 2009. This scheme<br />
could form part <strong>of</strong> <strong>the</strong> A2 Demand Management strategy. A commuter coach park<br />
and ride scheme is estimated to remove between 1% - 2% <strong>of</strong> existing private car<br />
users to commuter coaches, whe<strong>the</strong>r it is for <strong>the</strong> short section between Tollgate and<br />
<strong>the</strong> existing informal park and ride site at Bean or fur<strong>the</strong>r along <strong>the</strong> A2 towards Inner<br />
London.<br />
(b)<br />
KTS Area Wide UTMC Scheme<br />
Based on <strong>Transport</strong> Research Laboratory work (TRRL LR1014, more details in<br />
Appendix E), a typical UTC SCOOT traffic signal scheme can lead to a reduction<br />
in delays <strong>of</strong> between 12% - 20%. It is harder to quantify <strong>the</strong> benefits from a wider<br />
UTMC scheme which includes o<strong>the</strong>r technology like Variable Message signage and<br />
it would be potentially be misleading to extract benefits from o<strong>the</strong>r areas with UTMC<br />
and apply it to <strong>the</strong> KTS area.<br />
(c)<br />
<strong>Dartford</strong> Town Centre Scheme<br />
The <strong>Dartford</strong> Town centre scheme will remove highway capacity with <strong>the</strong> removal <strong>of</strong><br />
<strong>the</strong> one-way system and thus lead to some loss in highway network performance.<br />
However <strong>the</strong> scheme is being primarily developed to improve public transport<br />
access, improve <strong>the</strong> air quality with less road vehicles and will bring about an<br />
improved local ambience with less vehicular traffic and thus make it a better<br />
pedestrian and shopping environment. This in itself will assist with regenerating <strong>the</strong><br />
town centre and this will have wider economic benefits.<br />
3.8 Accessibility <strong>Strategy</strong><br />
The various strands <strong>of</strong> <strong>the</strong> <strong>Transport</strong> <strong>Strategy</strong> are interlinked and will work toge<strong>the</strong>r<br />
to ensure that travel throughout <strong>the</strong> <strong>Kent</strong> <strong>Thameside</strong> area is as sustainable overall<br />
as possible.<br />
Generally in <strong>the</strong> <strong>Kent</strong> <strong>Thameside</strong> area transport provision is biased towards an east<br />
to west direction linking <strong>the</strong> two urban areas <strong>of</strong> <strong>Dartford</strong> and Gravesend. There are<br />
a number <strong>of</strong> roads and public transport services discussed earlier serving east to<br />
west movements. The only fixed road link to <strong>the</strong> north side <strong>of</strong> <strong>the</strong> River Thames into<br />
Essex is <strong>the</strong> <strong>Dartford</strong> Crossing, which suffers from congestion as a national trunk<br />
road link and <strong>the</strong> next nearest fixed road link is <strong>the</strong> Blackwall Tunnel in inner London<br />
KTS <strong>Transport</strong> <strong>Strategy</strong> - Technical Summary Final October 2008.doc / Oct-08 3-20
which also suffers from congestion. There is a road vehicle and pedestrian ferry<br />
crossing at Woolwich and a pedestrian only ferry crossing, at Gravesend; however<br />
<strong>the</strong> ferries both have very low capacity. Due to <strong>the</strong> significant congestion at <strong>the</strong><br />
<strong>Dartford</strong> Crossing, consultants for <strong>the</strong> Department for <strong>Transport</strong> are currently<br />
investigating long term capacity in <strong>the</strong> Lower Thames and identifying possible<br />
options, including new river crossings, by <strong>the</strong> end <strong>of</strong> 2008. Potentially viable options<br />
will be assessed in more detail in a fur<strong>the</strong>r phase <strong>of</strong> <strong>the</strong> study. To inform <strong>the</strong><br />
Government's study, <strong>Kent</strong> and Essex County Council have commissioned<br />
consultants to first review potential options for crossing downstream <strong>of</strong> <strong>Dartford</strong> and<br />
<strong>the</strong>n to develop two options in fur<strong>the</strong>r detail. The study for <strong>the</strong> two authorities will<br />
also explore potential funding mechanisms for <strong>the</strong> construction and operation <strong>of</strong> a<br />
new crossing. There are also proposals to construct a fixed link road bridge called<br />
<strong>the</strong> Thames Gateway Bridge which will have public transport services near<br />
Thamesmead however this is currently subject to a second public inquiry and is not<br />
supported by <strong>the</strong> new Mayor <strong>of</strong> London in its current form.<br />
In terms <strong>of</strong> public transport access to <strong>the</strong> north, <strong>the</strong> HS1 rail link at Ebbsfleet, also<br />
crosses <strong>the</strong> River Thames, near <strong>the</strong> <strong>Dartford</strong> Crossing, before heading into London,<br />
however this scheme is London focussed and does not serve nearby Essex directly.<br />
There is also <strong>the</strong> Docklands Light Railway in East London which is being extended<br />
to cross <strong>the</strong> River Thames into nearby Woolwich Arsenal, this is expected to be<br />
completed in <strong>the</strong> early half <strong>of</strong> 2009 but again this link is London focussed and does<br />
not directly serve Essex or <strong>Kent</strong>.<br />
It can be concluded that overall accessibility to <strong>the</strong> north <strong>of</strong> <strong>the</strong> KTS area suffers<br />
from severance by <strong>the</strong> river and accessibility is generally considered poor<br />
particularly into nearby Essex. It will obviously improve over <strong>the</strong> KTS forecast<br />
period if one or both <strong>of</strong> <strong>the</strong> two new bridge crossings currently under investigation is<br />
built. Accessibility is also relatively poor to <strong>the</strong> south <strong>of</strong> <strong>the</strong> KTS area in comparison<br />
to east to west movements because <strong>of</strong> A2 Trunk Road related severance and<br />
inferior public transport services from <strong>the</strong> rural catchment.<br />
In summary because accessibility is not to a uniform high standard across <strong>the</strong> KTS<br />
area it needs to be recognised that for some people <strong>the</strong> only realistic mode <strong>of</strong> travel<br />
will continue to be <strong>the</strong> private car and <strong>the</strong>refore any restrictive demand management<br />
policies need to take into account this reality. However to ensure that all areas and<br />
user groups are adequately served, and to identify any areas where special<br />
measures may be needed, a full accessibility assessment will need to be carried<br />
out, and an accessibility strategy developed as part <strong>of</strong> <strong>the</strong> detailed development <strong>of</strong><br />
<strong>the</strong> <strong>Transport</strong> <strong>Strategy</strong>. This will be particularly relevant in respect <strong>of</strong> parking policy<br />
with public transport accessibility and car based demand restraint looked at as an<br />
integrated whole to give people a realistic choice to <strong>the</strong>ir car and to minimise <strong>the</strong><br />
threat <strong>of</strong> social exclusion. This KTS accessibility strategy needs to be in line with<br />
<strong>Kent</strong> County Council’s wider Accessibility <strong>Strategy</strong> for <strong>Kent</strong> (ASK) document.<br />
Finally as part <strong>of</strong> <strong>the</strong> <strong>Transport</strong> <strong>Strategy</strong> on accessibility it would be expected that<br />
any new proposed developments would have to have a full accessibility strategy<br />
supplied with <strong>the</strong> planning application to ensure that it addressed all <strong>of</strong> <strong>the</strong><br />
accessibility issues associated with <strong>the</strong> proposed development. A key criterion for<br />
acceptability would be <strong>the</strong> standard <strong>of</strong> accessibility to <strong>the</strong> proposed development for<br />
non-car traffic users. Note this is already Local Authority policy for new developer<br />
led planning applications so is not an additional requirement emanating from this<br />
<strong>Transport</strong> <strong>Strategy</strong>.<br />
KTS <strong>Transport</strong> <strong>Strategy</strong> - Technical Summary Final October 2008.doc / Oct-08 3-21
4 Conclusions<br />
The emerging South East Plan provides <strong>the</strong> statutory framework for <strong>the</strong><br />
regeneration <strong>of</strong> <strong>the</strong> <strong>Kent</strong> <strong>Thameside</strong> area with a target <strong>of</strong> 25,000 new homes and<br />
50,000 new jobs by <strong>the</strong> year 2026. The <strong>Kent</strong> <strong>Thameside</strong> Model has been updated to<br />
represent <strong>the</strong> 2011, 2018 and 2025 development scenarios and to carry out option<br />
testing to identify highway schemes and o<strong>the</strong>r transport improvements. This will help<br />
to support <strong>the</strong> expected level <strong>of</strong> development and to assist with <strong>the</strong> development <strong>of</strong><br />
a high level <strong>Transport</strong> <strong>Strategy</strong> for <strong>Kent</strong> <strong>Thameside</strong>.<br />
The eventual <strong>Transport</strong> <strong>Strategy</strong> for <strong>Kent</strong> <strong>Thameside</strong> needs to reflect <strong>the</strong> overall<br />
vision for <strong>Kent</strong> <strong>Thameside</strong> but it is essential that it also reasonably accommodates<br />
<strong>the</strong> local objectives <strong>of</strong> <strong>the</strong> various stakeholders (summarised in Section 1.4).<br />
Reviewing <strong>the</strong> existing situation, it is concluded that in <strong>the</strong> existing (2005 base)<br />
scenario <strong>the</strong> highway network already has some congestion but works reasonably<br />
well in comparison with o<strong>the</strong>r congested areas in <strong>the</strong> South East <strong>of</strong> England and <strong>the</strong><br />
M25 corridor. Looking to <strong>the</strong> future <strong>the</strong> area has a major transport challenge by <strong>the</strong><br />
sheer scale <strong>of</strong> <strong>the</strong> development proposals with households expected to increase by<br />
about a third and commercial developments expected to almost double, compared<br />
with <strong>the</strong> existing situation.<br />
However, <strong>the</strong> results <strong>of</strong> <strong>the</strong> modelling work have shown that, even when a number<br />
<strong>of</strong> committed and funded transport schemes (Table 3.2) are taken into account, and<br />
despite generally good public transport provision, <strong>the</strong> very high level <strong>of</strong> development<br />
planned for <strong>the</strong> area will significantly affect <strong>the</strong> future operation <strong>of</strong> <strong>the</strong> highway<br />
network. The results indicate that <strong>the</strong> PM peak will be <strong>the</strong> worse time period <strong>of</strong> <strong>the</strong><br />
day for highway traffic conditions and by 2011 at <strong>the</strong> opening phase <strong>of</strong> <strong>the</strong><br />
developments <strong>the</strong> network performance will be similar to today. Focussing on <strong>the</strong><br />
more congested PM peak by 2025 a sample <strong>of</strong> typical travel routes in <strong>the</strong> network<br />
indicate performance will deteriorate by around 25% compared with existing travel<br />
times and overall average speeds will drop from about 59kph today to about 46kph if<br />
only committed transport schemes are built. Overcapacity queuing is expected to<br />
increase over 16 fold with only <strong>the</strong> committed schemes assumed. It is clear that<br />
fur<strong>the</strong>r local transport measures will be necessary to enable <strong>the</strong> successful<br />
development <strong>of</strong> <strong>the</strong> area.<br />
A number <strong>of</strong> particular congestion hotspots have been identified (such as <strong>the</strong> B262<br />
Springhead Road/Hall Road junction and <strong>the</strong> St Clements Way junction) and a<br />
package <strong>of</strong> additional schemes and proposals have been developed and tested in<br />
<strong>the</strong> model that will underpin <strong>the</strong> transport needs <strong>of</strong> <strong>the</strong> planned development. In all,<br />
a total <strong>of</strong> 11 additional Strategic <strong>Transport</strong> Investment Package Schemes (STIPS)<br />
have been identified at a total cost <strong>of</strong> £185 million which includes contingencies and<br />
administration costs.<br />
If <strong>the</strong> STIPS package schemes can be implemented <strong>the</strong>y will help to fur<strong>the</strong>r improve<br />
<strong>the</strong> 2025 highway network performance. Overcapacity queues will reduce by about<br />
21% compared with <strong>the</strong> 2025 Do Minimum scenario, overall journey time is<br />
expected to improve by about 3% and average speeds will increase from 46 kph to<br />
48 kph representing an approximate 7% improvement. It is worth noting that <strong>the</strong><br />
network performance improvement is conservative as not all <strong>the</strong> STIPS schemes<br />
are modelled and additional benefits are expected. In addition <strong>the</strong> overall network<br />
speed and journey time benefits mask <strong>the</strong> full extent <strong>of</strong> <strong>the</strong> localised benefits<br />
realised from <strong>the</strong> STIPS schemes and will include substantial reductions in delays at<br />
KTS <strong>Transport</strong> <strong>Strategy</strong> - Technical Summary Final October 2008.doc / Oct-08
key junctions and much improved journey times on key routes across <strong>the</strong> <strong>Kent</strong><br />
<strong>Thameside</strong> area as reported. As an example a typical car journey from Bluewater to<br />
Gravesend Station in <strong>the</strong> PM peak will reduce from 21 minutes to 17 minutes with<br />
STIPS in 2025 a saving <strong>of</strong> 4 minutes, which is a benefit <strong>of</strong> around 20%. Time<br />
savings have been demonstrated for o<strong>the</strong>r typical journeys across <strong>Kent</strong> <strong>Thameside</strong><br />
in this report.<br />
The highway improvements identified are focused on relieving specific bottlenecks<br />
and congestion hotspots, ra<strong>the</strong>r than on increasing highway capacity to match<br />
demand. It is accepted, in line with Government policy, that <strong>the</strong> transport strategy<br />
cannot entirely depend on providing more highway capacity, and that transport<br />
provision has to work hand in hand with a demand management strategy to reduce<br />
and manage <strong>the</strong> need to travel, particularly by car.<br />
Alongside <strong>the</strong> STIPS schemes, a range <strong>of</strong> town centre improvement, demand<br />
management and traffic management schemes are being developed and separate<br />
outline studies have been conducted to underpin <strong>the</strong>se different components <strong>of</strong> <strong>the</strong><br />
transport strategy. These cover parking strategy, public transport improvements,<br />
walking and cycling improvements, demand management, Urban Traffic<br />
Management & Control proposals, town centre schemes, trunk road proposals and<br />
targeted highway improvements. Among <strong>the</strong> fur<strong>the</strong>r measures that should be<br />
investigated is provision <strong>of</strong> more bus priority for non-Fastrack buses, but this will be<br />
a challenge in <strong>the</strong> urban areas because <strong>of</strong> limited space.<br />
Congestion benefits delivered by <strong>the</strong> STIPS package will fur<strong>the</strong>r improve when three<br />
<strong>of</strong> <strong>the</strong> STIPS schemes not currently modelled are fur<strong>the</strong>r developed and <strong>the</strong>ir<br />
cumulative impact can be tested in <strong>the</strong> model. Based on case studies taken from<br />
o<strong>the</strong>r locations across <strong>the</strong> UK <strong>the</strong> A2 Demand Management <strong>Strategy</strong> will realise<br />
additional benefits such as improved journey time reliability, and less carbon<br />
emissions with improved traffic flows. The area wide UTMC scheme not yet<br />
developed and modelled will also realise additional benefits mainly from reduced<br />
delays in <strong>the</strong> network and <strong>the</strong> <strong>Dartford</strong> Town centre scheme will bring about an<br />
improved local town centre environment and all <strong>the</strong> associated environmental and<br />
economic benefits.<br />
On public transport (PT) <strong>the</strong>re is a huge growth in usage predicted over <strong>the</strong> next 20<br />
years with an increased PT mode share from about 18% today for journeys to work<br />
increasing to about 27% by 2025. This mode shift is caused by Fastrack services,<br />
<strong>the</strong> new HS 1 Domestic rail services and increased highway costs relative to public<br />
transport costs predicted over <strong>the</strong> next 20 years encouraging a modal shift away<br />
from <strong>the</strong> private car. A target <strong>of</strong> <strong>the</strong> <strong>Transport</strong> <strong>Strategy</strong> should be to get <strong>the</strong> PT<br />
forecast modal share above 30% with <strong>the</strong> KTS Model when <strong>the</strong> accessibility and<br />
parking strategy is fur<strong>the</strong>r developed and <strong>the</strong> wider demand management strategy<br />
emerges. At <strong>the</strong> moment <strong>the</strong>re is no noticeable difference in public transport usage<br />
between <strong>the</strong> two 2025 forecast scenarios; as <strong>the</strong>re are no significant additional<br />
public transport schemes in <strong>the</strong> STIPS proposals. The major public transport<br />
schemes are mainly covered in <strong>the</strong> Committed Schemes (see Table 3.2) which are<br />
already in both forecast scenarios.<br />
National and regional policies promoted by central Government such as road<br />
pricing, workplace parking levy and high occupancy vehicle lanes could also have<br />
an impact in <strong>the</strong> future, though <strong>the</strong> case for <strong>the</strong>se has not yet been proven as part <strong>of</strong><br />
<strong>the</strong> recommended package. Note <strong>the</strong> current Local <strong>Transport</strong> Bill in Parliament<br />
proposes updating existing legal powers so that, where local areas wish to develop<br />
KTS <strong>Transport</strong> <strong>Strategy</strong> - Technical Summary Final October 2008.doc / Oct-08
proposals for local road pricing schemes, <strong>the</strong>y will have <strong>the</strong> freedom and flexibility to<br />
do so, whilst ensuring <strong>the</strong> scheme is consistent and interoperable.<br />
To help fund <strong>the</strong> STIPS schemes, a tariff scheme has been developed. This is<br />
intended specifically to provide funding for <strong>the</strong> Strategic <strong>Transport</strong> Investment<br />
Package Schemes and will not replace o<strong>the</strong>r conventional Section 106 contributions<br />
to site specific transport measures or o<strong>the</strong>r community infrastructure. However <strong>the</strong>re<br />
is a need for flexibility to allow <strong>the</strong> addition or deletion <strong>of</strong> schemes as development<br />
proceeds and transport conditions change across <strong>the</strong> network.<br />
Finally it needs to be recognised that this is an evolving <strong>Transport</strong> <strong>Strategy</strong> that will<br />
be fur<strong>the</strong>r developed and enhanced as more detailed work is conducted.<br />
KTS <strong>Transport</strong> <strong>Strategy</strong> - Technical Summary Final October 2008.doc / Oct-08
Appendix A - <strong>Transport</strong> Modelling and Forecasting<br />
A.1 The KTS <strong>Transport</strong> Model<br />
The <strong>Kent</strong> <strong>Thameside</strong> <strong>Transport</strong> Model (KTS Model) is <strong>the</strong> primary tool for assessing<br />
<strong>the</strong> transport impacts <strong>of</strong> expected development around <strong>the</strong> <strong>Kent</strong> <strong>Thameside</strong><br />
regeneration area. It is a multi-modal transport model representing vehicular travel<br />
demand with <strong>the</strong> SATURN s<strong>of</strong>tware used for <strong>the</strong> highways (cars and commercial<br />
vehicles) and <strong>the</strong> TRIPS s<strong>of</strong>tware used for public transport (rail, bus, and coach).<br />
The basic travel demand data input into <strong>the</strong> model is derived from traffic count,<br />
ticketing data and roadside interview survey data toge<strong>the</strong>r, with predicted trip<br />
generation and travel mode that will arise from <strong>the</strong> various development scenarios<br />
considered. There is also a mode choice demand model which links <strong>the</strong> SATURN<br />
and TRIPS models. This can take account <strong>of</strong> traveller’s decisions on how to make<br />
particular trips, in response to changing travel costs. The output is a post mode<br />
choice demand matrix which is assigned to <strong>the</strong> highway and public transport<br />
network to assess network performance. The KTS Model is validated against 2005<br />
transport conditions and was later updated to reflect <strong>the</strong> Fastrack services that<br />
opened in 2006. Forecasts have been prepared for <strong>the</strong> 2011, 2018 and 2025<br />
scenarios based on <strong>the</strong> land use forecasts prepared by <strong>the</strong> two local boroughs. The<br />
subsequent trip generations for <strong>the</strong> 2025 scenario from <strong>the</strong> land use forecasts<br />
provided in Table 3.1 <strong>of</strong> <strong>the</strong> main report section earlier were included in <strong>the</strong> KTS<br />
Model. For more details on <strong>the</strong> modelling work refer to <strong>the</strong> KTS Model references in<br />
Appendix E.<br />
To support <strong>the</strong> KTS Model <strong>the</strong>re are also a number <strong>of</strong> micro-simulation transport<br />
models focussing on different parts <strong>of</strong> <strong>the</strong> <strong>Kent</strong> <strong>Thameside</strong> area and <strong>the</strong>se models<br />
assess detailed transport operational issues mainly associated with road vehicles on<br />
<strong>the</strong> highway. The HA has developed a KTS Trunk Road VISSIM model <strong>of</strong> <strong>the</strong> A2<br />
Trunk Road and M25/A282 and connecting junctions. There is also a VISSIM model<br />
<strong>of</strong> <strong>the</strong> <strong>Dartford</strong> town centre, a Paramics model <strong>of</strong> Gravesend town centre and <strong>the</strong><br />
Ebbsfleet area. <strong>Kent</strong> County Council has also developed a VISSIM model <strong>of</strong> <strong>the</strong><br />
North West KTS area, and toge<strong>the</strong>r with <strong>the</strong> o<strong>the</strong>r models provides full microsimulation<br />
modelling coverage <strong>of</strong> <strong>the</strong> entire <strong>Kent</strong> <strong>Thameside</strong>. All <strong>of</strong> <strong>the</strong>se microsimulation<br />
models use forecast transport demand from <strong>the</strong> KTS Model <strong>the</strong>refore<br />
making it a common database across <strong>the</strong> area. These micro-simulation model<br />
results are not reported here but <strong>the</strong>y have been used to assist with developing <strong>the</strong><br />
Strategic <strong>Transport</strong> Investment Package Schemes discussed earlier.<br />
A.2 Modelling Scenarios<br />
The objective <strong>of</strong> <strong>the</strong> KTS modelling to date is to quantify <strong>the</strong> network performance<br />
benefits from <strong>the</strong> various STIPS and to compare it with <strong>the</strong> Do Minimum scenario <strong>of</strong><br />
already committed transport schemes. To do this one has to model <strong>the</strong> 2025 full<br />
development with and without <strong>the</strong> Strategic <strong>Transport</strong> Investment Package<br />
Schemes. The schemes modelled can <strong>the</strong>refore be summarised as follows:<br />
• 2005 Base Scenario – <strong>the</strong> 2005 scenario before <strong>the</strong> Fastrack scheme was<br />
introduced and represents <strong>the</strong> year <strong>the</strong> current KTS Model was validated.<br />
• 2011 Opening Year Scenario – 2011 is assumed to be <strong>the</strong> opening year <strong>of</strong><br />
<strong>the</strong> developments for modelling purposes and is based on <strong>the</strong> 2011 KTS<br />
land use developments and it was assumed most <strong>of</strong> <strong>the</strong> Committed transport<br />
schemes would be in place except those Fastrack routes associated with<br />
KTS <strong>Transport</strong> <strong>Strategy</strong> - Technical Summary Final October 2008.doc / Oct-08
developments that come after 2011. None <strong>of</strong> <strong>the</strong> STIPS schemes were<br />
assumed to be in place by 2011.<br />
• 2025 Do Minimum Scenario – <strong>the</strong> 2025 KTS full land use developments<br />
with <strong>the</strong> committed transport network schemes but without <strong>the</strong> Strategic<br />
<strong>Transport</strong> Investment Package Schemes.<br />
• 2025 STIPS Scenario – <strong>the</strong> 2025 KTS full land use developments with <strong>the</strong><br />
committed transport network schemes and with <strong>the</strong> Strategic <strong>Transport</strong><br />
Investment Package Schemes.<br />
Both 2025 scenarios include <strong>the</strong> full land use development as shown in Table 3.1<br />
from <strong>the</strong> main report earlier with 25,000 homes as per <strong>the</strong> South East Plan. For<br />
comparison purposes <strong>the</strong> 2005 base year scenario and 2011 opening year<br />
modelling results is also reported to benchmark against forecast conditions.<br />
A.3 2025 Do Minimum Network Assumptions<br />
In terms <strong>of</strong> forecast network assumptions <strong>the</strong> 2025 Do Minimum Scenario only<br />
includes <strong>the</strong> committed network schemes shown in Table 3.2. Note <strong>the</strong> walking and<br />
cycling schemes in Table 3.2 are not included in <strong>the</strong> KTS Model as <strong>the</strong>se trips are<br />
not explicitly modelled and will have a marginal effect on highway network<br />
performance.<br />
In addition <strong>the</strong> Crossrail scheme is not modelled although <strong>the</strong> HS1 domestic<br />
services scheme is included. It could be argued that by not modelling Crossrail it is<br />
a conservative assumption in terms <strong>of</strong> highway congestion as this additional public<br />
transport scheme will fur<strong>the</strong>r de-congest <strong>the</strong> highway by encouraging more people<br />
who may have used <strong>the</strong> private car to use <strong>the</strong> railway. The Crossrail scheme will<br />
terminate in Abbey Wood in south east London which is served by rail services from<br />
<strong>Dartford</strong> and Gravesham. It is not expected that people in <strong>the</strong> KTS area will drive by<br />
car to south east London to catch this service at Abbey Wood as <strong>the</strong>y will be<br />
deterred by congestion and lack <strong>of</strong> local parking.<br />
A.4 2025 STIPS Network Assumptions<br />
For <strong>the</strong> 2025 STIPS network scenario this includes <strong>the</strong> committed schemes<br />
modelled in <strong>the</strong> Do-Minimum scenario as well as <strong>the</strong> STIPS schemes listed in Table<br />
3.4. The STIPS schemes are still being developed and assumptions were made<br />
about <strong>the</strong> schemes for modelling. Some schemes have not been modelled because<br />
<strong>of</strong> insufficient information and <strong>the</strong> modelling can be considered on <strong>the</strong> conservative<br />
side. Therefore <strong>the</strong> modelling has to be viewed as work in progress and will be<br />
refined as more details <strong>of</strong> schemes become available.<br />
Assumptions relating to <strong>the</strong> scheme designs for <strong>the</strong> A2 Trunk Road / B259 Ebbsfleet<br />
Interchange, A2 Trunk Road / B255 Bean Interchange and B262 Springhead Road /<br />
Hall Road roundabout have been made on <strong>the</strong> basis <strong>of</strong> scheme drawings provided<br />
by <strong>the</strong> Highways Agency and its agent Faber Maunsell. Without intervention,<br />
modelling work shows that <strong>the</strong> B262 Springhead Road / Hall Road junction is likely<br />
to become a major bottleneck by 2025. The Highways Agency scheme for <strong>the</strong> B262<br />
Springhead Road / Hall Road junction was modelled in <strong>the</strong> KTS Model. Note <strong>Kent</strong><br />
County Council wish to downgrade <strong>the</strong> status <strong>of</strong> <strong>the</strong> B262 Springhead Road with <strong>the</strong><br />
opening <strong>of</strong> <strong>the</strong> new Ebbsfleet Link road and are keen to traffic calm this road and to<br />
discourage through traffic from using it. The overall aim is to refrain from increasing<br />
<strong>the</strong> capacity <strong>of</strong> <strong>the</strong> junction by discouraging additional traffic from using it with traffic<br />
control measures. The traffic calming strategy for <strong>the</strong> B262 Springhead Road is not<br />
KTS <strong>Transport</strong> <strong>Strategy</strong> - Technical Summary Final October 2008.doc / Oct-08
yet fully confirmed but some attempt was made at modelling traffic calming on this<br />
link.<br />
Demand Management on <strong>the</strong> A2 Trunk Road has not been modelled in <strong>the</strong> KTS<br />
Model largely because a workable definitive scheme has not yet been developed<br />
and agreed with <strong>the</strong> Highways Agency. It should be appreciated that <strong>the</strong> A2 Trunk<br />
Road Demand Management strategy in <strong>the</strong> KTS area provides particular<br />
challenging problems largely associated with <strong>the</strong> close spacing <strong>of</strong> junctions.<br />
Demand management schemes for <strong>the</strong> trunk roads were discussed in Section 3.5.7<br />
and include variable speed limits and ramp metering onto <strong>the</strong> A2.<br />
As yet no definitive UTMC schemes have been developed for <strong>the</strong> KTS area that can<br />
be modelled and would need more detailed design work. Only outline proposals and<br />
ideas have been developed to date, reported in Jacobs (2007) <strong>Kent</strong> <strong>Thameside</strong> –<br />
UTMC Study report. The next stage <strong>of</strong> work to be commissioned on developing <strong>the</strong><br />
UTMC proposals has now started but no results have yet been made available for<br />
this report or for modelling.<br />
Town centre improvement schemes promoted by <strong>Dartford</strong> Borough Council were<br />
still under development when <strong>the</strong> strategic modelling was conducted and have not<br />
been included. In fact this scheme may remove highway capacity in certain locations<br />
and is still under review and is likely to evolve over time. In any case town centre<br />
highway schemes usually have localised effects and do not materially affect <strong>the</strong><br />
wider strategic network. The Gravesend town centre scheme was included in <strong>the</strong><br />
model but is still being developed and is likely to change by <strong>the</strong> consultants working<br />
on <strong>the</strong> scheme for Gravesham Borough Council from what is currently assumed.<br />
Micro-simulation modelling is being used to separately assess traffic management<br />
schemes in <strong>the</strong> KTS area.<br />
A.5 Modelling Network Performance<br />
A.5.1 Overall Highway Network Performance<br />
The overall highway network performance for <strong>the</strong> KTS modelled area is shown in<br />
Table A.1 and Table A.2 for <strong>the</strong> AM and PM peak respectively for existing (2005),<br />
opening year (around 2011) and 2025 conditions. The tables clearly indicate that<br />
<strong>the</strong> PM peak has more traffic than <strong>the</strong> AM peak and as a consequence has a lower<br />
network performance. The tables indicate by 2011 when <strong>the</strong> development is in its<br />
early stages <strong>the</strong> traffic demand levels do increase and as a result <strong>the</strong> network<br />
performs marginally worse than compared with existing conditions. There is<br />
additional highway capacity in <strong>the</strong> 2011 scenario compared with <strong>the</strong> base 2005<br />
conditions as 2011 will include <strong>the</strong> current widening works on <strong>the</strong> trunk roads. Also<br />
Fastrack was not present in <strong>the</strong> 2005 model as <strong>the</strong> scheme opened in 2006.<br />
Concentrating on <strong>the</strong> more critical PM peak from Table A.2 it can be seen that with<br />
<strong>the</strong> additional development that will be in place by 2025, and with committed<br />
transport schemes only (Do Minimum), trip numbers will increase by about 38%<br />
overall, average traffic speeds will decrease and queuing will increase substantially<br />
compared to existing conditions. In assessing <strong>the</strong> network performance one should<br />
take into context <strong>the</strong> huge increase in demand from 2005 to 2025 caused by <strong>the</strong><br />
major developments proposed for <strong>the</strong> KTS area. There are around 58,000 trips in<br />
2005 (PM peak) with ei<strong>the</strong>r an origin or destination in <strong>the</strong> KTS area (see Table 3.1)<br />
growing to around 92,000 trips by 2025; this is around a 60% growth in traffic over<br />
<strong>the</strong> next 20 years.<br />
KTS <strong>Transport</strong> <strong>Strategy</strong> - Technical Summary Final October 2008.doc / Oct-08
When <strong>the</strong> 2025 STIPS package is included in Table A.2, <strong>the</strong> network performance is<br />
still worse than at present but improved relative to <strong>the</strong> Do Minimum, with a 3%<br />
reduction in overall travel time and around a 3.3% increase in average speeds. The<br />
biggest benefit is overcapacity vehicle queuing which reduces by 21% with <strong>the</strong><br />
STIPS schemes. In <strong>the</strong> AM peak <strong>the</strong> reduction is 24% in overcapacity queues. To<br />
relate <strong>the</strong> overall network performance statistics with typical journey times for <strong>the</strong><br />
PM peak to benchmark <strong>the</strong> network refer to Tables A.4 – A.7. In section 3.7.3 earlier<br />
a commentary is provided centred around case studies on <strong>the</strong> likely additional<br />
benefits from <strong>the</strong> STIPS schemes not yet modelled because <strong>of</strong> lack <strong>of</strong> details at this<br />
stage <strong>of</strong> <strong>the</strong> study. The modelling results in Tables A.1 and A.2 are <strong>the</strong>refore<br />
considered to be on <strong>the</strong> conservative side in terms <strong>of</strong> benefits and are robust for<br />
scheme appraisal.<br />
It should be appreciated that not all <strong>the</strong> STIPS schemes are proposed purely for<br />
highway capacity improvements like some <strong>of</strong> <strong>the</strong> trunk road or town centre<br />
schemes. The motivation for some <strong>of</strong> <strong>the</strong> STIPS schemes is to manage traffic<br />
demand and improve <strong>the</strong> environment; <strong>the</strong>refore <strong>the</strong>se may not necessarily provide<br />
network performance improvements or transport benefits for economic appraisal.<br />
Table A.1: Overall KTS Area AM Peak Highway Network Performance<br />
Scenario<br />
Trips<br />
Loaded<br />
(Vehicles<br />
per Hour)<br />
Travel Time<br />
(Vehicle<br />
Hours)<br />
Distance<br />
Travelled<br />
(Vehicle<br />
Kms)<br />
Average<br />
Speed<br />
(Kph)<br />
Overcapacity<br />
Queues<br />
(Delayed<br />
Vehicle Hours)<br />
2005 Base 67,365 8,698 536,491 61.7 79<br />
2011 Opening<br />
year<br />
2025 Do<br />
Minimum<br />
76,121 10,993 638,874 57.5 270<br />
90,937 14,956 772,310 51.6 1,295<br />
2025 STIPS 90,619 14,540 772,865 53.2 985<br />
Difference<br />
between 2025<br />
Do Minimum<br />
and 2025 STIPS<br />
-0.4% -3.0% 0.7% 3.0% -24%<br />
Explanatory Notes:<br />
The Trips Loaded are <strong>the</strong> total number <strong>of</strong> vehicle trips ei<strong>the</strong>r starting or ending in <strong>the</strong> KTS area. This figure also includes through trip<br />
movements in <strong>the</strong> KTS area. Travel time is <strong>the</strong> total travel time recorded for <strong>the</strong> number <strong>of</strong> vehicles in <strong>the</strong> KTS area. Distance<br />
Travelled is <strong>the</strong> total distance travelled for <strong>the</strong> number <strong>of</strong> vehicles in <strong>the</strong> KTS area. Average speed is <strong>the</strong> Distance Travelled divided<br />
by <strong>the</strong> Travel Time. Overcapacity Queues are queues in <strong>the</strong> KTS area which extend beyond those expected due to geometric<br />
design delays. For example queues that form at a junction because <strong>of</strong> a red light but clear within <strong>the</strong> cycle are a geometric delay and<br />
not overcapacity queue delays. However if demand exceeds network capacity and a vehicle does not clear <strong>the</strong> junction signal in one<br />
cycle <strong>the</strong>n it forms part <strong>of</strong> <strong>the</strong> overcapacity queue. It represents <strong>the</strong> congested delays in <strong>the</strong> network.<br />
KTS <strong>Transport</strong> <strong>Strategy</strong> - Technical Summary Final October 2008.doc / Oct-08
Table A.2: Overall KTS Area PM Peak Highway Network Performance<br />
Scenario<br />
Trips<br />
Loaded<br />
(Vehicles<br />
per Hour)<br />
Travel Time<br />
(Vehicle<br />
Hours)<br />
Distance<br />
Travelled<br />
(Vehicle<br />
Kms)<br />
Average<br />
Speed<br />
(Kph)<br />
Overcapacity<br />
Queues<br />
(Delayed<br />
Vehicle Hours)<br />
2005 Base 71,157 9,521 565,816 59.4 158<br />
2011 Opening<br />
year<br />
2025 Do<br />
Minimum<br />
80,954 11,826 665,170 56.2 491<br />
98,685 17,098 793,395 46.4 2583<br />
2025 STIPS 98,397 16,622 797,659 48 2035<br />
Difference<br />
between 2025<br />
Do Minimum<br />
and 2025 STIPS<br />
-0.3% -2.8% 0.5% 3.3% -21.2%<br />
Explanatory Notes:<br />
The Trips Loaded are <strong>the</strong> total number <strong>of</strong> vehicle trips ei<strong>the</strong>r starting or ending in <strong>the</strong> KTS area. This figure also includes through trip<br />
movements in <strong>the</strong> KTS area. Travel time is <strong>the</strong> total travel time recorded for <strong>the</strong> number <strong>of</strong> vehicles in <strong>the</strong> KTS area. Distance<br />
Travelled is <strong>the</strong> total distance travelled for <strong>the</strong> number <strong>of</strong> vehicles in <strong>the</strong> KTS area. Average speed is <strong>the</strong> Distance Travelled divided<br />
by <strong>the</strong> Travel Time. Overcapacity Queues are queues in <strong>the</strong> KTS area which extend beyond those expected due to geometric<br />
design delays. For example queues that form at a junction because <strong>of</strong> a red light but clear within <strong>the</strong> cycle are a geometric delay and<br />
not overcapacity queue delays. However if demand exceeds network capacity and a vehicle does not clear <strong>the</strong> junction signal in one<br />
cycle <strong>the</strong>n it forms part <strong>of</strong> <strong>the</strong> overcapacity queue. It represents <strong>the</strong> congested delays in <strong>the</strong> network.<br />
The overall network results above indicate that <strong>the</strong> PM peak is <strong>the</strong> more critical peak<br />
and for brevity only <strong>the</strong> PM peak more detailed results will be reported below.<br />
A.5.2 KTS Speed Performance by Road Type<br />
Table A.3 summarises <strong>the</strong> PM peak speed performance in <strong>the</strong> KTS area<br />
disaggregated by road type and for <strong>the</strong> non-trunk roads it is broken down between<br />
<strong>the</strong> Gravesham and <strong>Dartford</strong> borough boundaries. The strategic roads in Table A.3<br />
are <strong>the</strong> trunk roads M25 / A282 and A2 Trunk Road, <strong>the</strong> principal roads are <strong>the</strong><br />
classified non-trunk roads like <strong>the</strong> A296 Watling Street and A226 London Road and<br />
<strong>the</strong> local roads are <strong>the</strong> un-classified local roads and streets in <strong>the</strong> two boroughs.<br />
Note only <strong>the</strong> more important local roads are included in <strong>the</strong> model. The strategic<br />
trunk roads are <strong>the</strong> responsibility <strong>of</strong> <strong>the</strong> Highways Agency whilst <strong>the</strong> o<strong>the</strong>r roads are<br />
<strong>the</strong> responsibility <strong>of</strong> <strong>Kent</strong> County Council.<br />
The speed is recorded on <strong>the</strong> M25 / A282 trunk road up to Junction 1a and does not<br />
include <strong>the</strong> speeds at <strong>the</strong> <strong>Dartford</strong> Crossing and at <strong>the</strong> toll plazas. The minimum<br />
un<strong>of</strong>ficial benchmark threshold speeds set by <strong>the</strong> KTS <strong>Transport</strong> Group for <strong>the</strong><br />
highways are as follows:<br />
• 20 kph (12mph) Local Roads<br />
• 50 kph (31mph) Principal Roads<br />
• 80 kph (50mph) Trunk Roads<br />
Note <strong>the</strong> benchmark speeds above are for <strong>the</strong> peak periods only and take into<br />
consideration junction and o<strong>the</strong>r accepted network delays.<br />
Table A.3 shows that with current 2005 conditions for <strong>the</strong> local roads and <strong>the</strong><br />
principal roads in both <strong>Dartford</strong> and Gravesend, <strong>the</strong> network is achieving <strong>the</strong><br />
minimum speed threshold benchmarks and shows a network performance that is<br />
KTS <strong>Transport</strong> <strong>Strategy</strong> - Technical Summary Final October 2008.doc / Oct-08
typical for many suburban towns across <strong>the</strong> South East. However minimum speeds<br />
are not being achieved on <strong>the</strong> trunk roads except for <strong>the</strong> A2 Trunk Road westbound<br />
direction which is <strong>the</strong> contra peak movement in <strong>the</strong> PM peak. To help address this<br />
relatively poor network performance on <strong>the</strong> strategic trunk roads <strong>the</strong> Highways<br />
Agency are currently widening <strong>the</strong> A2 Trunk Road and <strong>the</strong> M25 / A282. It should be<br />
noted <strong>the</strong> KTS Model has not yet incorporated <strong>the</strong> demand management strategy for<br />
<strong>the</strong> A2 currently under development by <strong>the</strong> HA and <strong>the</strong>refore <strong>the</strong> results reported<br />
reflect work in progress and not <strong>the</strong> final optimised results.<br />
Note <strong>the</strong>re are o<strong>the</strong>r generic transport benchmarks for <strong>the</strong> KTS area in keeping with<br />
Government policy including better accessibility for public transport, encouraging<br />
sustainable modes <strong>of</strong> transport like walking and cycling and promoting a modal shift<br />
away from <strong>the</strong> private car.<br />
Table A.3: PM Average Speeds by Road Type – With and Without STIPS<br />
Road /<br />
Location<br />
Direction /<br />
Area<br />
Target<br />
Minimum<br />
Speed<br />
(KPH)<br />
Base 2011<br />
<strong>Development</strong><br />
Scenario<br />
PM<br />
2025 <strong>Development</strong><br />
Scenarios<br />
PM Do<br />
Minimum<br />
PM<br />
STIPS<br />
A2<br />
Westbound 80 94 90 83 81<br />
Eastbound 80 71 71 63 61<br />
M25<br />
Northbound 80 64 63 36 35<br />
Southbound 80 63 63 42 41<br />
Principal<br />
Roads<br />
Local<br />
Roads<br />
Average<br />
Speeds<br />
<strong>Dartford</strong> 48 56 57 51 53<br />
Gravesend 48 62 58 50 53<br />
<strong>Dartford</strong> 20 25 24 21 23<br />
Gravesend 20 32 26 21 24<br />
59 57 46 48<br />
With significantly increased demand in <strong>the</strong> KTS area resulting from new<br />
developments it is expected that average speeds would fall below 2005 conditions<br />
by 2011 and certainly by 2025 and this is shown in Table A.3. By 2025:<br />
• <strong>Dartford</strong> local road speeds are just above <strong>the</strong> benchmark speeds for <strong>the</strong> Do<br />
Minimum scenario and improve with <strong>the</strong> STIPS schemes.<br />
• Principal road speeds are also just above <strong>the</strong> benchmark speed in <strong>the</strong> 2025<br />
Do Minimum and also improve with <strong>the</strong> STIPS schemes.<br />
• Trunk road speeds are considerably below <strong>the</strong> benchmark in all <strong>the</strong><br />
scenarios with and without <strong>the</strong> STIPS schemes.<br />
The trunk road results materialise because <strong>the</strong> STIPS schemes provide more<br />
capacity on <strong>the</strong> local network which enables more traffic to use <strong>the</strong> trunk road<br />
network which in turn reduces <strong>the</strong> speeds (in line with <strong>the</strong> speed flow curves in <strong>the</strong><br />
KTS Model). The Highways Agency is currently undertaking a demand<br />
management strategy on <strong>the</strong> A2 Trunk Road to help improve <strong>the</strong> network<br />
performance and is discussed in Section 3.5.7. The speeds on <strong>the</strong> M25 are worse in<br />
KTS <strong>Transport</strong> <strong>Strategy</strong> - Technical Summary Final October 2008.doc / Oct-08
<strong>the</strong> northbound direction in <strong>the</strong> KTS area due to <strong>the</strong> queuing traffic approaching <strong>the</strong><br />
<strong>Dartford</strong> Crossing. The constraints from <strong>the</strong> <strong>Dartford</strong> Crossing are being investigated<br />
in separate studies as discussed in Section 3.8. One way to improve trunk road<br />
speeds is through signalising <strong>the</strong> access junctions and metering (limit access flows)<br />
<strong>the</strong> traffic that joins <strong>the</strong> A2 Trunk Road, this is under investigation by <strong>the</strong> Highways<br />
Agency. However <strong>the</strong>re is <strong>the</strong> risk that holding back traffic on <strong>the</strong> County roads by<br />
access control onto <strong>the</strong> trunk roads may only transfer <strong>the</strong> problem to ano<strong>the</strong>r part <strong>of</strong><br />
<strong>the</strong> network and does not necessarily address <strong>the</strong> core issue <strong>of</strong> excessive demand<br />
for a given network capacity. Therefore at <strong>the</strong> core <strong>of</strong> <strong>the</strong> <strong>Transport</strong> <strong>Strategy</strong><br />
remains <strong>the</strong> challenge <strong>of</strong> active demand management proposals to reduce <strong>the</strong> need<br />
to travel by <strong>the</strong> private car and to measure <strong>the</strong> benefits where possible with <strong>the</strong><br />
transport model.<br />
In summary <strong>the</strong> trunk roads experience <strong>the</strong> most significant drop in speeds and<br />
<strong>the</strong>re is certainly a case for some form <strong>of</strong> active demand management scheme to<br />
minimise <strong>the</strong> significant drop in its speed performance. A demand management<br />
strategy is currently being developed by <strong>the</strong> HA and its consultants and <strong>the</strong>refore<br />
<strong>the</strong> modelling results reported reflect work in progress and not <strong>the</strong> optimised final<br />
solution. For <strong>the</strong> local and principal roads in both <strong>Dartford</strong> and Gravesham <strong>the</strong> aim<br />
should be to improve <strong>the</strong> speeds fur<strong>the</strong>r with <strong>the</strong> UTMC and o<strong>the</strong>r proposals not yet<br />
developed in detail and hence modelled. Note <strong>the</strong> speeds from <strong>the</strong> KTS Model<br />
represent an average hour over <strong>the</strong> 3-hour peak so during certain parts <strong>of</strong> <strong>the</strong><br />
peak period, <strong>the</strong> performance could be significantly worse on <strong>the</strong> ground than what<br />
is shown in <strong>the</strong> model. The area wide speeds for <strong>the</strong> local and principal roads<br />
reflect <strong>the</strong> averages across a wide number <strong>of</strong> roads and speed performance on<br />
individual roads could fluctuate significantly from <strong>the</strong> figures reported in Table A.3.<br />
A.5.3 Junction Performance<br />
In terms <strong>of</strong> junction performance in <strong>the</strong> base 2005 scenario, <strong>the</strong>re are a few<br />
locations on <strong>the</strong> trunk road corridor and around Gravesend which are congested in<br />
<strong>the</strong> peak. Conditions are also fairly congested around <strong>the</strong> <strong>Dartford</strong> Crossing. In<br />
2011 conditions are fairly similar to <strong>the</strong> base 2005 conditions. However in <strong>the</strong> 2025<br />
Do-Minimum Scenario <strong>the</strong>re are considerably more junctions in <strong>the</strong> KTS area which<br />
become congested including more sections <strong>of</strong> <strong>the</strong> trunk road network as well as<br />
roads in both <strong>Dartford</strong> and Gravesend. Measuring <strong>the</strong> volume-capacity ratio (at over<br />
85%) as a proxy for congested junction locations <strong>the</strong> following results are found:<br />
• 8 overloaded junctions in <strong>the</strong> base 2005 PM network.<br />
• 14 overloaded junctions in <strong>the</strong> 2011 PM Opening Year<br />
• 37 overloaded junctions in <strong>the</strong> 2025 PM Do-Minimum.<br />
• 32 overloaded junctions in <strong>the</strong> 2025 PM STIPS scenario.<br />
More detailed junction analysis is available from <strong>the</strong> micro-simulation models and<br />
<strong>the</strong> locations <strong>of</strong> <strong>the</strong> junctions from <strong>the</strong> KTS Model output are listed in Appendix D.<br />
A.5.4 Typical Average Journey Times across <strong>the</strong> KTS area<br />
The KTS Model was interrogated to derive typical journey times between primary<br />
locations within <strong>the</strong> area comparing car with public transport. Tables A.4 and A.5<br />
compare existing 2005 PM peak journey times between car and public transport<br />
respectively. Tables A.6 and A.7, show <strong>the</strong> forecast 2025 PM peak journey times<br />
for <strong>the</strong> same locations by car and public transport for <strong>the</strong> Do Minimum and STIPS<br />
scenario respectively. It will be noted at a number <strong>of</strong> locations like Eastern Quarry<br />
<strong>the</strong>re are no journey times in <strong>the</strong> existing 2005 scenario because <strong>the</strong> development is<br />
KTS <strong>Transport</strong> <strong>Strategy</strong> - Technical Summary Final October 2008.doc / Oct-08
not yet built. Walk times are excluded in <strong>the</strong> tables to make it a fair comparison<br />
between <strong>the</strong> modes but <strong>the</strong> wait time for public transport is included. All times are<br />
rounded to <strong>the</strong> nearest minute and <strong>the</strong> model represents <strong>the</strong> average peak hour<br />
conditions taken over <strong>the</strong> three hour peak period and may not necessarily represent<br />
<strong>the</strong> worst peak travel times <strong>of</strong> <strong>the</strong> day. As would be expected <strong>the</strong> car travel times<br />
increase by 2025 compared with 2005 due to increased congestion.<br />
Generally public transport is slower than <strong>the</strong> car but not in all cases and remains<br />
competitive. Public transport journeys are by bus and/or rail; whichever is quicker.<br />
Comparing <strong>the</strong> Do Minimum with <strong>the</strong> STIPS schemes in 2025 generally <strong>the</strong> travel<br />
times are quicker with <strong>the</strong> STIPS schemes with a few exceptions. Some <strong>of</strong> <strong>the</strong> car<br />
travel time savings are as follows:<br />
• Between Bluewater and ei<strong>the</strong>r <strong>Dartford</strong> or Gravesend Station a saving <strong>of</strong><br />
about 4 minutes around a 20% benefit<br />
• Between Bluewater and Greenhi<strong>the</strong> Station a saving <strong>of</strong> about 4 minutes<br />
around a 50% benefit<br />
• Between Gravesend Station and Greenhi<strong>the</strong> Station a saving <strong>of</strong> about 3<br />
minutes around a 17% benefit<br />
• Between <strong>Dartford</strong> Station and Eastern Quarry or Ebbsfleet Station a saving<br />
<strong>of</strong> about 2 minutes around a 10% benefit<br />
The journey times for public transport are extracted for <strong>the</strong> most convenient mode<br />
and route and could involve ei<strong>the</strong>r rail or bus or a combination <strong>of</strong> both. By public<br />
transport <strong>the</strong> travel time savings in <strong>the</strong> network are generally more modest than by<br />
car as STIPS is focussed on highway congestion relief so people travelling by<br />
railways will not benefit from STIPS. Fastrack will also see limited benefit as it is<br />
already protected from highway congestion by segregated track and bus priority<br />
where it shares road space with <strong>the</strong> car. The exceptions to <strong>the</strong>se modest savings<br />
by public transport are users <strong>of</strong> <strong>the</strong> Northfleet to Garrick Street Fastrack scheme<br />
which is part <strong>of</strong> STIPS. Users will benefit from <strong>the</strong> re-alignment <strong>of</strong> <strong>the</strong> Fastrack<br />
scheme through <strong>the</strong> proposed new roads in <strong>the</strong> Northfleet Embankment<br />
development where it has been assumed Fastrack buses will have faster running<br />
times as it is not using <strong>the</strong> existing congested streets with improved bus priority. It<br />
should be noted that <strong>the</strong> model has had to make assumptions on <strong>the</strong> Fastrack<br />
routing and bus stops through <strong>the</strong> Northfleet Embankment development as <strong>the</strong><br />
scheme is still being engineered and <strong>the</strong>refore <strong>the</strong> travel time savings on this route<br />
are subject to review. On <strong>the</strong> o<strong>the</strong>r routes not affected by <strong>the</strong> re-aligned Fastrack<br />
route through <strong>the</strong> Northfleet Embankment <strong>the</strong>re will still be some limited travel time<br />
savings with <strong>the</strong> STIPS schemes mainly for buses by 2025 where it benefits from<br />
congestion relief brought about by <strong>the</strong> STIPS proposals. For <strong>the</strong> PM peak typical<br />
public transport savings are as follows:<br />
• Between Greenhi<strong>the</strong> Station and Gravesend Station a saving <strong>of</strong> about 8<br />
minutes around a 44% benefit, associated with <strong>the</strong> Fastrack Northfleet to<br />
Garrick Street scheme discussed earlier<br />
• Between Eastern Quarry and Gravesend Station a saving <strong>of</strong> about 2 minutes<br />
around a 11% benefit<br />
• Between Ebbsfleet Station and Gravesend Station a saving <strong>of</strong> about 1<br />
minute around a 9% benefit<br />
KTS <strong>Transport</strong> <strong>Strategy</strong> - Technical Summary Final October 2008.doc / Oct-08
Table A.4: PM 2005 Car Typical Average Travel Times (all times in minutes)<br />
From<br />
To<br />
<strong>Dartford</strong><br />
Station<br />
Bluewater<br />
Eastern<br />
Quarry<br />
Ebbsfleet<br />
Station<br />
Gravesend<br />
Station<br />
Greenhi<strong>the</strong><br />
Station<br />
<strong>Dartford</strong><br />
Station<br />
na 10 na na 20 10<br />
Bluewater 10 na na na 12 3<br />
Eastern<br />
Quarry<br />
Ebbsfleet<br />
Station<br />
Gravesend<br />
Station<br />
Greenhi<strong>the</strong><br />
Station<br />
na na na na na na<br />
na na na na na na<br />
18 11 na na na 12<br />
10 3 na na 12 na<br />
Notes: Times extracted from KTS Model. For car journeys those locations with a public car park modelled a search time is<br />
added to <strong>the</strong> journey time.<br />
Table A.5: PM 2005 Public <strong>Transport</strong> Typical Average Travel Times (all times<br />
in minutes)<br />
From<br />
To<br />
<strong>Dartford</strong><br />
Station<br />
Bluewater<br />
Eastern<br />
Quarry<br />
Ebbsfleet<br />
Station<br />
Gravesend<br />
Station<br />
Greenhi<strong>the</strong><br />
Station<br />
<strong>Dartford</strong><br />
Station<br />
na 17 na na 17 22<br />
Bluewater 18 na na na 24 7<br />
Eastern<br />
Quarry<br />
Ebbsfleet<br />
Station<br />
Gravesend<br />
Station<br />
Greenhi<strong>the</strong><br />
Station<br />
na na na na na na<br />
na na na na na na<br />
20 26 na na na 29<br />
24 7 na na 16 na<br />
Notes: Times extracted from KTS Model. For public transport walk times are excluded but waiting time is included. The most<br />
efficient public transport mode in terms <strong>of</strong> journey times is used.<br />
KTS <strong>Transport</strong> <strong>Strategy</strong> - Technical Summary Final October 2008.doc / Oct-08
Table A.6: PM 2025 Car Typical Average Travel Times (all times in minutes)<br />
From<br />
To<br />
<strong>Dartford</strong><br />
Station<br />
Bluewater<br />
Eastern<br />
Quarry<br />
Ebbsfleet<br />
Station<br />
Gravesend<br />
Station<br />
Greenhi<strong>the</strong><br />
Station<br />
DM DS DM DS DM DS DM DS DM DS DM DS<br />
<strong>Dartford</strong><br />
Station na na 16 15 20 18 23 21 28 27 16 15<br />
Bluewater 16 12 na na 6 6 9 8 21 17 7 3<br />
Eastern<br />
Quarry 21 20 6 6 na na 5 5 17 16 11 10<br />
Ebbsfleet<br />
Station 21 20 9 9 5 5 na na 13 12 13 11<br />
Gravesend<br />
Station 22 22 13 14 14 13 10 9 na na 18 15<br />
Greenhi<strong>the</strong><br />
Station 12 13 4 4 7 7 9 9 16 15 na na<br />
Notes: Times extracted from KTS Model. For car journeys those locations with a public car park modelled a search time is<br />
added to <strong>the</strong> journey time. DM is <strong>the</strong> 2025 Do Minimum scenario and DS is <strong>the</strong> 2025 Do Something or STIPS scenario.<br />
Table A.7: PM 2025 Public <strong>Transport</strong> Typical Average Travel Times (all times<br />
in minutes)<br />
From<br />
To<br />
<strong>Dartford</strong><br />
Station<br />
Bluewater<br />
Eastern<br />
Quarry<br />
Ebbsfleet<br />
Station<br />
Gravesend<br />
Station<br />
Greenhi<strong>the</strong><br />
Station<br />
DM DS DM DS DM DS DM DS DM DS DM DS<br />
<strong>Dartford</strong><br />
Station na na 16 16 20 20 18 18 16 16 12 12<br />
Bluewater 17 17 na na 6 6 9 9 24 27 4 4<br />
Eastern<br />
Quarry 24 24 6 6 na na 5 5 19 17 9 9<br />
Ebbsfleet<br />
Station 21 21 9 9 5 5 na na 11 10 10 10<br />
Gravesend<br />
Station 19 19 21 25 17 17 9 9 na na 18 16<br />
Greenhi<strong>the</strong><br />
Station 17 17 4 5 9 9 10 10 18 10 na na<br />
Notes: Times extracted from KTS Model. For public transport walk times are excluded but waiting time is included. The most<br />
efficient public transport mode in terms <strong>of</strong> journey times is used. DM is <strong>the</strong> 2025 Do Minimum scenario and DS is <strong>the</strong> 2025 Do<br />
Something or STIPS scenario.<br />
A.5.5 Public <strong>Transport</strong> Use<br />
According to <strong>the</strong> 2001 census about 18% <strong>of</strong> <strong>the</strong> journeys to work (excludes nonmotorised<br />
transport) are by public transport (PT) from <strong>the</strong> KTS area which includes<br />
people commuting into London. This mode share is reflected in <strong>the</strong> base 2005 KTS<br />
Model. By 2025 <strong>the</strong> public transport mode share forecast from <strong>the</strong> KTS Model<br />
increases to around 27%. This higher public transport mode share comes about<br />
because <strong>of</strong> improved public transport mainly from Fastrack but also from <strong>the</strong> new<br />
HS1 train services. Higher car travel costs in 2025 compared with today through<br />
KTS <strong>Transport</strong> <strong>Strategy</strong> - Technical Summary Final October 2008.doc / Oct-08
increased congestion and increased parking charges (beyond inflation) also<br />
contribute to a higher public transport mode share in <strong>Kent</strong> <strong>Thameside</strong>. Note an<br />
increased fuel price for private road vehicles beyond inflation has not been assumed<br />
in <strong>the</strong> current modelling but this would also encourage a higher public transport<br />
modal shift. The forecast PT mode share is a significant improvement compared<br />
with existing conditions however it is still below neighbouring London Boroughs <strong>of</strong><br />
Bromley and Bexley where <strong>the</strong> PT mode share for journeys to work is over 30%<br />
today. Therefore <strong>the</strong>re is probably still room for fur<strong>the</strong>r improvement over <strong>the</strong><br />
coming years and will be a challenge for <strong>the</strong> <strong>Transport</strong> <strong>Strategy</strong> and policy makers.<br />
The accessibility and parking strategies, when fully worked up in more detail, should<br />
fur<strong>the</strong>r increase <strong>the</strong> PT mode share indicated by <strong>the</strong> KTS Model, taking it to over<br />
30%.<br />
Projected public transport use from <strong>the</strong> KTS Model is shown in Table A.8 in terms <strong>of</strong><br />
passenger kilometres. Table A.8 indicates that passenger kilometres will more than<br />
double in 2025 compared with <strong>the</strong> 2005 scenario and this is welcomed and positive<br />
as an outcome from <strong>the</strong> modelling. In 2005 <strong>the</strong>re were no Fastrack schemes in<br />
place. This huge growth is facilitated in <strong>the</strong> future through a step change in public<br />
transport with additional Fastrack services and <strong>the</strong> introduction <strong>of</strong> HS1 Domestic rail<br />
services from Ebbsfleet in 2009. It should be noted that within <strong>the</strong> KTS Model public<br />
transport is not calibrated by individual lines or routes and <strong>the</strong>refore only <strong>the</strong> overall<br />
public transport demand by sub-modes (i.e. Bus, Rail, Coach, Fastrack) has been<br />
reported from <strong>the</strong> model. However, although not calibrated at individual route level,<br />
overall boarding levels and mode share for <strong>the</strong> various public transport sub-modes<br />
do validate fairly well in <strong>the</strong> KTS Model and <strong>the</strong>refore measuring public transport at<br />
an aggregate level should provide confidence in <strong>the</strong> forecasting. Also <strong>the</strong> Fastrack<br />
element <strong>of</strong> <strong>the</strong> KTS Model has now been validated from 2006 observed Fastrack<br />
data so this element <strong>of</strong> <strong>the</strong> public transport assessment is considered fairly robust.<br />
Table A.8 shows no noticeable difference in public transport usage between <strong>the</strong> two<br />
2025 forecast scenarios; this is because <strong>the</strong>re are no significant additional public<br />
transport schemes in <strong>the</strong> STIPS proposals, <strong>the</strong> major public transport schemes<br />
being mainly covered in <strong>the</strong> Committed Schemes (see Table 3.2) which are already<br />
in both forecast scenarios.<br />
In summary, <strong>the</strong>re is a huge growth in public transport usage predicted over <strong>the</strong> next<br />
20 years with an increased PT mode share from about 18% today for journeys to<br />
work increasing to at least 27% by 2025. This mode shift is caused by additional<br />
Fastrack services, <strong>the</strong> new HS 1 Domestic rail services and increased highway<br />
costs relative to public transport costs predicted over <strong>the</strong> next 20 years, all<br />
encouraging modal shift away from <strong>the</strong> private car. Fur<strong>the</strong>r development <strong>of</strong> <strong>the</strong><br />
accessibility and parking strategies and <strong>the</strong> emerging wider demand management<br />
strategy, when factored into <strong>the</strong> KTS Model, is expected to show additional mode<br />
shift towards PT. Assuming that measures within <strong>the</strong> developed strategies are<br />
appropriate, targeted and subsequently fully implemented <strong>the</strong>n it could reasonably<br />
be expected that <strong>the</strong> 'journey to work' PT mode share would exceed 30%. This<br />
should be <strong>the</strong> aim.<br />
KTS <strong>Transport</strong> <strong>Strategy</strong> - Technical Summary Final October 2008.doc / Oct-08
Table A.8: PM Peak Public <strong>Transport</strong> Passenger Kilometres<br />
PT Modes Base 2005 2025 Do<br />
Minimum<br />
Do Minimum<br />
Percentage<br />
Differences<br />
2025<br />
STIPS<br />
Scenario<br />
STIPS<br />
Scenario<br />
Percentage<br />
Differences<br />
Bus 14,300 26,137 + 83% 29,875 + 14%<br />
Rail 328,333 704,230 + 114% 698,924 - 0.75%<br />
Coach 6,937 8,483 + 22% 10,074 + 19%<br />
Fastrack n/a 23,483 n/a 23,184 - 1.3%<br />
Total 349,570 762,333 + 118% 762,057 - 0.04%<br />
Notes:<br />
Differences are between Do Minimum and Base and STIPS Scenario and Do Minimum<br />
Note in Table A.8 <strong>the</strong>re is a very small reduction in <strong>the</strong> STIPS passenger kilometres<br />
using Fastrack compared with Do Minimum predicted for 2025. This is because in<br />
STIPS <strong>the</strong>re is only one new Fastrack scheme proposed which is <strong>the</strong> Northfleet to<br />
Garrick Street scheme into Gravesend and this scheme realigns <strong>the</strong> Fastrack<br />
scheme (which is already present in <strong>the</strong> Do Minimum) into <strong>the</strong> Northfleet<br />
development so it is not adding any significant new capacity. The differences can<br />
<strong>the</strong>refore be attributed to slight modelling variability (with possibly some model<br />
noise) and is not a significant effect to be <strong>of</strong> concern.<br />
KTS <strong>Transport</strong> <strong>Strategy</strong> - Technical Summary Final October 2008.doc / Oct-08
Appendix B - Policy Documents<br />
Theme Document Notes<br />
National<br />
<strong>Transport</strong><br />
National<br />
<strong>Transport</strong><br />
National<br />
<strong>Transport</strong><br />
National<br />
Planning<br />
National<br />
Planning<br />
National<br />
Planning<br />
National<br />
Planning<br />
Regional<br />
Planning<br />
Regional<br />
Planning<br />
Regional<br />
Planning<br />
Strategic<br />
Planning<br />
County<br />
<strong>Transport</strong><br />
County<br />
Planning<br />
Local<br />
Planning<br />
Local<br />
Planning<br />
DETR (1998): A New Deal for<br />
<strong>Transport</strong> – Better for Everyone<br />
DfT (2004) The Future <strong>of</strong><br />
<strong>Transport</strong><br />
HMSO (2006) The Eddington<br />
<strong>Transport</strong> Study<br />
DETR (2001) PPG 13 –<br />
<strong>Transport</strong><br />
ODPM (2003) The Sustainable<br />
Communities Plan<br />
ODPM (2005) PPS 1 –<br />
Delivering Sustainable<br />
<strong>Development</strong><br />
DCLG (2007) Manual for Streets<br />
HMSO (1995) RPG 9a: The<br />
Thames Gateway Planning<br />
Framework<br />
SEERA et al. (2004) Growth<br />
and Regeneration in <strong>the</strong><br />
Thames Gateway<br />
SEERA (2006) The South East<br />
Plan (Draft)<br />
The Department for <strong>Transport</strong><br />
Circular 02/2007; Planning and<br />
<strong>the</strong> Strategic Network<br />
KCC (2005) Local <strong>Transport</strong><br />
Plan 2 (2006-2011)<br />
KCC/ Medway Council (2006)<br />
<strong>Kent</strong> and Medway Structure<br />
Plan<br />
<strong>Dartford</strong> Borough Council<br />
(2002) <strong>Dartford</strong> Borough Local<br />
Plan 2nd Review<br />
<strong>Dartford</strong> Borough Council<br />
(2008) <strong>Dartford</strong> Core <strong>Strategy</strong><br />
Preferred Options<br />
The five aims <strong>of</strong> a sustainable transport strategy include improving safety;<br />
promoting accessibility; contributing to an efficient economy; promoting<br />
integration; and protecting <strong>the</strong> environment.<br />
A long term strategy for a modern, efficient and sustainable transport<br />
system backed up by investment. The Government aims to increase<br />
walking and cycling by making it a more convenient, attractive and realistic<br />
choice for more short journeys, especially those to work and school.<br />
Be smarter with <strong>the</strong> way we use our transport resources. Prioritising<br />
investment on those parts <strong>of</strong> <strong>the</strong> system which are critical in supporting<br />
economic growth and where it is clear that <strong>the</strong>se networks are not<br />
performing.<br />
LAs should carry out land use policies and transport programmes in ways<br />
to reduce <strong>the</strong> growth in localised journeys, encourage alternative means <strong>of</strong><br />
travel and reduce environmental impacts. The main aim is to reduce <strong>the</strong><br />
reliance on <strong>the</strong> private car.<br />
Sets out <strong>the</strong> Government’s long-term vision for new communities. It<br />
recognises that a step-change in approach is needed to deliver sustainable<br />
communities, which are more than just housing. Underpins <strong>the</strong> recent<br />
philosophy <strong>of</strong> growth areas such as <strong>the</strong> Thames Gateway.<br />
<strong>Development</strong> plans should promote high quality design and layout, contain<br />
clear access policies and include community involvement in creating<br />
sustainable communities.<br />
This expects designers to place a high priority on meeting <strong>the</strong> needs <strong>of</strong><br />
pedestrians, cyclists and public transport users, and produce more<br />
traditional street patterns which are easier to assimilate into existing built-up<br />
areas.<br />
Establishes <strong>the</strong> principles <strong>of</strong> <strong>the</strong> spatial pattern <strong>of</strong> <strong>the</strong> Gateway, through <strong>the</strong><br />
consolidation <strong>of</strong> <strong>the</strong> existing regional pattern <strong>of</strong> town and country,<br />
maximising <strong>the</strong> potential <strong>of</strong>fered by <strong>the</strong> area's supply <strong>of</strong> brownfield land and<br />
exploiting <strong>the</strong> opportunity <strong>of</strong>fered by HS1 and <strong>the</strong> River Thames. The<br />
‘Green Grid’ is an important concept for <strong>Kent</strong> <strong>Thameside</strong>, <strong>the</strong> objective<br />
being to join <strong>the</strong> main open areas with <strong>the</strong> River Thames frontage, in<br />
addition to links to existing communities and new development areas.<br />
Provides an inter-regional planning approach to <strong>the</strong> Thames Gateway. The<br />
policies in it will be taken forward through <strong>the</strong> Regional Spatial Strategies.<br />
The Plan provides a draft policy framework for <strong>the</strong> region up to 2026.<br />
Emphasises <strong>the</strong> need to make <strong>the</strong> most <strong>of</strong> existing capacity, combined with<br />
increased investment in public transport, cycling and pedestrian access.<br />
The Plan seeks to adopt stronger parking policies linked with a programme<br />
<strong>of</strong> access improvements and reasonable provision for residential<br />
development. High importance is attached to demand management<br />
initiatives<br />
This circular explains how <strong>the</strong> Highways Agency (<strong>the</strong> Agency), on behalf <strong>of</strong><br />
<strong>the</strong> Secretary <strong>of</strong> State for <strong>Transport</strong>, will participate in all stages <strong>of</strong> <strong>the</strong><br />
planning process with Government Offices, regional and local planning<br />
authorities, local highway/transport authorities, public transport providers<br />
and developers to ensure national and regional aims and objectives can be<br />
aligned and met.<br />
Key <strong>the</strong>mes include accessibility, healthier lifestyles, integration, mobility<br />
and road safety. Specific targets for cycling and sustainable travel mode<br />
share to schools. Effective management <strong>of</strong> parking is central to delivering<br />
<strong>the</strong> LTP2.<br />
The Plan was adopted in 2006 and sets out <strong>the</strong> strategic planning<br />
framework for development across <strong>Kent</strong> and Medway. Policy SP1 states<br />
that <strong>the</strong> objective is “to provide good and safe accessibility to jobs and<br />
services for all sections <strong>of</strong> <strong>the</strong> community in <strong>Kent</strong>, and to improve <strong>the</strong><br />
environment and health <strong>of</strong> <strong>the</strong> community by reducing congestion and<br />
pollution, widening <strong>the</strong> choice <strong>of</strong> transport available and by developing<br />
public transport, walking and cycling.”<br />
It focuses on <strong>the</strong> need to meet <strong>the</strong> expected high levels <strong>of</strong> growth up to<br />
2011 in a way that is sustainable. This includes <strong>the</strong> promotion <strong>of</strong> an<br />
integrated transport strategy for <strong>the</strong> Borough which minimises <strong>the</strong> need to<br />
travel, reduce car dependence and encourage <strong>the</strong> use <strong>of</strong> more sustainable<br />
modes <strong>of</strong> travel.<br />
The Core <strong>Strategy</strong> is a planning document containing a spatial vision and<br />
objectives for <strong>Dartford</strong> to 2026 and a strategy for how this will be<br />
achieved. It is part <strong>of</strong> <strong>the</strong> Local <strong>Development</strong> Framework – a set <strong>of</strong> plan<br />
documents which cover different aspects <strong>of</strong> planning in <strong>the</strong> borough.<br />
KTS <strong>Transport</strong> <strong>Strategy</strong> - Technical Summary Final October 2008.doc / Oct-08
Theme Document Notes<br />
Local<br />
Planning<br />
Local<br />
Planning<br />
Gravesham Borough Council<br />
(2001) Gravesham Borough<br />
Local Plan Second Review<br />
Gravesham Borough Council<br />
(2007) Consultation on Core<br />
<strong>Strategy</strong> Key Issues and<br />
Options<br />
Sets out <strong>the</strong> policies for <strong>the</strong> development and use <strong>of</strong> land up to 2011.<br />
Issues include:<br />
• Walking and cycling routes are seen as an integral part <strong>of</strong> <strong>the</strong><br />
Green Grid.<br />
• The need to maintain adequate, accessible, attractive and secure<br />
public car parking in <strong>the</strong> Town Centre to meet <strong>the</strong> needs <strong>of</strong><br />
shoppers and to maintain <strong>the</strong> Town’s economic vitality.<br />
The Core <strong>Strategy</strong> is <strong>the</strong> key part <strong>of</strong> <strong>the</strong> Gravesham Local <strong>Development</strong><br />
Framework. It sets out <strong>the</strong> broad pattern <strong>of</strong> development across <strong>the</strong><br />
Borough over <strong>the</strong> next 20 years and how this will be achieved.<br />
KTS <strong>Transport</strong> <strong>Strategy</strong> - Technical Summary Final October 2008.doc / Oct-08
Appendix C - <strong>Transport</strong> <strong>Strategy</strong> Action Plans<br />
Public <strong>Transport</strong> Action Plans<br />
It is difficult to produce a detailed action plan with definite timescales for what is a<br />
large area, where <strong>the</strong>re are a number <strong>of</strong> options available for some situations, and<br />
o<strong>the</strong>r schemes are dependent on o<strong>the</strong>r developments taking place which in turn<br />
may depend on finance becoming available, or <strong>the</strong> actions <strong>of</strong> private sector<br />
developers.<br />
Also, Network Rail, DfT and Sou<strong>the</strong>astern Railway have already produced a number<br />
<strong>of</strong> plans relating to railway infrastructure and train services, we have intentionally<br />
not repeated <strong>the</strong>se in this section, nor have we repeated plans and proposals for<br />
Gravesend’s <strong>Transport</strong> Quarter.<br />
The following section should be regarded as a guide.<br />
SHORT TERM – PRIOR TO 2011<br />
Known Plans<br />
2007 – International train services from Ebbsfleet now in place.<br />
2007 – Proposed diversion <strong>of</strong> Fastrack route B via Ebbsfleet now in place.<br />
(May need to consider enhancement <strong>of</strong> 480 / 490 between<br />
Gravesend and Greenhi<strong>the</strong>).<br />
2008 / 09 – National smart card scheme for buses (driven by national<br />
concessionary scheme.)<br />
2009 – Domestic train services from Ebbsfleet, Major update <strong>of</strong><br />
Sou<strong>the</strong>astern Railway timetable.<br />
2011 – Proposed introduction <strong>of</strong> Fastrack route C (circular via<br />
Swanscombe Peninsula.)<br />
A – Marketing<br />
Develop marketing strategy for public transport in <strong>the</strong> area.<br />
Consider locations for fur<strong>the</strong>r information kiosk / enquiry points.<br />
B – Bus and Train Services<br />
Protect A2 Trunk Road corridor south <strong>of</strong> Gravesend as public transport corridor like<br />
for a coach park and ride.<br />
Fur<strong>the</strong>r study to investigate viability <strong>of</strong> SE Gravesend – Ebbsfleet bus service.<br />
Seek opportunities to enhance bus service frequency and coverage and hours <strong>of</strong><br />
operation, particularly evening and Sunday services.<br />
C – Fastrack Buses<br />
Fastrack buses introduced in 2006 / 07 will require refurbishment at a 5 year point,<br />
to maintain ‘premium’ status.<br />
Continue to monitor developments such as hybrid fuel technology, for <strong>the</strong> Fastrack<br />
fleet.<br />
KTS <strong>Transport</strong> <strong>Strategy</strong> - Technical Summary Final October 2008.doc / Oct-08
D – Infrastructure<br />
Undertake detailed review <strong>of</strong> bus stations and interchanges to assess suitability for<br />
expanded network / enhanced frequencies / larger buses.<br />
Need for improved bus interchange in <strong>Dartford</strong> (or possible bus station) and<br />
Gravesend to be kept in mind with town centre regeneration planning.<br />
Carry out detailed bus stop audit against best practice / accessibility criteria, and set<br />
strategy / programme <strong>of</strong> prioritised improvements. (Implementation could follow<br />
after marketing review, as local corporate image may be proposed.)<br />
Discuss signage with train operating companies and borough councils with view to<br />
improving signage to and between public transport stops / stations. (implementation<br />
may be guided by marketing strategy.)<br />
Continue to ensure that resources are directed to maintenance <strong>of</strong> roadside<br />
equipment.<br />
Infrastructure developments / changes in areas that may be served by Fastrack<br />
should be compatible with articulated bus or light rail vehicle operation, all o<strong>the</strong>r<br />
infrastructure should be designed to be compatible with full size buses.<br />
Seek opportunities to improve facilities and accessibility at railway stations.<br />
Lobby for eastward extension <strong>of</strong> Crossrail.<br />
E – Safety and Security<br />
Continue to roll out CCTV coverage <strong>of</strong> bus stops.<br />
Pilot schools education programme for using public transport.<br />
F – Information<br />
Analysis <strong>of</strong> current status <strong>of</strong> Real Time Passenger Information (RTPI) system.<br />
Continue to roll out RTPI displays and ‘next stop’ information, including information<br />
at busy locations o<strong>the</strong>r than bus stops (e.g. shopping centres) and via major<br />
employers.<br />
Publicise ‘Traveline TXT’ facility, and seek integration with RTPI system so that real<br />
time information can be given by SMS message.<br />
G – Ticketing and Payment Methods<br />
Smartcards likely to be introduced for concessionary fares in 2008 / 09.<br />
Develop strategy towards introducing smartcard ticketing for o<strong>the</strong>r passengers, with<br />
functionality to cover a range <strong>of</strong> travel habits.<br />
Liaison with train operating companies and <strong>Transport</strong> for London (TfL) over ticketing<br />
compatibility issues.<br />
Keep mobile phone ticketing under review – still developing at present.<br />
Consider introduction <strong>of</strong> ‘<strong>Thameside</strong> Zone’ as a PlusBus option.<br />
KTS <strong>Transport</strong> <strong>Strategy</strong> - Technical Summary Final October 2008.doc / Oct-08
H – Highway Issues and Bus Priority<br />
Highway schemes and improvements on existing or potential bus routes to be made<br />
‘future pro<strong>of</strong>’ – allowing for possibility <strong>of</strong> articulated buses or light rail vehicles on<br />
Fastrack routes, 12-13 metre long buses on non Fastrack routes where practical.<br />
Protect A2 Trunk Road corridor south <strong>of</strong> Gravesend as public transport corridor like<br />
for a coach park and ride<br />
Identify and protect a bus link into Northfleet Embankment as well as into<br />
Gravesend Town Centre.<br />
Liaise with Darent Valley Hospital and Bluewater management over possible<br />
improvements to bus access and priority.<br />
Roll out <strong>of</strong> fur<strong>the</strong>r Selective Vehicle Detection at traffic signals.<br />
Investigate priority measures for buses emerging from Greenhi<strong>the</strong>, Station Road.<br />
Bus Priority to be included in Gravesend Town Centre plans (e.g. Rathmore Road<br />
Link), alternative bus route to be investigated if road network south <strong>of</strong> Gravesend<br />
Station to become two-way.<br />
Bus links for Denton / NE Gravesend require fur<strong>the</strong>r consideration (dependent on<br />
progress with development) – links may need prior identification and protection.)<br />
I – Park and Ride<br />
Fur<strong>the</strong>r consideration <strong>of</strong> park and ride from Bluewater and Ebbsfleet – liaison with<br />
site owners.<br />
Protect site at Tollgate.<br />
J – Partnerships and Working Arrangements<br />
Establish Punctuality Improvement Partnership.<br />
Involve bus operators in design <strong>of</strong> bus related facilities and infrastructure.<br />
Seek bus operator / bus service manager representation in local business<br />
community.<br />
Seek greater community involvement in transport provision.<br />
Explore options for moving towards network franchise arrangement.<br />
K – Taxis<br />
Review taxi ranks in consultation with trade, taking into account accessibility and<br />
security issues as well as plans for town centre redevelopments.<br />
Improve signage at taxi ranks following review (and in light <strong>of</strong> marketing strategy).<br />
Include taxi rank locations in public transport information.<br />
KTS <strong>Transport</strong> <strong>Strategy</strong> - Technical Summary Final October 2008.doc / Oct-08
MEDIUM TERM – 2011 TO 2018<br />
Known Plans<br />
Northfleet Bus Garage identified as housing site by ARRIVA. Need to liaise with<br />
ARRIVA on future bus garaging and possible locations<br />
2014 – <strong>Dartford</strong> and Gravesham Councils existing bus shelter contracts expire.<br />
2014 Current Sou<strong>the</strong>astern Railway franchise ends.<br />
2018 – Proposed introduction <strong>of</strong> Fastrack route D via Northfleet Embankment.<br />
A – Marketing<br />
Continue to review marketing strategy in line with available data from smartcard<br />
use.<br />
B – Bus and Train Services<br />
Continue to bring key bus services’ hours <strong>of</strong> operation and frequency into line with<br />
Fastrack.<br />
Consider introduction <strong>of</strong> all-night bus service.<br />
Consultation for 2014 re-franchise <strong>of</strong> Sou<strong>the</strong>astern network.<br />
C – Buses<br />
Fastrack buses introduced in 2006 / 07 will require replacement at about 2013 / 14<br />
to maintain ‘premium’ status <strong>of</strong> Fastrack (vehicles may be suitable for cascade to<br />
o<strong>the</strong>r local services). Prior consideration will be needed whe<strong>the</strong>r to stay with<br />
conventional technology, or move to light rail / hybrid / trolleybus / articulated bus,<br />
as well as to funding source(s) – this will need to take into account lead time <strong>of</strong><br />
construction / vehicle sourcing if light rail is adopted.<br />
Fastrack buses introduced in 2011 will require refurbishment around 2014 / 15.<br />
Experience with 2013 / 14 batch <strong>of</strong> buses will guide decision for 2018 batch <strong>of</strong><br />
buses for route D, and to replace 2011 buses.<br />
Buses on key service 480 / 490 will reach end <strong>of</strong> life – possible opportunity for<br />
cascade <strong>of</strong> current Fastrack A / B vehicles if new vehicles can not be justified.<br />
D - Infrastructure<br />
Identify potential bus depot sites and consider future depot ownership issues in <strong>the</strong><br />
light <strong>of</strong> Northfleet Garage redevelopment (This may be required sooner, depending<br />
on developer interest in site.)<br />
Form strategy for renewal <strong>of</strong> bus shelter contracts for 2014. May be economies <strong>of</strong><br />
scale in <strong>the</strong> two Boroughs collaborating, may also bring benefits <strong>of</strong> network identity<br />
in wider <strong>Kent</strong> <strong>Thameside</strong>.<br />
E – Safety and Security<br />
Continue to roll out CCTV coverage <strong>of</strong> bus stops.<br />
Expand schools education programme, and repeat for new pupils.<br />
F - Information<br />
Continue to expand RTPI / on bus information – may become routine expectation.<br />
KTS <strong>Transport</strong> <strong>Strategy</strong> - Technical Summary Final October 2008.doc / Oct-08
Some existing equipment may need renewal / replacement. New technology may<br />
develop that could render existing systems obsolete – need to monitor situation.<br />
G – Ticketing and Payment Methods<br />
Continue to roll out smart card ticketing, possible introduction <strong>of</strong> mobile phone<br />
ticketing.<br />
Review suitability <strong>of</strong> existing electronic ticket machines.<br />
H – Highway Issues and Bus Priority<br />
Fur<strong>the</strong>r bus priority to be investigated as and when future development considered,<br />
or when land becomes available. Identify and protect links prior to 2018 phase <strong>of</strong><br />
Fastrack.<br />
I – Park and Ride<br />
Likely implementation <strong>of</strong> Tollgate if it is not practical to proceed with Bluewater and<br />
Ebbsfleet.<br />
Review need for park and ride for Gravesend and <strong>Dartford</strong> town centres in <strong>the</strong> light<br />
<strong>of</strong> demand for long stay parking.<br />
J – Partnerships & Working Arrangements<br />
Develop business plan towards franchising arrangements.<br />
K – Taxis<br />
Continue to review ranks in <strong>the</strong> light <strong>of</strong> town centre developments, possible changes<br />
to vehicle design / accessibility requirements.<br />
LONG TERM – POST 2018<br />
A – Marketing<br />
Fastrack franchise to be reviewed – may also see o<strong>the</strong>r local bus services brought<br />
into franchise / quality contract situation, which would give opportunity to renew and<br />
re-launch ‘<strong>Thameside</strong> Public <strong>Transport</strong>’ brand.<br />
B – Bus and Train Services<br />
Continue to bring key bus services’ hours <strong>of</strong> operation and frequency into line with<br />
Fastrack.<br />
2018 final stage <strong>of</strong> Fastrack may be appropriate point to introduce ‘area franchise’<br />
for local bus services.<br />
Review future needs in <strong>the</strong> light <strong>of</strong> experience and proposed developments – fur<strong>the</strong>r<br />
phases <strong>of</strong> Fastrack, ei<strong>the</strong>r to new developments or upgrading existing local bus<br />
services, may be appropriate.<br />
Crossrail comes in on or around this time leading to improved rail connections at<br />
nearby Abbey Wood.<br />
C – Buses<br />
Fastrack buses on route C will be due for renewal / cascade in 2018/19. Fastrack<br />
fleet will continue to require regular refurbishment and renewal to maintain premium<br />
/ ‘state <strong>of</strong> <strong>the</strong> art’ status.<br />
KTS <strong>Transport</strong> <strong>Strategy</strong> - Technical Summary Final October 2008.doc / Oct-08
At each stage <strong>of</strong> vehicle renewal, consider upgrade to articulated bus / hybrid /<br />
trolley bus / light rail, bearing in mind lead times for procurement <strong>of</strong> vehicles and<br />
infrastructure.<br />
D - Infrastructure<br />
Continue programme <strong>of</strong> maintenance / renewal.<br />
E – Safety and Security<br />
Continue to roll out CCTV coverage <strong>of</strong> bus stops / renew existing equipment in <strong>the</strong><br />
light <strong>of</strong> technology <strong>the</strong>n available.<br />
Review schools education programme.<br />
F - Information<br />
Continue to expand RTPI / on bus information – may become routine expectation.<br />
Some existing equipment may need renewal / replacement. New technology may<br />
develop that could render existing systems obsolete – need to monitor situation.<br />
G – Ticketing and Payment Methods<br />
If area franchise introduced, <strong>of</strong>fers opportunity for review <strong>of</strong> fares and ticketing<br />
policy.<br />
Continued development <strong>of</strong> smartcards and mobile phone ticketing.<br />
H – Highway Issues and Bus Priority<br />
Review needs in light <strong>of</strong> experience, technology available and planned future<br />
developments – e.g. fur<strong>the</strong>r phases <strong>of</strong> Fastrack.<br />
I – Park and Ride<br />
Review arrangements in <strong>the</strong> light <strong>of</strong> demand.<br />
J – Partnerships and Working Arrangements<br />
Possible introduction <strong>of</strong> area franchise to coincide with final phase <strong>of</strong> current<br />
Fastrack plans.<br />
K – Taxis<br />
Continue to review ranks in <strong>the</strong> light <strong>of</strong> developments.<br />
KTS <strong>Transport</strong> <strong>Strategy</strong> - Technical Summary Final October 2008.doc / Oct-08
Urban Traffic Management & Control (UTMC) Action Plans<br />
The UTMC action plan can be summarised as follows:<br />
2007 - 2011<br />
• <strong>Dartford</strong> Town Centre car park guidance Variable Message Signs (VMS) to<br />
be installed. Gravesham VMS was introduced in 2007.<br />
• Construct bus pre signal junctions. Make sure appropriate equipment is<br />
installed in traffic signal controllers to allow priority to Fastrack C services<br />
starting 2011.<br />
• Identify and prioritise key junctions for traffic signal control to be installed.<br />
• Install RTPI on 50% <strong>of</strong> bus stops. Key routes and stops to be identified and<br />
installed first. Note this is an indicative target that came out from <strong>the</strong> UTMC<br />
study and a detailed study is now being conducted on this issue and <strong>the</strong><br />
target may change following completion <strong>of</strong> <strong>the</strong> studies.<br />
• Identify key routes to install ANPR cameras for journey time information and<br />
traffic monitoring.<br />
• Install CCTV networks on Fastrack A and B routes to allow monitoring <strong>of</strong><br />
traffic and bus stop activity.<br />
• Expand <strong>Kent</strong> Traffic and Travel website to provide more data to users.<br />
• Asses and take measures to ensure that <strong>the</strong> HA and <strong>Kent</strong> UTMC systems<br />
can fully exchange data.<br />
2011 - 2018<br />
• Install VMS network to provide travel information.<br />
• Complete ANPR network. Identify any additional sites required.<br />
• Install CCTV cameras at key junctions.<br />
• Complete RTPI network.<br />
• Check infrastructure for Fastrack D services.<br />
• Installation <strong>of</strong> SCOOT networks upon completion <strong>of</strong> junction upgrades.<br />
• Traffic Management Centre (TMC) site to be identified and constructed. All<br />
appropriate communications links to be installed including link up with <strong>Kent</strong><br />
TMC and <strong>the</strong> Highway Agency’s Godstone Regional Traffic Control Centre.<br />
2018 – 2025<br />
• Extend UTMC systems to include new developments upon completion.<br />
A number <strong>of</strong> actions are considered on going and will recur throughout <strong>the</strong> life <strong>of</strong> <strong>the</strong><br />
UTMC action plan.<br />
• SCOOT network validation.<br />
• Diversion routes and congestion reducing strategies to be checked for<br />
effectiveness and revised if required.<br />
• Traffic signals health checks.<br />
• Update communications infrastructure and UTMC equipment to be in line<br />
with technological advancements.<br />
KTS <strong>Transport</strong> <strong>Strategy</strong> - Technical Summary Final October 2008.doc / Oct-08
Walking and Cycling Action Plans<br />
The recommended goals for <strong>the</strong> period up to 2011 and post 2011 is as follows:<br />
2011<br />
By 2011 <strong>the</strong> following should have been achieved:<br />
• Implement <strong>the</strong> quick wins identified in <strong>the</strong> <strong>Kent</strong> <strong>Thameside</strong> Cycle <strong>Strategy</strong>.<br />
• Achieve Local <strong>Transport</strong> Plan (LTP) targets in relation to cycle trips in <strong>Kent</strong><br />
<strong>Thameside</strong> and sustainable access to schools.<br />
• Stabilise share <strong>of</strong> walking and cycle journeys to work compared to <strong>the</strong> 2001<br />
census, given <strong>the</strong> national trends in declining walking and cycling observed<br />
subsequently.<br />
• Improve access and security to increase walking and cycle modal share for<br />
journeys to railway stations.<br />
• Improve pedestrian access between Northfleet and Ebbsfleet International<br />
stations.<br />
• Carry out a comprehensive programme to resurface/ improve <strong>the</strong><br />
maintenance <strong>of</strong> town centre footways.<br />
• Increase <strong>the</strong> size <strong>of</strong> <strong>the</strong> Public Rights <strong>of</strong> Way (PROW) network and increase<br />
<strong>the</strong> proportion which is bridleway status to foster increases in cycling and<br />
horse-riding.<br />
• Provide <strong>the</strong> basis <strong>of</strong> a high quality riverside walk/ cycle route between <strong>the</strong><br />
River Darent and Gravesend.<br />
• Provide a re-launched and enhanced Darent Valley path with cycle facilities<br />
between <strong>the</strong> River Thames and Hawley.<br />
• Re-launch <strong>the</strong> Wealdway and produce a Northwest <strong>Kent</strong> walks pack.<br />
• Improved walking and cycling along <strong>the</strong> old A2 Trunk Road alignment which<br />
is due around 2009<br />
2011 +<br />
Post 2011, <strong>the</strong> objective should be to:<br />
• Reverse <strong>the</strong> long-term decline in walking and cycling journeys to work.<br />
• Implement low car developments in town centres<br />
• Introduce an improved way marking scheme within <strong>Dartford</strong> and Gravesend<br />
using local vernacular <strong>the</strong>mes while being easy to use and reducing <strong>the</strong><br />
amount <strong>of</strong> street clutter.<br />
• Carry out a comprehensive resurfacing programme for footways in existing<br />
residential areas.<br />
• Ensure that pedestrian and cyclist needs are taken into account for <strong>the</strong><br />
planning <strong>of</strong> key highway schemes such as <strong>the</strong> Denton Relief Road and<br />
Peninsula Way.<br />
• Install dropped kerbs on all key radial routes and priorities identified by<br />
Access Groups.<br />
• Secure “Access for All” funding and implementation for measures to improve<br />
accessibility at all <strong>the</strong> North <strong>Kent</strong> line stations between <strong>Dartford</strong> and<br />
Gravesend.<br />
• Improve access between sou<strong>the</strong>rn Gravesend, Ebbsfleet, Eastern Quarry<br />
and <strong>the</strong> North Downs PROW network to <strong>the</strong> south <strong>of</strong> <strong>the</strong> A2 Trunk Road.<br />
Provide a complete Thames path with <strong>the</strong> final links through a redeveloped<br />
Northfleet Embankment site and links through to existing settlements to <strong>the</strong><br />
south<br />
• Use future Rights <strong>of</strong> Way Improvement Plans to increase <strong>the</strong> size <strong>of</strong> <strong>the</strong><br />
network and amount available to cyclists and equestrians<br />
• Carry out feasibility studies into <strong>the</strong> converting <strong>of</strong> one <strong>of</strong> <strong>the</strong> tunnels between<br />
Bluewater and Eastern Quarry 2 for use by cycles and pedestrians only<br />
KTS <strong>Transport</strong> <strong>Strategy</strong> - Technical Summary Final October 2008.doc / Oct-08
• Increase <strong>the</strong> proportion <strong>of</strong> <strong>Kent</strong> <strong>Thameside</strong> residents who use <strong>the</strong> PROW<br />
network at least every six months to 50%.Implement <strong>the</strong> comprehensive<br />
cycle network identified for 2025 through <strong>the</strong> completion <strong>of</strong> fur<strong>the</strong>r cycle<br />
links, such as routes between Slade Green and The Bridge, and Stone Gate<br />
and Stone Village.<br />
• Meet targets identified by future LTPs, such as fur<strong>the</strong>r increases in cycling<br />
and sustainable travel to school.<br />
Parking Action Plans<br />
Parking provision is recognised as an area where <strong>the</strong> demands <strong>of</strong> <strong>the</strong> overall vision<br />
<strong>of</strong> a sustainable <strong>Kent</strong> <strong>Thameside</strong> may conflict with local objectives and preferences.<br />
The proposed accessibility assessment will provide a useful reality check on this<br />
aspect and feed usefully into a debate with key stakeholders as to <strong>the</strong> next stage <strong>of</strong><br />
developing <strong>the</strong> Parking <strong>Strategy</strong>.<br />
Parking action plans can be summarised as follows:<br />
2007-2011<br />
1 Car Parks:<br />
• Improve security, lighting and pedestrian facilities within all town centre Multistorey<br />
car parks (MSCPs).<br />
• Increase CCTV and patrols at peripheral long stay car parks.<br />
• All car parks to meet Park Mark for Safety standard.<br />
• Suitable parking amenities for pedal and motorised cycles to be introduced at<br />
all suitable car parking sites.<br />
• Ensure all town centre car parks are DDA compliant and <strong>of</strong>fer spaces<br />
reserved for Blue badge holders.<br />
• Improve pedestrian links and disabled access at Milton Place Car Parks.<br />
• Expand existing Shopmobility schemes to all town centre and retail/leisure<br />
developments.<br />
• Seek additional weekday Gravesend rail user spaces in Thamesgate or<br />
Parrock Street short stay car parks.<br />
• Introduce <strong>Dartford</strong> town centre Controlled Parking Zone (CPZ) scheme and<br />
acquire new 120 space long stay car park at Victoria Road to accommodate<br />
displaced existing commuter parking.<br />
• Annual review <strong>of</strong> town centre demand and supply.<br />
• Heritage Quarter, Gravesend and Lowfield/Market Street, <strong>Dartford</strong><br />
developments assumed complete.<br />
• Bluewater to improve real time parking and driver information.<br />
2 Signing and Information:<br />
• Install real time parking information in <strong>Dartford</strong> town centre.<br />
• Distribute publicity materials regarding car park destinations and recent<br />
improvements.<br />
• Improve town centre signage to car parks.<br />
3 Enforcement:<br />
• Improve and introduce signage, markings and Traffic Regulation Orders<br />
(TROs) where necessary.<br />
• Increase patrols in line with <strong>the</strong> introduction <strong>of</strong> new schemes to facilitate<br />
effective enforcement.<br />
KTS <strong>Transport</strong> <strong>Strategy</strong> - Technical Summary Final October 2008.doc / Oct-08
• ‘Use surplus ring fenced monies generated by <strong>the</strong> issue <strong>of</strong> on street Penalty<br />
Charge Notices (PCNs) (as detailed in <strong>the</strong> licence agreements with <strong>the</strong><br />
district councils) to fund improvements to parking facilities or sustainable<br />
transport schemes.<br />
• Fur<strong>the</strong>r parking controls to be introduced on streets surrounding all KTS<br />
stations.<br />
• Area wide resident permit schemes near to public transport interchanges and<br />
employment centres.<br />
4 Pricing:<br />
• Increase parking charges for Gravesend rail users to reflect Ebbsfleet prices.<br />
• Increase <strong>Dartford</strong> rail user parking charges as a means <strong>of</strong> containing <strong>the</strong><br />
existing amount <strong>of</strong> rail heading.<br />
• Introduce parking charge at Greenhi<strong>the</strong> station.<br />
• Stepped increase in town centre long stay parking charges to £5.00 per day<br />
by 2011 in line with regeneration and increased kerb space management.<br />
• Introduce pricing mechanism to encourage peak spreading.<br />
• Increase price <strong>of</strong> short stay parking in line with rate <strong>of</strong> inflation plus an x% as<br />
regeneration and services within <strong>the</strong> urban centres come on line and <strong>the</strong><br />
kerb space is managed. The tariff will have to consider its’ pricing relative to<br />
o<strong>the</strong>r areas and private parking along with accessibility issues and cost <strong>of</strong><br />
travel by o<strong>the</strong>r modes.<br />
• Integrate long stay parking charges into <strong>the</strong> localised price increase x%<br />
beyond <strong>the</strong> targeted £5.00 after 2011.<br />
• Introduce Workplace Parking Levies (WPLs) at employment developments<br />
particularly adjacent to public transport interchanges.<br />
5 Policy:<br />
• Discourage any net increase in town centre long stay parking except maybe<br />
for station traffic where rail heading may benefit <strong>the</strong> wider network.<br />
• Encourage <strong>the</strong> use <strong>of</strong> space efficient forms <strong>of</strong> transportation e.g. cycling and<br />
motorcycling by means <strong>of</strong> pricing incentives and parking facility<br />
improvements.<br />
• Employment, Retail and Leisure parking standards to be considered at a<br />
25% reduction <strong>of</strong> current SPG 4 levels.<br />
• Residential parking standards in urban villages where good public transport<br />
links exist to be considered at 1.5 spaces per dwelling with additional<br />
provision available through shared/leased <strong>of</strong>f peak parking at nearby private<br />
Non Residential land uses.<br />
• Residential parking standards in town centres to be considered at 1 space<br />
per dwelling – visitor/casual <strong>of</strong>f peak parking available in public <strong>of</strong>f street car<br />
parks.<br />
• Parking strategy to be submitted with all major development applications to<br />
ensure that it conforms to surrounding area objectives.<br />
• High quality travel plans and travel demand toolkits to be submitted with all<br />
new development applications.<br />
6 Travel Demand Management:<br />
• Set up KTS Travel Plan Partnership – KCC, DBC, GBC and key<br />
stakeholders.<br />
• Promote work place travel plans.<br />
• Promote residential travel plans.<br />
• Promote travel plans at existing developments.<br />
KTS <strong>Transport</strong> <strong>Strategy</strong> - Technical Summary Final October 2008.doc / Oct-08
7 Fur<strong>the</strong>r Work<br />
• Conduct area wide surveys into public perceptions <strong>of</strong> parking quality, prices<br />
and requirements.<br />
• Build partnership with third party car park providers and involve in parking<br />
strategy.<br />
• Conduct Park and Ride feasibility study.<br />
• Review Parking <strong>Strategy</strong> 2011 in line with LTP3 and incorporate in<br />
completed GBC and DBC LDFs.<br />
• Conduct investigation work into improvements in bus/rail interchange at<br />
<strong>Dartford</strong> station.<br />
A number <strong>of</strong> Actions are considered ongoing and will recur throughout <strong>the</strong> life time<br />
<strong>of</strong> <strong>the</strong> Parking <strong>Strategy</strong>.<br />
2011+<br />
• Reintegrate Westgate MSCP with <strong>Dartford</strong> town centre, introduce active<br />
frontage and improved security and pedestrian facilities.<br />
• Expand real time parking information to outer cordon on town centre<br />
approaches.<br />
• Introduce real time parking information to third party controlled parking<br />
destinations throughout KTS.<br />
• Invest in parking enforcement technology i.e. number plate recognition and<br />
cameras, CCTV enforcement.<br />
• <strong>Transport</strong> Quarter, Gravesend assumed complete.<br />
• Permanent solution required for additional Gravesend rail user parking<br />
demand.<br />
• Seek town centre weekday long stay spaces in under utilised short stay<br />
spaces (in <strong>the</strong> event <strong>of</strong> no park and ride).<br />
• Consider widespread introduction <strong>of</strong> WPLs.<br />
• Fur<strong>the</strong>r reductions in employment, retail and leisure parking standards<br />
(2011-2018 30% reduction from current SPG4, 2018-2025 40% reduction<br />
from current SPG4).<br />
• 2011-2018 – Residential Parking Standards in urban villages 1.3 spaces per<br />
dwelling (with additional provision available through shared/leased <strong>of</strong>f peak<br />
parking at nearby Private Non Residential land uses) where supported by<br />
strong public transportation links.<br />
• 2018-2025 – Residential Parking Standards in urban villages 1 space per<br />
dwelling (with additional provision available through shared/leased <strong>of</strong>f peak<br />
parking at nearby Private Non Residential land uses) where supported by<br />
strong public transportation links.<br />
• 2018+ Consider car free residential developments where supported in areas<br />
that have access to strong sustainable transport networks.<br />
• Construct park and ride facility subject to outcome <strong>of</strong> Feasibility Study.<br />
The Parking <strong>Strategy</strong> and action plans should remain flexible and be reviewed every<br />
5 years to remain consistent with reviews <strong>of</strong> Local <strong>Transport</strong> Plans and Local<br />
<strong>Development</strong> Frameworks.<br />
KTS <strong>Transport</strong> <strong>Strategy</strong> - Technical Summary Final October 2008.doc / Oct-08
Appendix D - Junctions that exceed 85% Volume Capacity Ratios<br />
Junctions that exceed <strong>the</strong> 85% volume-capacity ratios overall are very likely to be<br />
overloaded at some time during <strong>the</strong> peak period and would need detailed<br />
investigation with junction models to confirm whe<strong>the</strong>r <strong>the</strong>re is a problem. Therefore<br />
one should treat <strong>the</strong> KTS Model results on which this list is supplied as indicative<br />
only that <strong>the</strong>re maybe a junction problem that needs addressing with more detailed<br />
studies. These junctions should be monitored as <strong>the</strong> development progresses and<br />
traffic levels increase. The junction locations for 2005 and 2025 are shown below.<br />
2005 PM Base 2025 PM Without STIPS<br />
Schemes<br />
2025 PM With STIPS<br />
Schemes<br />
1 A2 eb merge area at A282 J2 A2 eb merge area at A282 J2 A2 eb merge area at A282 J2<br />
2 A2 eb diverge area at Bean A2 eb diverge area at Bean A2 eb diverge area at Bean<br />
3 A2 eb merge area at Tollgate A2 eb merge area at Tollgate A2 eb merge area at Tollgate<br />
4 A2 eb diverge area at Tollgate 1 A2 eb diverge area at Tollgate 1 A2 eb diverge area at Tollgate 1<br />
5 A2 eb diverge area at Tollgate 2 A2 eb diverge area at Tollgate 2<br />
6 A2 eb diverge area at Marlings<br />
Cross 1<br />
7 A2 eb diverge area at Marlings<br />
Cross 2<br />
A2 eb diverge area at Marlings<br />
Cross 1<br />
8 Crossing Facility on Parrock St<br />
Gravesend TC<br />
Crossing Facility on Parrock St<br />
Gravesend TC<br />
9 A226 Rochester Rd and B261<br />
(Lion Rbt)<br />
A2 eb diverge area at Marlings<br />
Cross 1<br />
Crossing Facility on Parrock St<br />
Gravesend TC<br />
10 A227 Tollgate and Coldharbour Rd A227 Tollgate and Coldharbour Rd<br />
11 A226 West St and access to St<br />
George’s Centre<br />
12 B262 Springhead Rd and Hall Rd<br />
Rbt<br />
A226 West St and access to St<br />
George’s Centre<br />
13 A2 eb merge area at Pepperhill A2 eb merge area at Pepperhill<br />
14 A2 eb merge area at Southfleet A2 eb merge area at Southfleet<br />
15 A2 eb diverge area at Southfleet A2 eb diverge area at Southfleet<br />
16 A2 Ebbsfleet interchange Western<br />
rbt<br />
17 A2 Ebbsfleet interchange Eastern<br />
rbt<br />
18 A2 eb merge area at Bean 1 A2 eb merge area at Bean 1<br />
19 A2 eb merge area at Bean 2 A2 eb merge area at Bean 2<br />
20 Eastern Quarry sou<strong>the</strong>rn access to<br />
A296 Watling St<br />
21 Eastern Quarry nor<strong>the</strong>rn access to<br />
Mounts Rd / Alkerden Lane<br />
22 A226 London Rd / B255 St A226 London Rd / B255 St<br />
KTS <strong>Transport</strong> <strong>Strategy</strong> - Technical Summary Final October 2008.doc / Oct-08
Clements Way<br />
Clements Way<br />
23 Crossing facility east <strong>of</strong> A226<br />
London Rd / B225<br />
Crossing facility east <strong>of</strong> A226<br />
London Rd / B225<br />
24 A226 London Rd / Mounts Rd<br />
Greenhi<strong>the</strong><br />
A226 London Rd / Mounts Rd<br />
Greenhi<strong>the</strong><br />
25 A226 London Rd / B255 The<br />
Avenue<br />
A226 London Rd / B255 The<br />
Avenue<br />
26 A226 London Rd / Knockhall A226 London Rd / Knockhall Chase<br />
Chase<br />
27 A282 J1a nb merge area A282 J1a nb merge area<br />
28 A282 J1a sb merge area<br />
29 A206 Crossways Boulevard<br />
approach to A282 J1a eastern rbt<br />
30 A206 Bob Dunn Way and Marsh<br />
St<br />
31 A206 Bob Dunn Way and Joyce<br />
Green Lane<br />
A206 Bob Dunn Way and Joyce<br />
Green Lane<br />
32 A206 Bob Dunn Way and A2026<br />
Burnham Rd<br />
A206 Bob Dunn Way and A2026<br />
Burnham Rd<br />
33 A206 Thames Rd and B2186<br />
Crayford Way<br />
A206 Thames Rd and B2186<br />
Crayford Way<br />
34 A225 Princes Rd / A296 Park Rd /<br />
B260 Green St Green Rd rbt,<br />
<strong>Dartford</strong><br />
A225 Princes Rd / A296 Park Rd /<br />
B260 Green St Green Rd rbt,<br />
<strong>Dartford</strong><br />
35 A226 East Hill / A296 Park Rd,<br />
<strong>Dartford</strong><br />
A226 East Hill / A296 Park Rd,<br />
<strong>Dartford</strong><br />
36 Crossing facility at A226 East Hill,<br />
<strong>Dartford</strong><br />
Crossing facility at A226 East Hill,<br />
<strong>Dartford</strong><br />
37 A226 East Hill and Home<br />
Gardens, <strong>Dartford</strong><br />
A226 East Hill and Home Gardens,<br />
<strong>Dartford</strong><br />
38 Hy<strong>the</strong> St south <strong>of</strong> Westgate Rd,<br />
<strong>Dartford</strong> town centre<br />
Hy<strong>the</strong> St south <strong>of</strong> Westgate Rd,<br />
<strong>Dartford</strong> town centre<br />
39 B261 Old Road West and Pelham<br />
Rd<br />
40 B262 Springhead Rd and<br />
Waterdales<br />
41 Bluewater Access rbt<br />
42 Eastern Quarry western access<br />
south <strong>of</strong> Alkerden Lane<br />
KTS <strong>Transport</strong> <strong>Strategy</strong> - Technical Summary Final October 2008.doc / Oct-08
Appendix E - References<br />
(i)<br />
Reference Sources<br />
<strong>Kent</strong> County Council (2006): Local <strong>Transport</strong> Plan for <strong>Kent</strong> 2006 - 2011<br />
<strong>Dartford</strong> Borough Council (2007): Local <strong>Development</strong> Framework Core <strong>Strategy</strong>-<br />
<strong>Kent</strong> <strong>Thameside</strong> Strategic <strong>Transport</strong> Programme.<br />
David Lock Associates (2007): <strong>Kent</strong> Strategic Tariff Study- Evidence Based.<br />
General Assembly <strong>of</strong> <strong>the</strong> Council (2007): <strong>Kent</strong> <strong>Thameside</strong> Strategic <strong>Transport</strong><br />
Programme- Agenda item 10.<br />
Hunt, P, B et al. (1981): SCOOT: A traffic responsive method <strong>of</strong> co-ordinating<br />
signals. TRRL Report LR1014.<br />
Jacobs, (2007): <strong>Kent</strong> <strong>Thameside</strong>: Scoping Report on <strong>Transport</strong> Schemes-Final<br />
Version.<br />
JMP Consulting: TRICS® Good Practice Guide 2007.<br />
Landscape Design Associates (2004): <strong>Kent</strong> <strong>Thameside</strong> Green Grid – Figure 6 –<br />
Design <strong>Strategy</strong> Framework Plan.<br />
Network Rail (2008): South London Route Utilisation <strong>Strategy</strong>.<br />
Fastrack: The first six months, A report by <strong>the</strong> Fastrack Delivery Executive<br />
(ii)<br />
Technical Notes Underpinning <strong>the</strong> KTS <strong>Strategy</strong><br />
Faber Maunsell (2007): <strong>Kent</strong> <strong>Thameside</strong>- Trunk Road Network <strong>Strategy</strong>- Final<br />
Version.<br />
Jacobs (2007): <strong>Kent</strong> <strong>Thameside</strong>- Demand Management Summary.<br />
Jacobs (2007): <strong>Kent</strong> <strong>Thameside</strong>- Public <strong>Transport</strong> <strong>Strategy</strong>.<br />
Jacobs (2007): <strong>Kent</strong> <strong>Thameside</strong>- UTMC Study.<br />
Jacobs, (2007): <strong>Kent</strong> <strong>Thameside</strong> <strong>Transport</strong> <strong>Strategy</strong>- Local Traffic Management<br />
Summary.<br />
Jacobs, (2007): <strong>Kent</strong> <strong>Thameside</strong>- Draft Walking and Cycling <strong>Strategy</strong>.<br />
Jacobs (2007): <strong>Kent</strong> <strong>Thameside</strong>- Draft Parking <strong>Strategy</strong>.<br />
Jacobs (2007): Northwest <strong>Kent</strong> <strong>Thameside</strong> Micro-simulation <strong>Transport</strong> Model<br />
Report.<br />
Jacobs, (2008): <strong>Kent</strong> <strong>Thameside</strong>- Modelling Results <strong>of</strong> <strong>the</strong> Strategic <strong>Transport</strong><br />
Investment Package.<br />
Jacobs, (2008): <strong>Kent</strong> <strong>Thameside</strong>- KTS Model Revalidation to 2005: Local Model<br />
Validation Report.<br />
KTS <strong>Transport</strong> <strong>Strategy</strong> - Technical Summary Final October 2008.doc / Oct-08
Appendix F - Glossary <strong>of</strong> Commonly Used Terms<br />
Acronym<br />
ANPR<br />
AQMA<br />
ASK<br />
CCTV<br />
CPZ<br />
DBC<br />
DCLG<br />
DDA<br />
DfT<br />
EMS<br />
GBC<br />
HA<br />
HS 1<br />
ITS<br />
KCC<br />
KTS<br />
KTSDB<br />
LDF<br />
LTP<br />
MSCP<br />
PCN<br />
PIPKIN<br />
PROW<br />
PT<br />
RCC<br />
RPG 9a<br />
RTI<br />
RTPI<br />
RUS<br />
SCOOT<br />
SEERA<br />
SPG 4<br />
STDR 1<br />
STDR 4<br />
STIPS<br />
TfL<br />
TMC<br />
TRO<br />
UTC<br />
UTMC<br />
VMS<br />
WPL<br />
Definition<br />
Automatic Number Plate Recognition<br />
Air Quality Management Area<br />
Accessibility <strong>Strategy</strong> for <strong>Kent</strong><br />
Closed Circuit Television<br />
Controlled Parking Zone<br />
<strong>Dartford</strong> Borough Council<br />
Department for Communities and Local Government<br />
Disability Discrimination Act<br />
Department for <strong>Transport</strong><br />
Enhanced Message Signs<br />
Gravesham Borough Council<br />
Highways Agency<br />
High Speed 1 – formerly known as Channel Tunnel Rail Link<br />
Intelligent <strong>Transport</strong> Systems<br />
<strong>Kent</strong> County Council<br />
<strong>Kent</strong> <strong>Thameside</strong><br />
<strong>Kent</strong> <strong>Thameside</strong> Delivery Board<br />
Local <strong>Development</strong> Framework<br />
Local <strong>Transport</strong> Plan<br />
Multi-storey Car Park<br />
Penalty Charge Notice<br />
Prioritising Investments Programmes for <strong>Kent</strong>'s Integrated Network<br />
Public Rights <strong>of</strong> Way<br />
Public <strong>Transport</strong><br />
Route Control Coordinator<br />
Regional Planning Guidance 9a - Thames Gateway Planning Framework<br />
Real Time Information<br />
Real Time Passenger Information<br />
Route Utilisation Study<br />
Split Cycle Offset Optimisation Technique – (Traffic Signals)<br />
South East England Regional Assembly<br />
Supplementary Planning Guidance 4 – <strong>Kent</strong> Vehicle Parking Standards<br />
South <strong>Thameside</strong> <strong>Development</strong> Route 1 – A206 Crossways Boulevard<br />
South <strong>Thameside</strong> <strong>Development</strong> Route 4 – A226 Thames Way<br />
Strategic <strong>Transport</strong> Investment Package Schemes<br />
<strong>Transport</strong> for London<br />
Traffic Management Centre<br />
Traffic Regulation Order<br />
Urban Traffic Control<br />
Urban Traffic Management & Control<br />
Variable Messaging Signs<br />
Workplace Parking levy<br />
KTS <strong>Transport</strong> <strong>Strategy</strong> - Technical Summary Final October 2008.doc / Oct-08 4-32