2011 full-year results presentation - Straumann
2011 full-year results presentation - Straumann
2011 full-year results presentation - Straumann

Create successful ePaper yourself
Turn your PDF publications into a flip-book with our unique Google optimized e-Paper software.
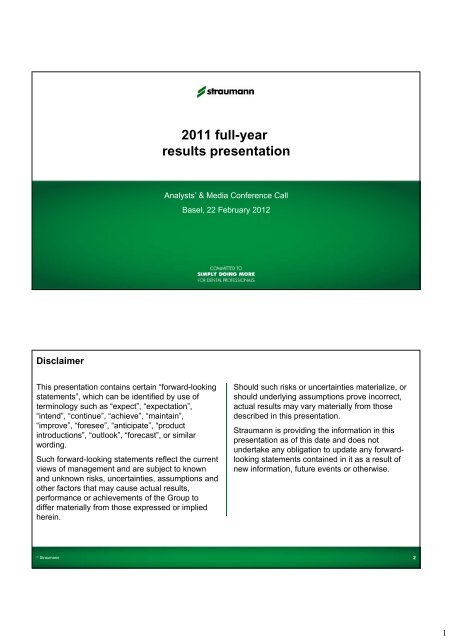
<strong>2011</strong> <strong>full</strong>-<strong>year</strong><br />
<strong>results</strong> <strong>presentation</strong><br />
Analysts’ & Media Conference Call<br />
Basel, 22 February 2012<br />
Disclaimer<br />
This <strong>presentation</strong> contains certain “forward-looking<br />
statements”, which can be identified by use of<br />
terminology such as “expect”, “expectation”,<br />
“intend”, “continue”, “achieve”, “maintain”,<br />
“improve”, “foresee”, “anticipate”, “product<br />
introductions”, “outlook”, “forecast”, or similar<br />
wording.<br />
Such forward-looking statements reflect the current<br />
views of management and are subject to known<br />
and unknown risks, uncertainties, assumptions and<br />
other factors that may cause actual <strong>results</strong>,<br />
performance or achievements of the Group to<br />
differ materially from those expressed or implied<br />
herein.<br />
Should such risks or uncertainties materialize, or<br />
should underlying assumptions prove incorrect,<br />
actual <strong>results</strong> may vary materially from those<br />
described in this <strong>presentation</strong>.<br />
<strong>Straumann</strong> is providing the information in this<br />
<strong>presentation</strong> as of this date and does not<br />
undertake any obligation to update any forwardlooking<br />
statements contained in it as a result of<br />
new information, future events or otherwise.<br />
<strong>Straumann</strong> 2<br />
1
Agenda<br />
Full-<strong>year</strong> highlights<br />
Financial review<br />
Business and regional review<br />
Further innovation brought to customers<br />
Academic presence strengthened<br />
Outlook 2012<br />
Questions & answers<br />
<strong>Straumann</strong> 3<br />
Full-<strong>year</strong> highlights<br />
Beat Spalinger<br />
President & CEO<br />
2
What is happening in the market<br />
North America and RoW performed well, helping the global<br />
tooth restoration and replacement market to low-single-digit<br />
growth in <strong>2011</strong>.<br />
Europe declined amid economic uncertainty and the debt<br />
crisis. Consumer sentiment softened. The second and third<br />
largest markets, Italy and Spain, suffered most.<br />
In APAC the world’s fourth largest dental market, Japan, was<br />
disrupted by natural disaster.<br />
Industry consolidation and new technologies were major topics<br />
in <strong>2011</strong>.<br />
<strong>Straumann</strong> 5<br />
<strong>2011</strong>: A fundamentally positive <strong>year</strong> from a strategic and operational aspect<br />
GROWTH<br />
+4%<br />
in local currencies as<br />
<strong>full</strong>-<strong>year</strong> net revenue reaches<br />
CHF 694 million<br />
CURRENCY IMPACT<br />
71m CHF<br />
lost from top line in unprecedented<br />
currency headwind:<br />
net revenue contracts 6% in<br />
CHF<br />
DRIVERS<br />
+10%<br />
growth (l.c.) in North America;<br />
dynamic emerging markets;<br />
more products sold to more<br />
customers in more geographies<br />
than ever before<br />
POSITION<br />
NO.1<br />
Pole position in implant<br />
dentistry underpinned;<br />
significant steps towards<br />
leadership in digital dentistry<br />
R & D<br />
INNOVATION<br />
CONTINUES<br />
Multiple refinements, novel<br />
solutions and services; 6%<br />
of sales invested in R&D;<br />
pipeline well stocked<br />
JOBS<br />
91<br />
new positions<br />
created worldwide,<br />
mostly in Marketing & Sales<br />
DIVIDEND<br />
3.75 CHF FUTURE<br />
per share maintained; CHF<br />
1.55 thereof paid from capital<br />
contributions<br />
VISION<br />
2020<br />
New organizational structure;<br />
leadership strengthened;<br />
<strong>Straumann</strong> creates roadmap<br />
for sustainable success<br />
<strong>Straumann</strong><br />
6<br />
3
Above-market performance over the past 4 <strong>year</strong>s<br />
25%<br />
20%<br />
15%<br />
Global Dental implant market<br />
by share of sales (100% = CHF 3.5bn)<br />
Others<br />
35%<br />
10%<br />
5%<br />
0%<br />
-5%<br />
-10%<br />
Zimmer Dental<br />
6%<br />
Biomet 3i<br />
8%<br />
Dentsply/Astra<br />
14%<br />
<strong>Straumann</strong><br />
19%<br />
Nobel Biocare<br />
18%<br />
-15%<br />
<strong>Straumann</strong> organic growth Leading dental implant companies 1<br />
<strong>Straumann</strong><br />
1 Market share weighted growth rates (l.c.) of Biomet/3i, Dentsply, Nobel Biocare, <strong>Straumann</strong> and Zimmer; collectively representing 2/3 of the dental implant market.<br />
7<br />
Source: Published company data, 10-K and management comments<br />
Financial review<br />
Thomas Dressendörfer<br />
Chief Financial Officer<br />
4
Q4: 2% growth on high baseline in prior <strong>year</strong><br />
FY <strong>2011</strong> net revenue growth<br />
Total Group: CHF 694m<br />
(6.0%)<br />
(10.1%)<br />
or<br />
71m 4.1%<br />
Organic growth by quarter (l.c.)<br />
7%<br />
5%<br />
5% 5%<br />
4%<br />
3%<br />
2%<br />
3%<br />
2%<br />
-1% -1%<br />
Q1 Q2 Q3 Q4 Q1 Q2 Q3 Q4 Q1 Q2 Q3 Q4<br />
Net revenue<br />
in CHF<br />
Currency<br />
effect<br />
Net revenue<br />
in l.c.<br />
-8%<br />
2009 2010 <strong>2011</strong><br />
<strong>Straumann</strong><br />
9<br />
Underlying EBIT in line with guidance despite strong currency headwind<br />
in CHF million<br />
Reported FX adjusted Reported Exceptionals<br />
Preexceptionals<br />
1<br />
Change<br />
FX adjusted<br />
Net Revenue 737.6 666.5 693.6 693.6 4.1%<br />
Gross profit<br />
587.0 520.0 528.5 528.5<br />
Gross profit margin 79.6% 78.0% 76.2% 76.2% (1.8%)<br />
EBITDA<br />
211.9 171.3 157.4 157.4<br />
EBITDA margin 28.7% 25.7% 22.7% 22.7% (3.0%)<br />
Operating profit (EBIT)<br />
164.3 125.8 79.9 -40.2 120.1<br />
EBIT margin 22.3% 18.9% 11.5% 17.3% (1.6%)<br />
Net profit<br />
131.0 71.0 -26.8 97.8<br />
Net profit margin 17.8% 10.2% 14.1%<br />
Basic earnings per share (EPS) 8.37 4.54 -1.7 6.26<br />
Free Cash Flow<br />
FY 2010 FY <strong>2011</strong><br />
154.2 121.1<br />
Free Cash Flow margin 20.9% 17.5%<br />
<strong>Straumann</strong><br />
1<br />
Throughout this <strong>presentation</strong> the term ‘pre-exceptionals’ means that the impairment of intangible assets (CHF 40 million) and the<br />
corresponding deferred tax effect (CHF 13 million) are not included.<br />
10<br />
5
Main factors influencing profitability<br />
▼ Unprecedented negative currency impact takes CHF 71 million off top line, with<br />
transactional effect of CHF 38 million on operating income<br />
▼ Intangible asset impairment of CHF 40 million<br />
▼ Lower-margin digital solutions business grows faster than implants, mainly due to<br />
successful scanner roll-out; production-related one-off costs impact gross margin<br />
▼ Investment in Marketing & Sales to drive future growth<br />
▲ Efficiency improvements in implant and CADCAM production<br />
▲ Lower effective tax rate related to the impairment<br />
<strong>Straumann</strong><br />
11<br />
Volume expansion in core business offset by FX effect and business mix<br />
In % of net revenue<br />
-1.6%<br />
0.8%<br />
-0.3%<br />
-0.2%<br />
-1.1%<br />
-1.0%<br />
79.6% 78.0%<br />
76.2%<br />
Gross profit<br />
FY 2010<br />
FX effect<br />
FX-adjusted Volume Pricing<br />
gross profit<br />
leverage & (Distributor)<br />
FY 2010<br />
efficiency gains<br />
Inventory<br />
Change<br />
Business mix<br />
Digital Solutions<br />
Production<br />
related<br />
one-offs in H2<br />
Gross profit<br />
FY <strong>2011</strong><br />
<strong>Straumann</strong><br />
12<br />
6
EBIT margin before FX impacted by business mix and investment in M&S<br />
In % of net revenue<br />
-3.4%<br />
or<br />
CHF 38 m<br />
-1.8%<br />
0.4% -0.4% 0.3% -5.8%<br />
22.3%<br />
18.9%<br />
17.3%<br />
11.5%<br />
EBIT margin<br />
FY 2010<br />
FX effect<br />
FX-adj. EBIT Gross profit SG&A 2 Reorganisation<br />
margin FY 2010<br />
costs<br />
R&D<br />
EBIT margin<br />
FY <strong>2011</strong><br />
Impairment 1<br />
Reported EBIT<br />
margin FY <strong>2011</strong><br />
<strong>Straumann</strong><br />
1<br />
Impairment of intangible assets in the amount of CHF 40 million.<br />
2<br />
Includes ‘other income’ and a reversal of provisions in the amount of CHF 5 million.<br />
13<br />
Net profit impacted by currency headwind and impairment charge<br />
In CHF million<br />
-37.2<br />
7.3<br />
8.6<br />
-14.6<br />
0.3<br />
2.3<br />
-26.8<br />
2010 <strong>2011</strong><br />
Interest income 1.1 1.6<br />
Results from associates 0.2<br />
Interest expenses (1.0) (0.5)<br />
FX gains/losses (incl.<br />
hedging instruments) (4.7) (3.6)<br />
Financial result (net) (4.6) (2.3)<br />
131.1<br />
97.8<br />
71.0<br />
Net profit<br />
margin 17.8%<br />
Net profit<br />
margin 14.1%<br />
Net profit<br />
margin 10.2%<br />
Net profit FY<br />
2010<br />
FX<br />
Corresponding<br />
tax effect<br />
Additional<br />
gross profit<br />
Higher<br />
SG&A<br />
R&D<br />
Financial<br />
result<br />
Pre-excep.<br />
net profit<br />
FY <strong>2011</strong><br />
Excep.<br />
Net profit FY<br />
<strong>2011</strong><br />
<strong>Straumann</strong><br />
1<br />
Includes other income.<br />
2<br />
Exceptionals included the aforementioned impairment and related deferred tax effects.<br />
14<br />
7
Strong cash flow maintained – in challenging conditions<br />
In CHF million<br />
- 58.5<br />
FY 2010 FY <strong>2011</strong><br />
Inventory: Days<br />
of supply 158 123<br />
Receivables: Days of<br />
sales outstanding 45 48<br />
-1.0<br />
8.6 2.6<br />
16.0 -0.7<br />
154.2<br />
FCF margin<br />
20.9%<br />
CHF 40m thereof related<br />
to currency developments<br />
121.1<br />
FCF margin<br />
17.5%<br />
Free Cash<br />
Flow FY<br />
2010<br />
Lower<br />
Gross<br />
profit<br />
Higher cash<br />
OPEX<br />
Improvement<br />
NWC<br />
Lower<br />
CAPEX<br />
Lower tax Others Free Cash<br />
payments 1 Flow FY<br />
<strong>2011</strong><br />
<strong>Straumann</strong><br />
1<br />
Incl. VAT tax payments of CHF 3 million.<br />
15<br />
High strategic flexibility thanks to strong liquidity and cash generation<br />
In CHF million<br />
140<br />
-19<br />
-59<br />
-35<br />
-6<br />
6<br />
350<br />
Free Cash Flow<br />
CHF 121m<br />
CHF 24m thereof used for<br />
purchase program<br />
377<br />
Cash<br />
balance<br />
<strong>year</strong>-end<br />
2010<br />
Operating<br />
cash flow<br />
CAPEX<br />
2010 Treasury<br />
dividend shares<br />
bought<br />
Investments Others 2<br />
(associates 1 )<br />
Cash<br />
balance<br />
<strong>year</strong>-end<br />
<strong>2011</strong><br />
<strong>Straumann</strong><br />
1<br />
Acquisition of minority stake in Dental Wings<br />
2<br />
Mainly exchange rate differences<br />
16<br />
8
Dividend payout ratio increased<br />
BoD proposes to the AGM:<br />
in CHF<br />
5<br />
Payout ratio<br />
80%<br />
Dividend maintained at CHF 3.75 per<br />
share 1<br />
CHF 1.55 thereof paid with ‘reserves from<br />
capital contributions’<br />
4<br />
3<br />
2<br />
1<br />
Payout band width<br />
2.50<br />
3.00<br />
3.75 3.75 3.75<br />
1.85 1.55<br />
1.90 2.20<br />
60%<br />
40%<br />
20%<br />
0<br />
2005 2006 2007 2008 2009 2010 <strong>2011</strong><br />
0%<br />
Paid with reserves from capital contributions ('tax exemption¨)<br />
Dividend<br />
Payout ratio (excl. exceptionals)<br />
<strong>Straumann</strong><br />
1 Subject to approval by the Shareholders’ General Meeting<br />
17<br />
Businesses and regional review<br />
Beat Spalinger<br />
President & CEO<br />
9
Growth accross all businesses<br />
Implants<br />
Restoratives<br />
Regeneratives<br />
Volume expansion driven by<br />
Bone Level range and Roxolid;<br />
premium price positioning<br />
defended<br />
Scanner sales to drive future<br />
prosthetic element business<br />
expansion<br />
Supported by Allograft and<br />
roll-out of MembraGel<br />
<strong>Straumann</strong> 19<br />
Growth across all regions, led by North America and RoW<br />
FY <strong>2011</strong> regional growth<br />
Net revenue by region (rounded)<br />
0%<br />
2%<br />
Europe<br />
10%<br />
53%<br />
North<br />
America<br />
26% 25%<br />
19%<br />
6% 4%<br />
Asia/Pacific ROW Group<br />
22%<br />
15%<br />
5%<br />
58%<br />
Europe<br />
CHF 404m<br />
North America<br />
CHF 156m<br />
Asia/Pacific<br />
CHF 101m<br />
ROW<br />
CHF 33m<br />
Total Group<br />
CHF 694m<br />
Growth in l.c.<br />
Contribution to global growth<br />
<strong>Straumann</strong> 20<br />
10
Europe stable amid economic uncertainty<br />
Challenging environment limits possibility for growth<br />
Consumer sentiment fragile<br />
Situation in Italy and Spain deteriorated in the latter part<br />
of the <strong>year</strong><br />
Q4 contraction due to decline in Spain and Italy; Germany<br />
rises; strong growth in France and Eastern Europe<br />
(in CHF million) Q4 10 Q4 11 % CHF FY 10 FY 11 % CHF<br />
Net revenue 110.9 100.7 (9.2%) 444.9 404.4 (9.1%)<br />
Growth in % l.c. 6.4% (3.4%) 3.2% 0.2%<br />
<strong>Straumann</strong> 21<br />
Double-digit growth continues in North America<br />
Q4 (+12%) is strongest quarter in <strong>2011</strong>, despite tough<br />
comparison baseline<br />
Growth in Canada and the US driven by implants and<br />
intra-oral scanners; Regeneratives continue to develop<br />
well<br />
Currency headwind of 9% points<br />
(in CHF million) Q4 10 Q4 11 % CHF FY 10 FY 11 % CHF<br />
Net revenue 41.3 42.4 2.8% 164.7 155.6 (5.5%)<br />
Growth in % l.c. 11.9% 12.0% 8.7% 10.2%<br />
<strong>Straumann</strong> 22<br />
11
Solid growth maintained in Asia/Pacific; strong expansion in RoW<br />
Q4: solid growth in APAC driven by China and Japan<br />
Bone Level implant roll-out progresses in Japan<br />
Korea declines from exceptionally strong Q4 in 2010<br />
Customer gains in Brazil; good performance in Mexico<br />
(in CHF million) Q4 10 Q4 11 % CHF FY 10 FY 11 % CHF<br />
APAC net revenue 24.2 25.0 3.0% 100.5 100.7 0.2%<br />
Growth in % l.c. 2.9% 5.7% 2.1% 5.5%<br />
RoW net revenue 7.2 7.5 4.7% 27.5 32.9 19.6%<br />
Growth in % l.c. 10.7% 11.1% 12.3% 26.0%<br />
<strong>Straumann</strong> 23<br />
Further innovation brought to customers<br />
12
Multiple refinements and new products in <strong>2011</strong><br />
<strong>Straumann</strong> ® Classic<br />
<strong>Straumann</strong> ® All-in-one Sets<br />
<strong>Straumann</strong> ® Anatomic IPS<br />
e.max ® Abutment NC<br />
Nano and other<br />
high-end ceramics<br />
<strong>Straumann</strong> ® CARES ®<br />
Variobase coping<br />
coDiagnostiX 8 software<br />
<strong>Straumann</strong> ® CARES Visual 6.2<br />
Screw-retained bars and<br />
bridges, <strong>full</strong> contour inlays,<br />
onlays and veneers<br />
<strong>Straumann</strong> ® repositionable<br />
implant analog<br />
<strong>Straumann</strong> 25<br />
New-generation small-diameter soft tissue-level implant<br />
Soft Tissue Level philosophy<br />
SLActive ® surface<br />
Roxolid ® material<br />
Consistent Emergence Profiles<br />
CrossFit ® at soft tissue level<br />
Bone Control Design<br />
Standard Plus Narrow Neck CrossFit ® (NNC)<br />
• Roxolid ® , our strongest material<br />
• SLActive ® , our fastest healing implant surface<br />
• CrossFit ® , our reliable, intuitive connection<br />
• Soft tissue level design: 1 stage surgery<br />
• New transfer piece: handling convenience<br />
For spaces and narrow bone ridges<br />
• Indications include: front single-tooth gaps or<br />
multiple-tooth replacement (bridges and<br />
fixed/removable overdentures)<br />
Controlled market release underway<br />
• Full launch: spring 2012 in Europe and N. America 1<br />
• Other markets 1 to follow<br />
<strong>Straumann</strong> 1 Pending regulatory approvals/clearances<br />
26<br />
13
<strong>Straumann</strong> CARES System 7.0 launch<br />
New CARES Visual software based on<br />
DWOS open standard software platform<br />
Labs now have the flexibility to produce<br />
prosthetic elements through third-party<br />
milling or <strong>Straumann</strong>’s validated CAM<br />
process<br />
Fear of being ‘locked in’ to a single<br />
manufacturer dispelled; labs now have<br />
confidence to invest in CADCAM<br />
Launch at Chicago Midwinter meeting<br />
<strong>Straumann</strong> 27<br />
CARES 7.0 – at the heart of the prosthetic workflow<br />
Physical Inputs Data capture Design process Manufacturing In-mouth product<br />
DVT<br />
Pre-operative<br />
Implant<br />
Intra-oral<br />
Central<br />
In-lab<br />
Drill guide<br />
Abutment<br />
Coping / bridge<br />
Model<br />
Design<br />
Central<br />
In/onlay<br />
Full contour<br />
Impression<br />
Die<br />
Desktop scan<br />
Wax-up<br />
Scan body<br />
Impression scan<br />
dwos inside<br />
3 rd party<br />
(e.g.in-lab,<br />
chairside)<br />
Dentures<br />
Mouth guards<br />
<strong>Straumann</strong><br />
Certain services currently in development 28<br />
14
Stocked pipeline despite recent introductions<br />
Project<br />
• Small diameter TL Implants<br />
• New implant material<br />
• Implant maintenance<br />
• Soft tissue control<br />
• Advanced planning, guided surgery<br />
• Standard software platform<br />
• CARES 7.0/8.0<br />
• Multi-unit restoration for Bone Level implants<br />
• CADCAM abutment solutions<br />
• Intra-oral scanner connectivity<br />
• Restorative services<br />
• New restorative materials<br />
• Enhanced bone graft material<br />
• PEG technology<br />
Benefits<br />
• More options; simplified handling<br />
• Tooth-colored<br />
• Rescue compromised implants<br />
• Tissue control around implants<br />
• New software<br />
• Standardization of digital workflows<br />
• CARES external workflow<br />
• More options<br />
• More options<br />
• Improved communication & flexibility<br />
• Access to digital workflows<br />
• Enhanced efficiency & handling<br />
• Enhanced regeneration<br />
• More applications<br />
<strong>Straumann</strong> 29<br />
Academic presence strengthened<br />
15
ITI membership now exceeds 11 000<br />
World‘s largest implant dentistry network<br />
25% increase in <strong>2011</strong> to >10 000 Fellows and Members<br />
in 95 countries<br />
New Study Club concept drives increase<br />
<strong>Straumann</strong> is exclusive implant manufacturing partner<br />
12'000<br />
10'000<br />
8'000<br />
6'000<br />
4'000<br />
2'000<br />
0<br />
2007 2008 2009 2010 <strong>2011</strong><br />
Fellows<br />
ITI Members<br />
<strong>Straumann</strong> 31<br />
Novel education concept with Academic Center for Dentistry in Amsterdam<br />
ACTA’s undergraduate program to include teaching on all basic aspects of oral implantology,<br />
often covered only in postgraduate courses<br />
400 hours a <strong>year</strong> of extra training reserved for implant dentistry<br />
Program focused on one implant system; <strong>Straumann</strong> provides materials, planning software etc.<br />
ACTA has 500 enrolled dental students and treats approximately 500 patients per day<br />
<strong>Straumann</strong> 32<br />
16
Refreshing our internet footprint<br />
Corporate website redesigned and completely<br />
revised<br />
Powerful new search function – faster, easier<br />
access to information<br />
Greater range and depth of content<br />
Focus on information needs of patients and dental<br />
professionals in Country updates in 2012<br />
<strong>Straumann</strong> 33<br />
Focusing our organization to increase effectiveness<br />
Increased portfolio, reach, customer base and sales complexity prompted complete<br />
reorganization – from bottom to top<br />
CEO<br />
Local Sales<br />
Channel<br />
4 focused sales forces<br />
Country<br />
organization<br />
3 sales regions<br />
Beat Spalinger<br />
Business Unit<br />
organization<br />
2 main BUs<br />
Finance<br />
BU<br />
Prosthetics<br />
BU Surgical<br />
Sales I<br />
EMEA/<br />
LATAM<br />
Sales II<br />
NAM<br />
Sales III<br />
APAC<br />
Corporate<br />
organization<br />
EMB strengthened; new<br />
Corporate structure<br />
Thomas<br />
Dressendörfer<br />
Sandro<br />
Matter<br />
René<br />
Willi<br />
Frank<br />
Hemm<br />
Andy<br />
Molnar<br />
Beat Spalinger<br />
(ad interim)<br />
<strong>Straumann</strong> 34<br />
17
Building from a position of strength and shaping our organisation for the future<br />
New organisation will:<br />
Bring us closer to customers<br />
Bring better solutions to the market more effectively<br />
Encourage entrepreneurship, ownership and<br />
accountability and engagement (no downsizing)<br />
Spur top-line growth by increasing sales efficiency<br />
Help us to achieve our strategic goals and Vision 2020<br />
<strong>Straumann</strong> 35<br />
Outlook 2012 and beyond<br />
18
Implant markets in large developed countries are far from mature<br />
Implants placed per 10 000 population per <strong>year</strong><br />
Which means that only<br />
~1 million US patients are<br />
treated annually<br />
<strong>2011</strong> data; <strong>Straumann</strong> estimates, based on OECD, various statistics offices and Millennium Research Group. The population in the US is aging, resulting in more patients with tooth loss.<br />
<strong>Straumann</strong> Patients who have been treated are likely to require maintenance work. Most people lose more than one tooth in life and thus re-enter the treatment path.<br />
37<br />
Outlook (barring unforeseen circumstances)<br />
2012<br />
Market<br />
<strong>Straumann</strong><br />
• Optimism for N. America and emerging markets; Europe faces challenges<br />
• Our markets are expected to grow in the low-single-digit range in 2012<br />
We are confident that we can grow ahead of the market in local currencies<br />
With current exchange rates, we foresee little currency headwind in 2012<br />
Continued investment to create/drive superior solutions/services, and to optimize efficiency<br />
We expect gross and EBIT margins at least in line with <strong>2011</strong> levels<br />
Beyond 2012<br />
Market<br />
Vision 2020<br />
• Economic volatility for several <strong>year</strong>s: market growth expected in high-single-digit range,<br />
which still provides ample opportunity for shareholder value creation<br />
Long-term growth drivers in our markets are valid and intact. <strong>Straumann</strong> has clear roadmap<br />
and is well positioned for sustained success. Presentation at Capital Markets Day on 16 May<br />
<strong>Straumann</strong> Please see media release or Annual Report for <strong>full</strong> version of this summary<br />
38<br />
19
Questions & answers<br />
<strong>2011</strong> Annual Report – pre-print version available<br />
Comprehensive value reporting<br />
Independent expert opinions, executive<br />
interviews, corporate governance,<br />
compensation report, environmental<br />
report, outlooks, etc.<br />
GRI checked to level B<br />
<strong>Straumann</strong>’s reporting quality recognized<br />
in <strong>2011</strong> Swiss Annual Report awards<br />
<strong>Straumann</strong> 40<br />
20
Calendar of upcoming events<br />
24 February Roadshow Chicago<br />
27 February Citigroup Global Healthcare conference New York<br />
28 February Roadshow Denver<br />
29 February Roadshow San Francisco<br />
01 March Roadshow Los Angeles<br />
13 March Roadshow Frankfurt<br />
14 March Morgan Stanley Medtech conference London<br />
15 March Roadshow Amsterdam, Edinburgh<br />
04 April Annual General Meeting Basel<br />
10 April Ex-Dividend Date<br />
16 April First Quarter <strong>results</strong> Conference Call<br />
15/16 May 2012 Capital Markets Day Amsterdam<br />
Detailed calendar on www.straumann.com<br />
<strong>Straumann</strong> 41<br />
Appendix<br />
21
Net revenue growth by region<br />
CHF million<br />
Q1 2010 Q2 2010 Q3 2010 Q4 2010 Q1 <strong>2011</strong> Q2 <strong>2011</strong><br />
Q3 <strong>2011</strong><br />
Q4 <strong>2011</strong><br />
Europe<br />
growth in % CHF<br />
growth in % l.c.<br />
North America<br />
growth in % CHF<br />
growth in % l.c.<br />
125.0<br />
(0.2)<br />
1.4<br />
41.7<br />
3.6<br />
8.4<br />
116.6<br />
(2.0)<br />
3.9<br />
43.6<br />
8.9<br />
7.7<br />
92.4<br />
(9.0)<br />
1.2<br />
38.2<br />
3.6<br />
6.9<br />
110.9<br />
(4.9)<br />
6.4<br />
41.3<br />
8.1<br />
11.9<br />
113.9<br />
(8.8)<br />
2.2<br />
40.1<br />
(3.7)<br />
8.0<br />
105.4<br />
(9.7)<br />
0.3<br />
37.9<br />
(13.2)<br />
9.6<br />
84.4<br />
(8.7)<br />
1.7<br />
35.2<br />
(7.8)<br />
11.3<br />
100.7<br />
(9.2)<br />
(3.4)<br />
42.4<br />
2.8<br />
12.0<br />
Asia / Pacific<br />
growth in % CHF<br />
growth in % l.c.<br />
Rest of the world<br />
25.5<br />
(0.5)<br />
(1.7)<br />
7.1<br />
26.2<br />
15.0<br />
8.3<br />
6.8<br />
24.6<br />
2.7<br />
(0.6)<br />
6.5<br />
24.2<br />
5.9<br />
2.9<br />
7.2<br />
25.5<br />
0.0<br />
2.2<br />
8.9<br />
26.2<br />
0.0<br />
8.9<br />
9.4<br />
24.0<br />
(2.1)<br />
5.2<br />
7.1<br />
25.0<br />
3.0<br />
5.7<br />
7.5<br />
growth in % CHF<br />
growth in % l.c.<br />
Group<br />
growth in % CHF<br />
growth in % l.c.<br />
33.6<br />
26.3<br />
199.2<br />
1.5<br />
3.1<br />
14.0<br />
5.9<br />
193.2<br />
2.9<br />
5.4<br />
11.2<br />
7.6<br />
161.6<br />
(3.9)<br />
2.5<br />
12.7<br />
10.7<br />
183.6<br />
(0.2)<br />
7.2<br />
24.8<br />
26.9<br />
188.4<br />
(5.4)<br />
4.3<br />
39.2<br />
48.5<br />
178.9<br />
(7.4)<br />
5.2<br />
9.8<br />
18.1<br />
150.7<br />
(6.7)<br />
5.1<br />
4.7<br />
11.1<br />
175.6<br />
(4.4)<br />
1.8<br />
<strong>Straumann</strong> 43<br />
Currency impact cuts top line by CHF 71 million<br />
1.5<br />
EURCHF<br />
1.4<br />
1.3<br />
1.2<br />
1.1<br />
Average exchange rates (rounded)<br />
FY 2010 FY <strong>2011</strong> YTD 2012 2<br />
EURCHF 1.38 1.23 1.21<br />
USDCHF 1.04 0.89 0.93<br />
JPYCHF 1.19 1.11 1.20<br />
1<br />
Jan Feb Mar Apr May Jun Jul Sep Oct Nov Dec<br />
USDCHF<br />
1.2<br />
1.1<br />
Net revenue breakdown<br />
CHF<br />
14%<br />
CHF<br />
42%<br />
Cost breakdown 1<br />
1<br />
0.9<br />
Other<br />
18%<br />
EUR<br />
44%<br />
EUR<br />
27%<br />
0.8<br />
0.7<br />
Jan Feb Mar Apr May Jun Jul Sep Oct Nov Dec<br />
2010 <strong>2011</strong><br />
USD/CAD/AUD<br />
24%<br />
Other<br />
14% USD/CAD/AUD<br />
17%<br />
1 These distribution charts represent the total net revenues and the total COGS, SG&A costs as well as R&D expenses in the various currencies. All numbers<br />
<strong>Straumann</strong> are rounded and based on <strong>2011</strong> figures.<br />
44<br />
2 Average spot rates as per 21 February 2012<br />
22
Your investor relations & media contacts<br />
Corporate Investor Relations<br />
Fabian Hildbrand<br />
Phone +41 (0)61 965 13 27<br />
Mobile +41 (0)79 392 80 32<br />
Email<br />
fabian.hildbrand@straumann.com<br />
Corporate Communications<br />
Mark Hill<br />
Thomas Konrad<br />
Phone +41 (0)61 965 13 21 +41 (0)61 965 15 46<br />
Email mark.hill@straumann.com thomas.konrad@straumann.com<br />
<strong>Straumann</strong> 45<br />
www.straumann.com<br />
23