Annual Report 2011 - Hysan Development Company Limited
Annual Report 2011 - Hysan Development Company Limited
Annual Report 2011 - Hysan Development Company Limited

Create successful ePaper yourself
Turn your PDF publications into a flip-book with our unique Google optimized e-Paper software.
Management’s Discussion<br />
and Analysis<br />
<strong>Hysan</strong> is principally engaged, together with its subsidiaries and associates, in investment,<br />
development and management of quality properties in prime locations, and the Group’s<br />
turnover and results are primarily derived from leasing of investment properties located in Hong<br />
Kong. Throughout the year, our investment property interests totaled some 3.8 million gross<br />
square feet of high-quality office, retail and residential space in Hong Kong, excluding <strong>Hysan</strong><br />
Place at 500 Hennessy Road, which is currently under redevelopment.<br />
Review of Results<br />
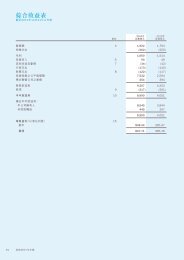
The Group’s turnover continued to record growth and reached HK$1,922 million in <strong>2011</strong>,<br />
representing an increase of 9.0% from HK$1,764 million in 2010. The rise principally reflected<br />
the further improvement in occupancy and positive rental reversion. Higher retail turnover rent<br />
also contributed to the revenue growth of our retail sector. The turnover of each sector was<br />
recorded as below:<br />
<strong>2011</strong><br />
HK$ million<br />
2010<br />
HK$ million<br />
Change<br />
HK$ million<br />
Change<br />
%<br />
Office sector 820 770 50 +6.5<br />
Retail sector 789 700 89 +12.7<br />
Residential sector 313 294 19 +6.5<br />
1,922 1,764 158 +9.0<br />
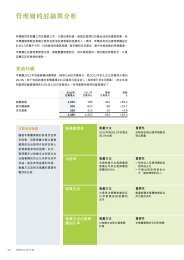
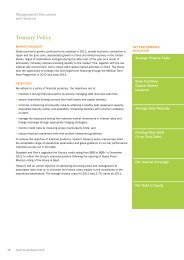
Key Performance Indicators<br />
While many factors contribute to the results of the<br />
Group’s businesses, turnover growth and occupancy rate<br />
are the key drivers used by the Group’s management for<br />
assessment of the performance of our core leasing<br />
business. In addition, the management uses property<br />
expenses and such expenses as a percentage of<br />
turnover to assess cost effectiveness. The nature of<br />
these performance indicators, the way they are<br />
measured and their significance to the Group are set out<br />
in this table.<br />
Turnover<br />
Growth<br />
Occupancy<br />
Rate<br />
Property<br />
Expenses<br />
Property<br />
Expenses as a<br />
Percentage of<br />
Turnover<br />
How is it measured<br />
Rental revenue in <strong>2011</strong> as<br />
compared to that in 2010<br />
How is it measured<br />
Percentage of total area leased<br />
to tenants over total lettable<br />
area of each sector<br />
How are they<br />
measured<br />
Principally being costs directly<br />
associated with the day-to-day<br />
operations of the Group’s<br />
property portfolio<br />
How is it measured<br />
Calculated by dividing property<br />
expenses by turnover<br />
30<br />
<strong>Hysan</strong> <strong>Annual</strong> <strong>Report</strong> <strong>2011</strong>